


George Dorgan
My articles My siteAbout meMy videosMy books
Follow on:LinkedINTwitterSeeking Alpha
CFA SocietyEconomicBlogs
The difference between foreign assets – assets held abroad by locals – and foreign liabilities – local assets held by foreigners – is called the net international investment position (NIIP). Similarly, net worth, the NIIP, is dependent on the development of markets, in particular for countries like Switzerland that exhibit a strongly positive NIIP.
Net International Investment Position in % of GDP, source IMF
The NIIP sums up the balance of payments for each year.
Due to continuing current account deficits the NIIP of the United States, was getting more and more negative.

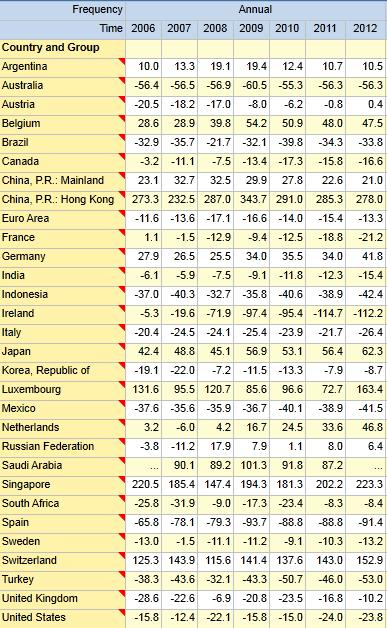
The following table shows the cumulated current account surpluses, which is mostly in line with the NIIP.
Source IMF and Wikipedia , data from 2009
Country Population mil. (2009) Cumulated Curr. Acc. bn$ 2009 NIIP per capita 2009 NIIP in % GDP 2009 NIIP in % GDP 2013
Top of list (positive cum. current accounts)
Japan 127.694 2747.943 21520 56.9% 67.9%
China 1327.658 1521.887 1146 29.9% 21.2%
Germany 82.120 1047.328 12754 31.1% 43.9%
Russia 142.000 613.978 4324 7.9% 6.2%
Switzerland 7.310 596.977 81666 141.4% 145.4%
Netherlands 16.704 523.055 31313 16.7% 46.2%
Saudi Arabia 24.897 451.337 18128 100.9% 107.3%
Norway 4.799 444.011 92522 79.1% 99.9%
Taiwan (Republic of China) 23.037 365.121 15849
Kuwait 3.443 346.713 100701
Singapore 4.668 309.727 66351 184.8% 190.9%
United Arab Emirates 4.764 257.365 54023
Sweden 9.179 232.236 25301 -10.6% -4.8%
Venezuela 28.050 191.734 6835
Hong Kong SAR 7.009 188.310 26867 343.7% 280.0%
Belgium 10.750 186.513 17350 54.2% 44.0%
Qatar 1.098 145.276 132310
Finland 5.270 85.127 16153 6.6% 15.8%
Bottom of list (neg. cum. current accounts)
Iceland 0.316 -21.983 -69566
Canada 33.260 -56.757 -1706 -13.4% +1.5%
South Africa 48.687 -69.912 -1436 -17.3% -4.1%
Argentina 39.746 -72.486 -1824 19.4% 13.1%
Hungary 10.055 -91.720 -9122
New Zealand 4.276 -95.316 -22291
India 1190.451 -137.796 -116 -9.1% -17.5%
Poland 38.100 -182.901 -4801 -59.0% -69.3%
Portugal 10.631 -187.217 -17610
Turkey 69.659 -192.089 -2758 -43.2% -53.3%
Brazil 191.870 -220.506 -1149 -32.7% -36.7%
Greece 11.172 -249.371 -22321
Italy 59.336 -262.901 -4431 -26.6% -29.5%
Mexico 106.316 -263.667 -2480 -39.4% -38.6%
Australia 21.323 -529.031 -24810 -60.2% -53.9%
United Kingdom 61.073 -695.155 -11382 -20.8% -2.0%
Spain 45.618 -773.443 -16955 -93.8% -98.2%
United States 304.415 -7,335.869 -24098 -18.2% -32.1%
The Valuation Effect on the NIIP
The net international investment position can change for two reasons. One is deficits or surpluses in the current account, which imply, respectively, net international purchases or sales of assets. The other source of changes inthe NIIP is changes in the price of the financial instruments that compose the country’s international asset and liability positions. So we have that∆NIIP = CA + valuation changes1
Many more details about it can be found at the Cleveland Fed:
Valuation changes can result from movements in the market price of the underlying assets, but in recent years a substantial proportion of the valuation changes has also resulted from the dollar’s depreciation. The dollar has depreciated since its recent peak early 2002 by approximately 30 percent on a trade-weighted basis against a broad array of our key trading partners. When the dollar depreciates, a given amount of foreign currency translates into a greater number of dollars. Because many U.S. claims on foreigners are denominated in foreign currencies, dollar depreciations increase the dollar value of U.S. claims on foreigners. On the other hand, dollar depreciations do little to affect the dollar value of foreign claims on the United States because these are typically denominated in dollars. Absent favorable valuation adjustments, our negative net international investment position would reflect only our cumulative current-account deficit and would be substantially larger than it is today.
The researchers show that between 2000 and 2010, U.S. investments abroad had an increasing percentage of direct investments and securities, while claims on the U.S. rose particularly by foreign central banks (the dollar as a reserve currency). Since the former had a higher yield than the latter, the Americans managed to increase more and more the net income receipts.
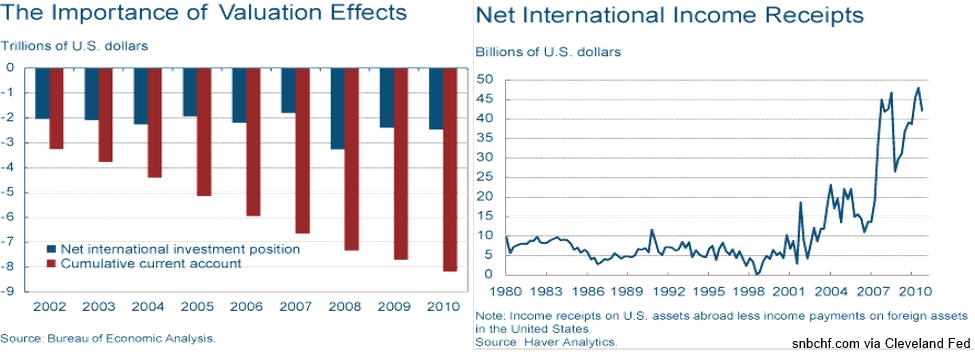
source Cleveland Fed
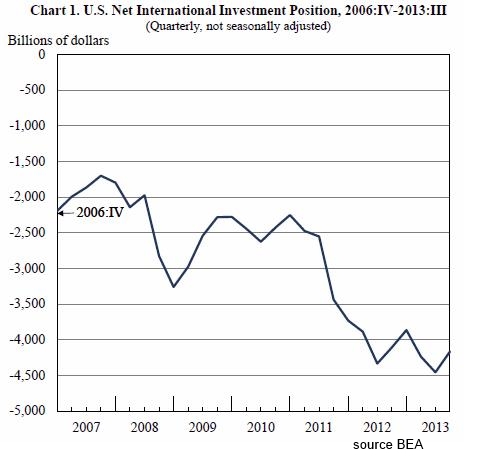
The sharp deterioration of the American NIIP since 2010, can be explained by three reasons:
- Continuing U.S. current account deficits – albeit less than until 2007
- A recovery of U.S. asset prices compared to foreign ones (in particular stocks of emerging markets were falling, American ones were rising) and therefore a stronger valuation of the position of American creditors.
- Only to a limited extend the relatively small appreciation of the dollar until 2013.
Read on the next page about the net international investment position of the United Kingdom.
- Columbia University. “International Macroeconomics”, Stephanie Schmitt-Groh Martın Uribe, April 26, 2013, Online Link [↩]


