
Read More »


 On Swiss National Bank Main SNB Background Info


 6 Monate ohne Gehalt leben? Für die meisten Deutschen kein Problem! #gehalt
18 May 2024
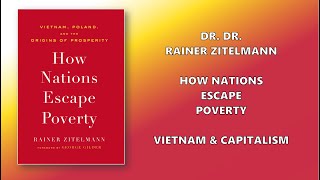 How Nations Escape Poverty – Vietnam & Capitalism
18 May 2024
 Spektakulärer Aussetzer! Als Helge Lindh (SPD) die Nerven verlor!
18 May 2024
 Unwirksame Klauseln im Mietvertrag #shorts
18 May 2024
 Diese Zahl solltest Du kennen | Geld ganz einfach
18 May 2024
 A collection of my best advice on meditation
18 May 2024
 Gold Kilo Bars
17 May 2024
 Gold & Silver Start to Take Off: Will Americans Get on Board?
17 May 2024
 Why American Silver Eagles Are the Ultimate Investment Choice for Both Beginners and Experts
17 May 2024
 Wie 1.000 Euro investieren?
17 May 2024
 E.ON Hauptversammlung 2024
17 May 2024
 Darum lohnt sich eine Steuererklärung
17 May 2024
 Noch 17 Jahre bis zur Rente: Zu spät für ETF-Einstieg? | Saidis Senf
17 May 2024
 How to Set Rules for Smart Investments and Portfolio Management
17 May 2024
 #497 1.095€ vom Finanzamt: 3 Tipps für die richtige Steuersoftware #steuern
17 May 2024
 Userfrage: Geldsystem, Schuldgeld mit Zins und Zinseszins
17 May 2024
 Totale Wahl-Blamage in Bayern!
17 May 2024
 ¡ESCÁNDALO! El GOBIERNO celebra CIFRAS DESASTROZAS del FMI
17 May 2024
 5-17-24 How Long Have You Planned to Live?
17 May 2024
 Investor Watch 2024: Cyber Espionage & National Security Threats | Karim Hijazi
17 May 2024