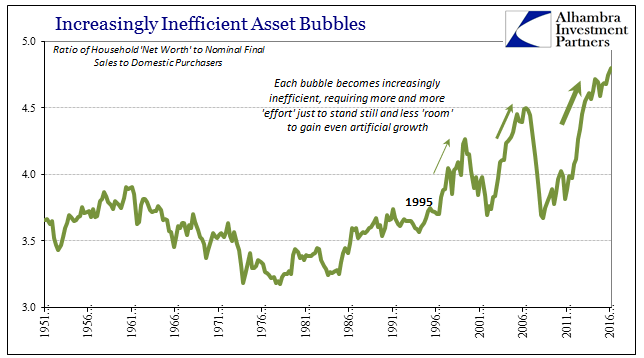
| It is surely one of the primary reasons why many if not most people have so much trouble accepting the trouble the economy is in. With record high stock prices leading to record levels of household net worth, it seems utterly inconsistent to claim those facts against a US economic depression. Weakness might be more easily believed as some overseas problem, leading to only ideas of decoupling or the US as the “cleanest dirty shirt” – the US economy has problems, but how bad can they be? Yet, despite asset price levels and even record debt, all those prove is just how disconnected those places have become from what used to be an efficient way to redistribute financial resources.
|
Household Net Worth, April 1951 - 2016 |
| According to the Fed’s Z1 report, Household net worth climbed by $2 trillion in Q4 alone to $92.8 trillion. That is a 69% increase from the low in Q1 2009, even though Final Sales to Domestic Purchasers have grown by just 30% in that same time. The wealth effect is dead, or, more specifically, it never was. |
Household Net Worth to Real Final Sales, 1951 - 2016 |
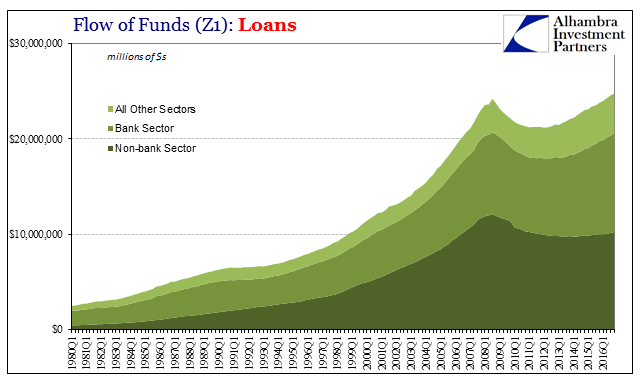
| From the view of net worth, the increase to record debt levels seems manageable. From the more appropriate view of income and economy, it does not, even though US debt levels have grown more slowly post-crisis. That would mean debt is partway between assets and economy, sort of splitting the difference of what monetary policy believes and what it, at best, “achieved.” |
Z1 Credit Lending, Q1 1980 - 2016 |
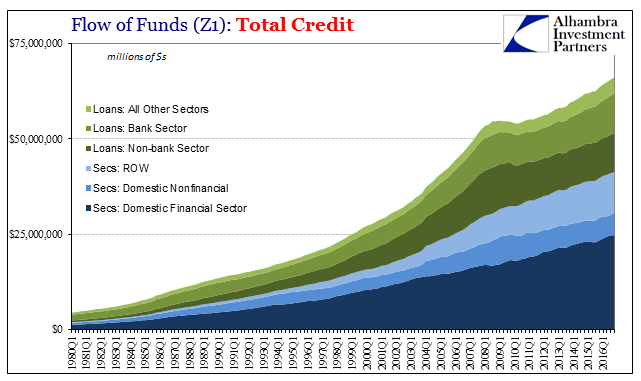
| Total debt (Total Lending plus Total Securities) rose just 0.8% in Q4 2016, the slowest growth rate since Q3 2015. That deceleration was shared equally by loans as well as securities, both registering record highs but also remaining hugely inefficient toward real economic growth and therefore capacity (what is all this debt financing?). |
Z1 Credit, Q1 1980 - 2016 |
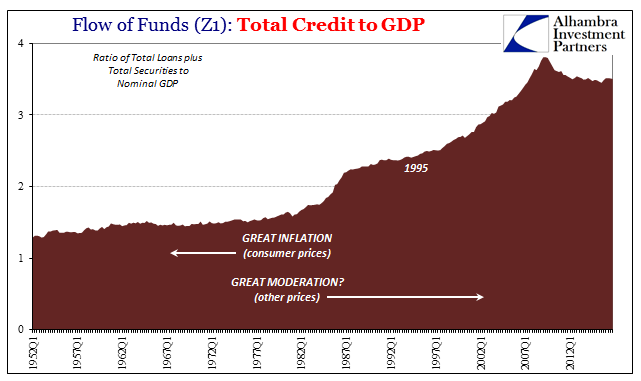
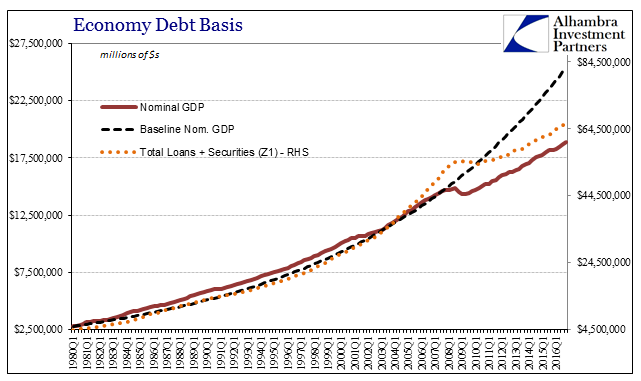
| The minimal amount of overall deleveraging after the Great “Recession” has achieved a similarly minimal amount of financial rebalancing debt to economy. Total credit levels have remained historically out of bounds with the capacity to support them. The chart above may provide a clue as to why that has been, especially in contrast to the Great Inflation. The so-called Great Moderation (which clearly wasn’t that) did not moderate the level of credit expansion to economic expansion (in nominal terms) as had been done even throughout the worst parts of the Great Inflation. |
Credit to GDP, Q1 1952 - 2013 |
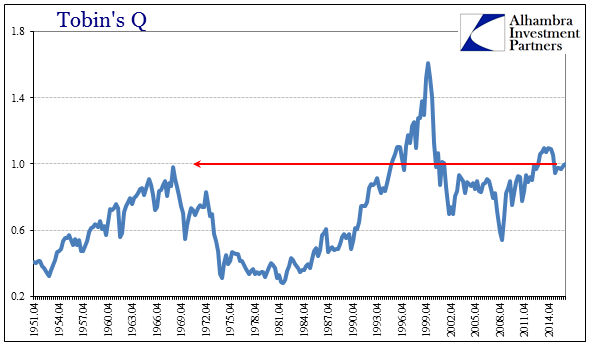
| That would propose monetary expansion (via evolution) into credit expansion (including the blurring distinction between money and credit, as monetary forms became more substitutable and fungible) along the lines of Net Worth and therefore asset prices. It further suggests asset prices are hugely leveraged based on hidden factors of credit and monetary substitution (housing bubble as a predicate of the dot-com bubble, for one example). In terms of just stocks, that would appear to be the verdict of valuation measures like Tobin’s Q (and the modified Q which strips potential real estate bubble pricing from corporate net worth). |
Tobins Q, April 1951 - 2014 |
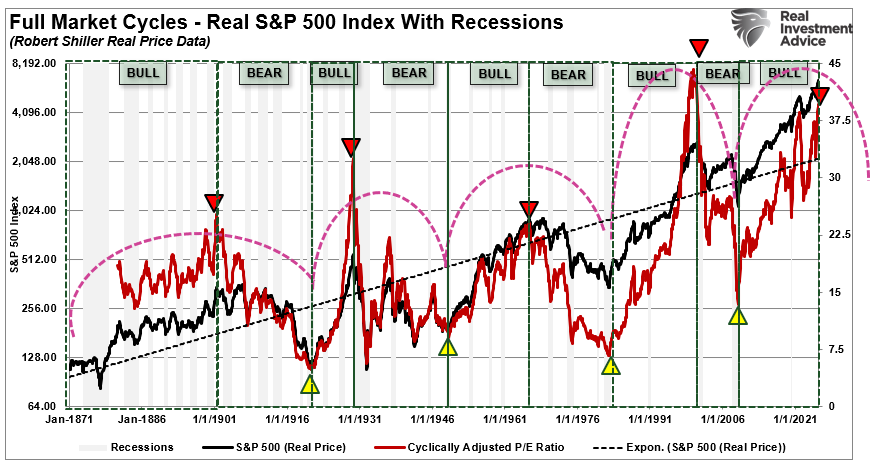
| There isn’t a whole lot of additional insight provided by these statistics and ratios, just more evidence and confirmation that imbalances remain as ridiculous as ever. It really isn’t so difficult to understand why the economy of the 21st century has behaved so radically different than at almost any time in history – especially post-crisis where monetary instability contributes to great uneasiness about the distribution and redistribution of resources (stock repurchases vs. capex, for one example). From the view of the corporate board room, it would appear less risky to “invest” in one’s shares than to actually invest where the economy needs it most (liquidity preferences). And as the imbalances only grow worse, that skew becomes even more skewed (self-reinforcing). |
Stock Valuations, April 1951 - 2014 |
| In very simple terms, what small level of deleveraging was achieved was limited to real economic function rather than in asset prices (and truly debt levels). So rather than rebuilding debt increasing the probability and strength of the recovery, it has done instead the opposite at least in the private economy (which wouldn’t actually be a bad thing) as opposed to the swelled public economy. The result is the seeming paradox stated at the outset – record assets and debt during full-blown and durable depression. |
Credit GDP Baseline, Q1 1980 - 2016 |
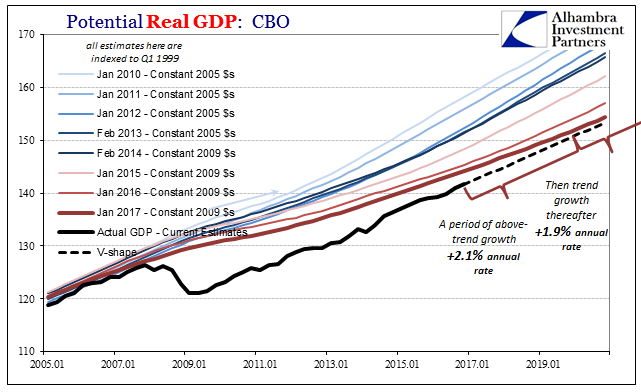
CBO No Recovery 2017 |
Tags: asset bubbles,asset prices,Bonds,credit,currencies,debt,depression,economy,Federal Reserve/Monetary Policy,financial accounts of the united states,lending,Markets,newslettersent,Real estate bubble,stock bubble,stocks,z1


