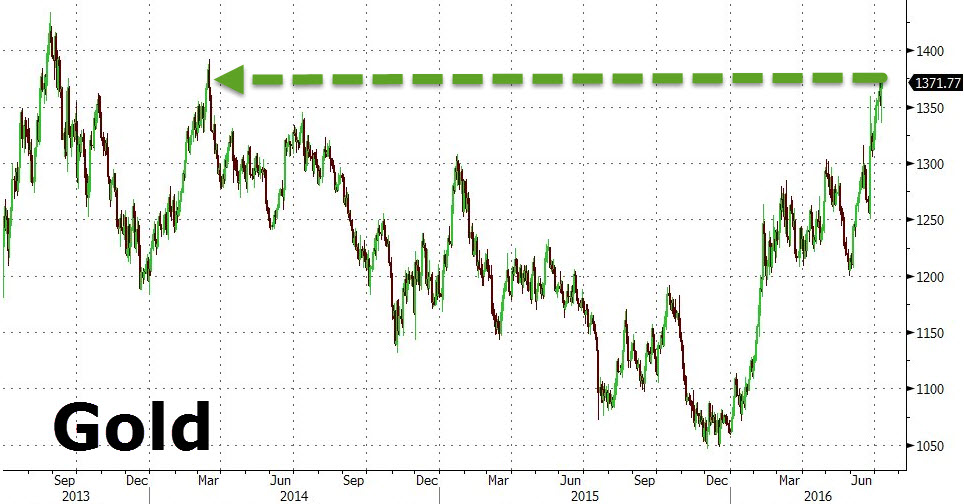
GoldWith both stocks and US Treasury prices at all time highs the market is sensing that something has to give, and that something may just be more QE, which likely explains the move higher in gold to coincide with both risk and risk-haven assets. As of moments ago, gold rose above $1,370, and was back to levels not seen since 2014. Curiously, the move higher is taking place after Friday’s “stellar” jobs report, suggesting that someone does not believe the seasonally-adjusted numbers goalseeked by the BLS. |
|
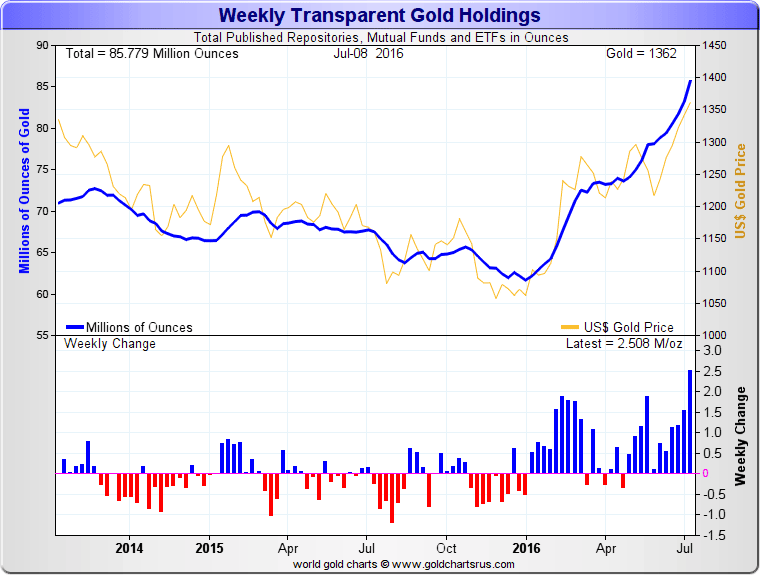
Weekly Transparent Gold HoldingsAnd while we reported last week that one way investors are rushing into the anti-QE safety of gold is by buying paper gold derivatves such as ETFs, which rose above 2,000 tons for the first time since 2013, many others have bypassed paper claims on gold such as GLD entirely, and are rushing into physical. Case in point, Japanese savers who, fearing domestic confiscation, have been accumulating gold in Switzerland. It’s not just the Japanese: as Nick Laird shows, the past week saw the second largest ever increase in physical gold holdings, as the total published holdings of physical funds rose by 2.5 million ounces to 85.8 million, second only to the 4 million ounce increase in early 2009. |
|
| Finally, with even the sellside starting to turn, there may be more upside as the slow money starts to move in. In a whimsical note released on Friday, Bank of America’s metals team writes “Gold: always believe in your soul. Glad you are bound to return. You’re indestructible.”
Yes, we were surprised too, but it’s true. Strange golden “poetry” aside, this is why BofA thinks gold is going to $1,500 and silver’s next stop is an “overshoot” to $30. |
 |
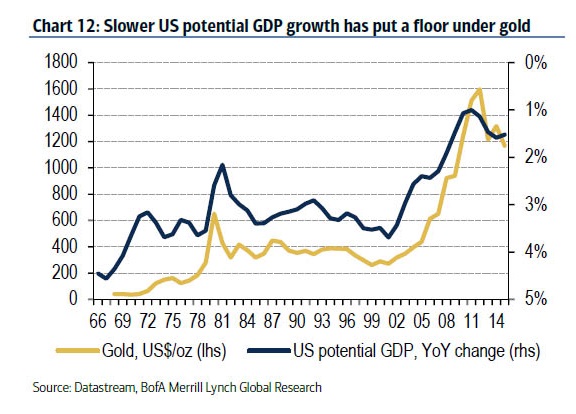
Full story here Are you the author? Previous post See more for Next postThe world has been walking from crisis to crisis and we see risks that this may not change. The importance of that dynamic for the precious metals is mirrored by the high correlation between potential US GDP growth and gold quotations. Many of the underlying issues affecting the global economy are structural, with Brexit merely a symptom of the problems many countries are facing. To that point, we called a bottom in gold in February and Brexit reinforces our view. As such we are upgrading next year’s gold price forecast from $1,325/oz to $1,475/oz. We called a bottom in silver in April on supply and demand dynamics; an overshoot of prices to $30/oz is possible.
Gold heading for $1,500/oz
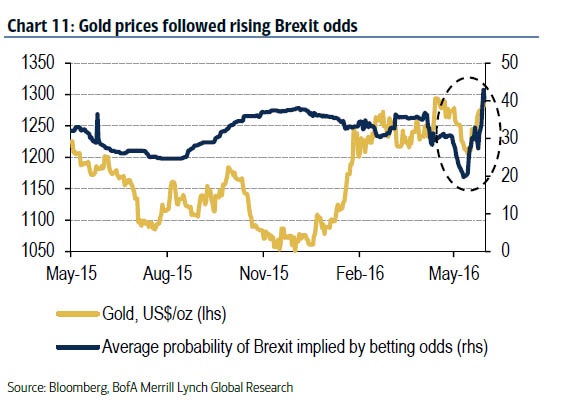
After a weak US labour market report earlier in June, the risk of Brexit added to the gold price rally ahead of the vote (Chart 11) and after. In our view, Brexit has affected gold through various transmission channels. On the fixed income side, US Treasuries and German bunds have benefited from a flight to quality; the current uncertainty also suggests that an accelerated rate hiking cycle is unlikely, so interest rates globally are set to remain low, which in turn reduces the opportunity costs of holding a non-yielding asset like gold. Given this dynamic, we believe gold prices could rise to $1,500/oz near-term.
The world will keep on walking from crisis to crisis
Switching tack slightly, macroeconomic uncertainty in the UK, Eurozone and US remains elevated; the high correlation between US potential GDP growth and gold (Chart 12) highlights how important this is for the precious metal. While the underlying ills are nuanced between countries, an increasing polarization of politics and a rise in populism have been common by-products; to that point, wealth generation/wealth distribution, immigration and sovereignty have caused contentious debates. Of course, this has not helped confidence and did not make it easier for governments to implement the measures necessary to put economies on a more sustainable footing. As a result, a host of countries has moved through a series of mini-crises in recent years, which we believe is unlikely to change. Hence, we reinforce our view first published in February 2016 that gold prices have bottomed.
Silver can overshoot to $30/oz
Gold has been the market’s focus through most of 2016, although silver has outperformed the yellow metal of late. The rally does not necessarily come as a surprise, a point made in April, when we highlighted that silver is bottoming out (Global Metals Weekly: Silver has a silver lining 25 April 2016).
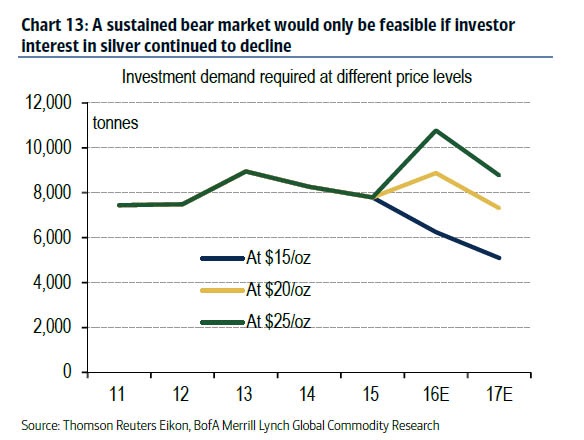
Chart 13 shows the model behind our rationale. That analysis assumes that investors are the marginal buyers, so we ask how strong non-commercial demand needs to be to balance the silver market at $15/oz, $20/oz and $25/oz. Our analysis suggests the following:
- For silver to trade at or below $15/oz, non-commercial market participants would need to reduce purchases further compared to 2015. This is not our base case.
- Silver can average $20/oz if investors increased their purchases slightly, which we believe is likely.
- A sustained rally towards $25/oz would require an increase of non-speculative demand to the tune of 30% YoY. While possible, this looks a tall order.
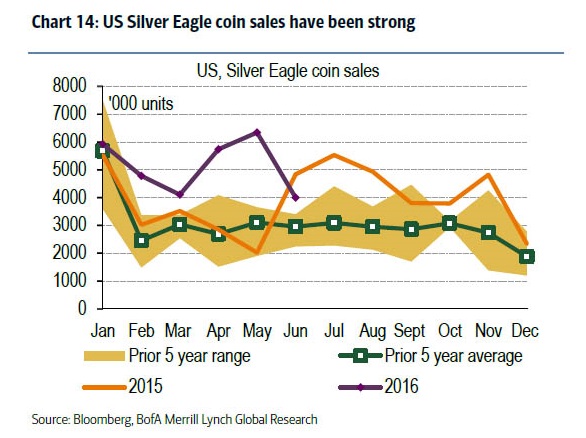
US Silver Eagle coin sales have been strong
Taking a closer look at investment demand, Chart 14 shows that silver coin sales in the US, an important demand segment, have been strong YTD.
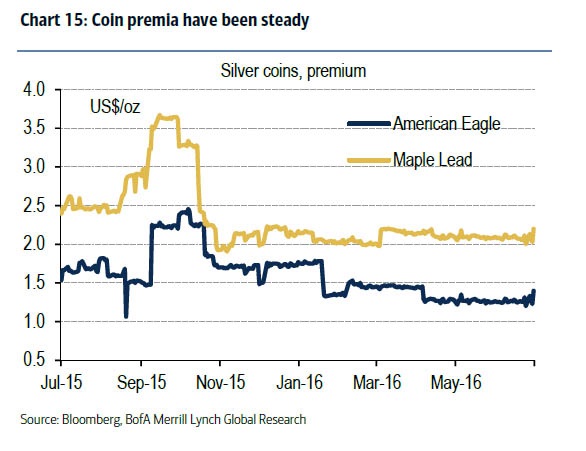
Coin premia have been steady
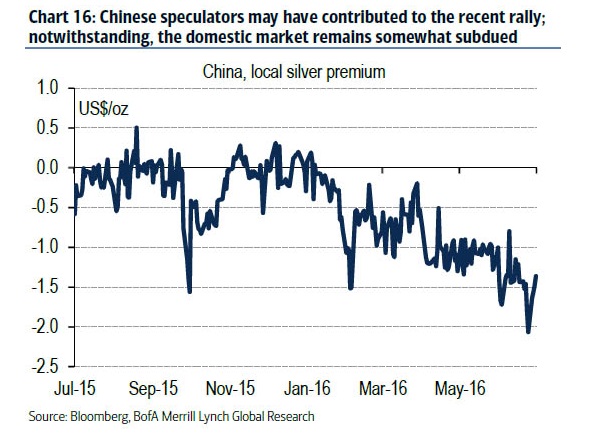
Having said that, we note that coin premia (an indicator for market tightness; Chart 15), but also prices in China have not rallied as much as international spot quotations (Chart 16).
China, local silver premium
This is an indication that the rally in the past few days, which was largely based on the paper market, may not necessarily have the underpinnings of physical buying.
Tags: Central Bank Gold Holdings,China,Eurozone,fixed,Global Economy,newslettersent,Precious Metals,Switzerland


