


Lance Roberts
My articles My offerMy siteAbout meMy videosMy books
Follow on:TwitterSeeking AlphaFacebookAmazon
🔎 At a Glance
- Is "Santa Claus" Still Coming?
- Fed's Soft Landing Narrative
- Portfolio Tactics For Next Week
- From Lance's Desk: What Inflation Alarmists Missed In Their Warnings
- Portfolio updates & sector strategy shifts
- Market stats, screens, and risk indicators
💬 Ask a Question
Have a question about the markets, your portfolio, or a topic you'd like us to cover in a future newsletter?
📩 Email: [email protected]
🐦 Follow & DM on X: @LanceRoberts
📰 Subscribe on Substack: @LanceRoberts
We read every message and may feature your question in next week’s issue!
🏛️ Market Brief - "Santa," Are You Still Coming?
Administrative Note: Next week, I will be traveling for the Christmas holiday, so I will only provide a brief market update. The full newsletter will return the following week.
The short answer appears to be "yes." However, it seems to be narrower, later, and more fragile than the headline mythology suggests. Importantly, the official "Santa Claus rally” window has not even started yet, as it is statistically measured as the last five trading days of the year plus the first two of January. Historically, that seven-session stretch has produced an average gain of about 1.3% and finishes positive “nearly 80% of the time,” according to data analysis from the long-running Stock Trader’s Almanac.
However, given the recent sloppy and weak trading in the market, it is unsurprising that investors are questioning whether "Santa Will Visit Broad & Wall" this year. So, don't give up hope just yet that investors' stockings will be filled with Christmas cheer. According to Goldman Sachs, absent anything actively bad, stocks seem to drift upward for a variety of reasons such as year-end window dressing, share buybacks, and performance chasing. However, a rosier 2026 economy, deregulation, AI, and the fundamental premise that corporate stories will improve are also tailwinds.
“Barring any major shocks, it will be hard to fight the overwhelmingly positive seasonal period we are entering and the cleaner positioning set-up,” Goldman's Gail Hafif
Currently, what matters is whether the market is positioned to enter the "Santa Rally" window with sufficient internal support to sustain a year-end bid. After a weak and volatile first half of December, price action improved as the week drew to a close, with both employment and inflation reports supporting further Fed rate-cutting policies. U.S. equities rebounded on renewed strength in mega-cap/AI leadership, following the UAE's commitment of $100 billion. According to the WSJ, OpenAI aims to raise as much as $100 billion from sovereign-wealth funds. Given that the UAE was a previous investor, it now has little choice other than to continue funding further commitments.
Furthermore, Reuters captured the tone shift succinctly: “we’re beginning to see some stabilization… for the Christmas year-end rally to resume,” noting that tech had been under pressure before the bounce.
However, “intact” does not mean “easy.”
First, breadth is not uniform, and conviction remains selective. Schwab described the market’s posture as “selective, rather than broad,” while noting roughly 56% of S&P 500 stocks were above their 50-day moving averages. That is a healthy level, but not the kind of participation that makes rallies durable without interruption.
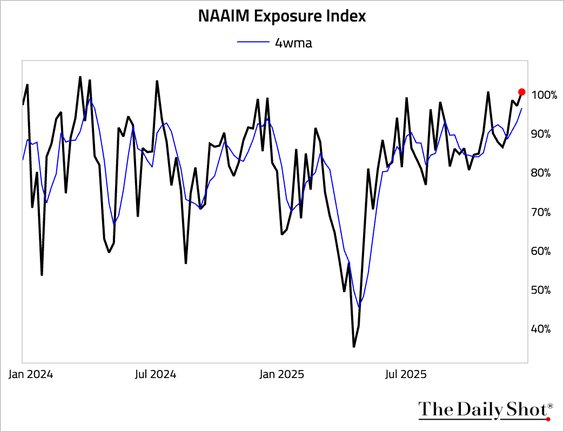
Secondly, sentiment is elevated, and positioning risk is creeping back in. As shown, the National Association of Investment Managers Index surged to levels that have usually preceded pullbacks. However, that does not negate Santa seasonality; it does, however, raise the odds that any rally could be short-lived in January.
Bottom line: The Santa Rally remains viable because the overall trend remains constructive and liquidity expectations are supportive. However, the market is also priced for good news. In such an environment, the rally likely depends on continued stabilization in leadership, contained yields, and no surprise shocks that force de-risking into thin holiday liquidity.
Which brings us to the market.
📈Technical Backdrop - Market Rallies As Expected
Following a 4-day "sell off" into mid-week, which broke both supports at the 20- and 50-day moving averages, investors mustered the courage to once again "buy the dip," reversing early-week losses and pushing the market to 6,835 on Friday. That recovery keeps the broader uptrend intact, but the market is now pressing directly into a zone where prior momentum stalled, making the next week critical for determining whether the year-end advance can extend.
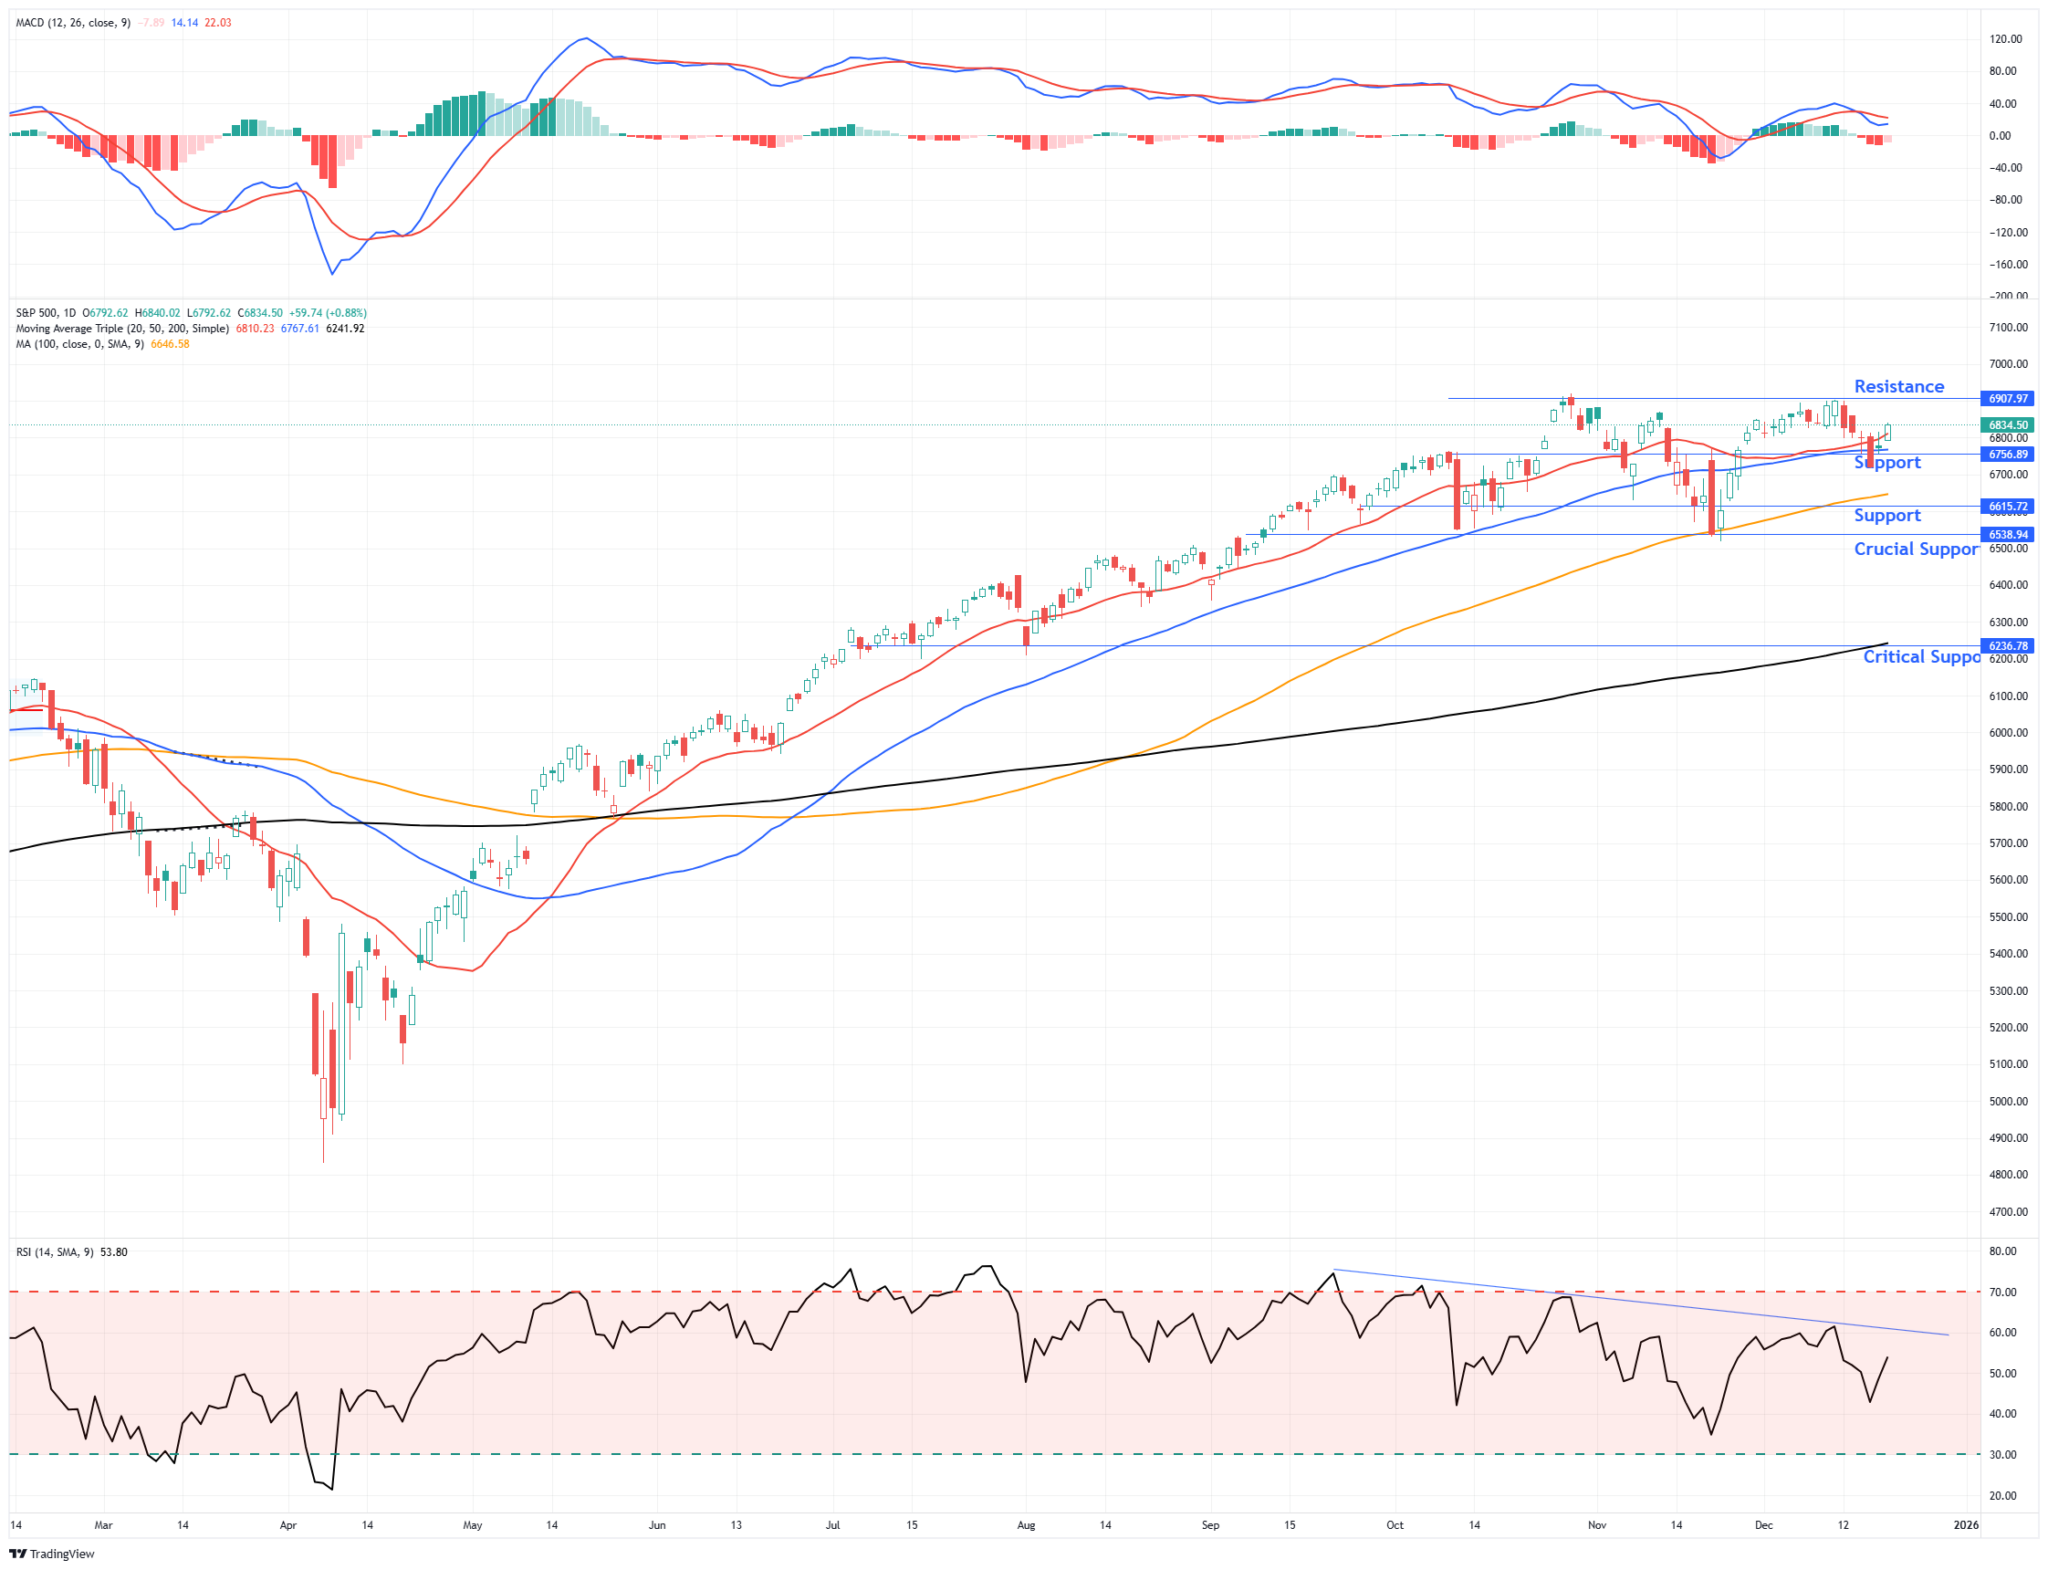
From a trend perspective, the index finished the week above its 20- and 50-day moving averages, confirming that sellers failed to regain control after the post-FOMC volatility. However, upside progress has repeatedly stalled at the 6,900 resistance level, which coincides with prior highs and the upper boundary of the near-term consolidation range. Until price can close decisively above that level, upside should be viewed as incremental rather than impulsive. Historically, failed breakouts near year-end often lead to short, sharp retracements rather than prolonged declines, particularly when liquidity thins into the holidays.
Momentum indicators are consistent with that interpretation. Relative strength has improved from the oversold conditions of early December, but is now approaching levels where rallies have stalled. Furthermore, the negative divergence of relative strength since September suggests an increasing fragility to market rallies. Notably, volatility has decreased, with the VIX falling back into the mid-teens, suggesting that complacency is returning. While low volatility often supports higher prices, it also leaves markets vulnerable to abrupt price declines if expectations are not met.
Key Support and Resistance Levels
| Level Type | Price Area | Technical Significance |
|---|---|---|
| Resistance | 6,900 | Previous highs and top of the consolidation range. |
| Resistance | 6,865 | Previous peak in early November during the corrective process. |
| Current Price | 6,835 | Friday close |
| Support | 6,767-6,810 | 20- to 50-day moving averages. |
| Support | 6,647 | 100-DMA / intermediate trend support |
| Support | 6,539 | November reaction low |
Looking into next week and the remainder of the year, support levels are clearly defined and relatively close to current prices. A pullback toward initial support would be technically normal and even constructive if buyers step in near the trend. Conversely, a failure to hold intermediate support would raise the risk that investors once again receive a "lump of coal" for Christmas.
In summary, the technical backdrop suggests that the market remains positioned for a year-end advance, provided bulls can defend near-term support and eventually reclaim the overhead resistance. Without a breakout, the most likely outcome is continued consolidation, accompanied by increased volatility, as investors adjust their positions ahead of year-end.
🔑 Key Catalysts Next Week
As the market enters the final week of regular trading before year-end, the calendar shifts from heavier macro releases to a mix of critical economic data, light earnings, and holiday-impacted sessions. With major U.S. stock exchanges remaining open through December 26 (including trading on December 24 with an early close and a full session on December 26), positioning will increasingly reflect seasonal flows as well as reactions to late-cycle indicators that can impact rate expectations and risk appetite. Markets continue to digest recent economic developments amid ongoing uncertainty about rates and inflation, meaning that even a limited slate of catalysts can trigger outsized reactions.
The economic docket for the week is anchored by key inflation and spending releases that feed directly into the Fed’s policy framework. The Core Personal Consumption Expenditures (PCE) Price Index, the Federal Reserve’s preferred inflation gauge, is scheduled for Monday and will be one of the most closely watched data points of the entire week, given its potential influence on expectations for 2026 monetary policy. Alongside that, personal spending and the broader PCE measure will provide insights into consumer demand at the close of 2025. Outside of macroeconomic activity, earnings are light due to the proximity of year-end; institutional and retail focus will likely shift toward any surprises in the few reported results, as well as guidance, with notable corporations historically scheduled earlier in the month having already reported.
In conclusion, while next week’s catalyst list is lighter than typical “earnings-heavy” periods, the scheduled economic releases, especially inflation measures, carry asymmetric risk for equities. Combined with compressed liquidity into the holidays, the market could exhibit heightened sensitivity to even modest deviations from expectations, guiding positioning into year-end and the "Santa Rally" window.

Need Help With Your Investing Strategy?
Are you looking for comprehensive financial, insurance, and estate planning services? Need a risk-managed portfolio management strategy to grow and protect your savings? Whatever your needs are, we are here to help.

💰 Fed's Soft Landing Talk Meets Hard Data
The Fed's soft landing narrative is a key theme in financial media, particularly on Wall Street, which expects a resurgence in economic activity in 2026 to justify increasing forward earnings expectations.
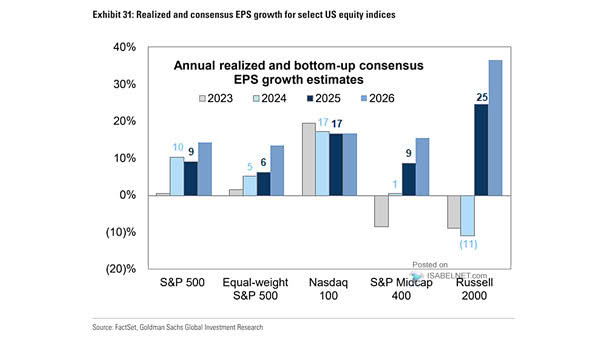
As shown, Wall Street currently expects the bottom 493 stocks to contribute more to earnings in 2026 than they have in the past 3 years. This is notable in that, over the past three years, the average growth rate for the bottom 493 stocks was less than 3%. Yet over the next 2 years, that earnings growth is expected to average above 11%.

Furthermore, the outlook is even more exuberant for the most economically sensitive stocks. Small and mid-cap companies struggled to produce earnings growth during the previous three years of robust economic growth, driven by monetary and fiscal stimulus. However, next year, even if the Fed's soft landing narrative is valid, they are expected to see a surge in earnings growth rates of nearly 60%.
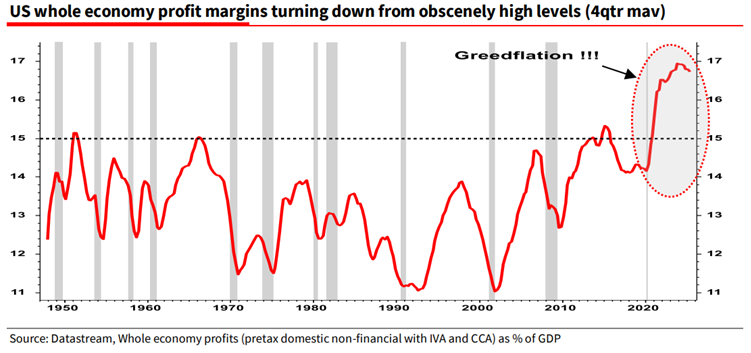
Notably, all this is occurring at a time when the entire economy's profit margins have peaked and may potentially be turning lower.
It should come as no surprise that there is a high correlation between economic growth and earnings, given that in a demand-driven economy, consumption is what generates revenues, and revenues ultimately develop earnings.
"A better way to visualize this data is to look at the correlation between the annual change in earnings growth and inflation-adjusted GDP. There are periods when earnings deviate from underlying economic activity. However, those periods are due to pre- or post-recession earnings fluctuations. Currently, economic and earnings growth are very close to the long-term correlation."

The problem currently facing the Fed's soft landing narrative is that it hopes the economy can slow without a recession, allowing inflation to return to its target. For now, investors have held the markets higher, hoping the Fed's soft landing narrative comes to fruition, which would lead to a surge in economic activity. However, the latest employment, retail sales, and inflation trends suggest a potentially worse outcome, characterized by weakening demand and shaky consumer strength.
Those factors weaken the case for the Fed's hopes of a soft landing and suggest an increase in market fragility.
Falling Inflation Tells a Demand Story
Let's start with inflation. If economic growth were on the cusp of resurgence, expectations for inflation would be rising. However, as shown, those expectations never rose with "printed inflation," because it was the "transitory effect" of massive monetary stimulus. The bond market's view was that inflation would revert to its normalized levels as that monetary excess left the system, which has been the case. This is particularly notable, as inflation expectations have always been more accurate than the "inflation" bears we discussed yesterday.

In the Fed's narrative of a soft landing, the trend in inflation expectations is crucial. Here is an essential point:
"The Federal Reserve WANTS inflation."
Here is another critical point: So do you.
Without inflation, there can not be economic growth, increasing wages, and an improving standard of living. In other words, prices must always rise over time, which is why the Fed targets a 2% inflation rate, thereby supporting 2% economic growth. What we don't want is "disinflation" or "deflation," which would occur in conjunction with a recession, leading to job losses, falling wages, and reduced prosperity overall. As shown in the chart below, there is a high correlation between inflation, economic growth, and interest rates over time.

When inflation eases because demand weakens, the economy slows, producers lower prices to clear unsold goods, and employers become more restrictive in hiring and wage increases. Services that rely on discretionary spending lose pricing power, and banks become more stringent in their lending practices. These are not signs of a healthy expansion, but rather reflect a decline in spending power among households.
The Fed's soft landing narrative is predicated on the hope that it can achieve its 2% inflation target without causing a more widespread slowdown. Historically, the Fed has failed in such attempts, as shown by the relationship between Fed rate-cutting cycles and economic and financial consequences.

As an investor, you need to distinguish between inflation caused by temporary supply/demand shocks, as we saw following the Pandemic, and inflation caused by organic economic activity. Supply/demand imbalances, such as higher input costs or a lack of supply caused by a geopolitical shock, can create a spike in inflation, which resolves itself when the shock is over. However, inflation caused by organic demand provides insight into the strength or weakness of the economy. Currently, we are focused on potential demand erosion as consumers cut back, employment weakens, and wages decline.
The retail sector provides early signals of demand weakness. Housing-related spending, auto sales, and discretionary purchases show stress, and many consumers face higher borrowing costs and lower savings. As shown, PCE, which accounts for nearly 70% of the GDP calculation, slowing inflation rates, and weak retail sales growth, all suggest that demand destruction is present in the economy. Such a development may further weigh on the Fed's narrative of a soft landing.

As noted, the Fed's soft landing narrative requires demand to slow moderately while avoiding recession. However, falling inflation driven by weakening demand and sluggish employment growth suggests a more profound weakness.
Retail Sales Growth Is Not What It Appears
Headline retail sales reports often show month-over-month increases, which reporters interpret as evidence of resilient consumer strength. However, a look at the data tells a different story. For example, since 2022, real retail sales growth has effectively not grown. In fact, previous periods of flat retail sales growth were pre-recessionary warnings.

Secondly, the annual rate of change in real retail sales is at levels that have typically preceded weaker economic environments and recessions.

Notably, retail sales figures are subject to seasonal adjustments, which correct for typical spending patterns. During the holiday and back-to-school seasons, spending increases and the "adjustments" attempt to remove these effects. However, if the adjustment process overestimates normal seasonal strength, the adjusted result will appear firmer than it actually is. Secondly, another distortion comes from changes in price levels. If prices fall because demand weakens, nominal sales may rise while real volumes fall. Consumers buy less but pay lower prices. Nominal retail sales can mislead when viewed without context.
This is what we are currently seeing in the economy. As consumers pull back, businesses face the prospect of weaker revenue. That leads to slower hiring, lower investment, and falling confidence.
This matters for the Fed's view of a soft landing. If consumer demand remains weak, the economy may slow more than expected, which increases the risk of recession. A "soft landing" requires growth to slow without tipping over, but current economic data points suggest a risk to that growth story.
The Market Risk If The Fed Is Wrong
If the Fed's soft landing narrative proves incorrect, the downside risk to investors increases significantly. The soft landing narrative has been factored into market prices, earnings expectations, and economic projections. Any deviation exposes valuations and portfolios to sharp repricing. With valuations already very elevated, the risk of a repricing event is not insignificant.
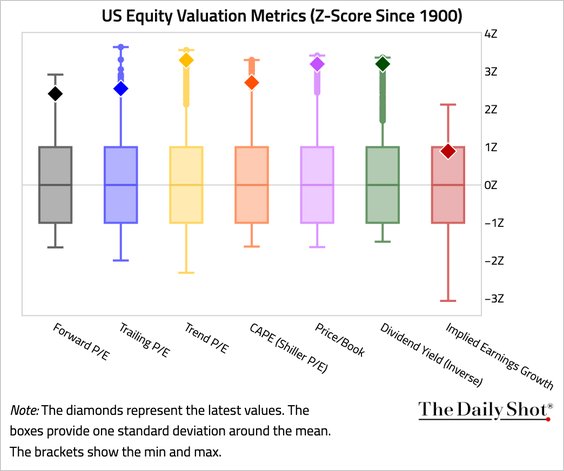
Wall Street’s forward expectations hinge on a growth rebound in 2026. Those projections assume that demand will return and margins will remain stable. However, there is no guarantee that either of those assumptions are accurate. If margins have already peaked, inflation declines as demand erodes, and employment falls, negative earnings revisions could be substantial. The year-over-year change in real retail sales, as shown in the chart, has hovered near recessionary warning levels. With consumers already strained by high debt service costs, weak wage growth, and declining savings, discretionary spending is under pressure, which directly affects earnings across cyclical sectors.
If demand weakens further, companies will face lower revenue and tighter margins. The margin compression will initially impact earnings, particularly for smaller firms with limited pricing power. A repricing of earnings expectations will follow, dragging valuations with it.
The Fed's historical track record of avoiding recession during tightening and easing cycles is poor. Most rate-cutting cycles have been in response to financial or economic stress, not smooth slowdowns. If the Fed cuts rates next year, it likely won’t be in response to a soft landing. That shift in narrative would catch most investors leaning the wrong way.
Positioning for a soft landing assumes the Fed can control inflation without breaking demand. The data say otherwise. The risk, as always, is that the market wakes up to this reality too late. Therefore, investors should consider preparing for such a possibility in advance.
📒 Year-End Portfolio Tactics
If the Fed's soft landing narrative fails, investors will face a different environment than the one markets currently price. The assumptions behind strong equity valuations, tight credit spreads, and risk-on positioning will crack. If it does, that means you will need to act based on risk, not rhetoric. Here are some actions to consider.
1. Reduce Exposure to Overvalued Growth Assets: Tech and growth stocks led the rally on rate cut hopes and soft landing optimism. If earnings disappoint and rates stay higher, these valuations come under pressure.
- Trim overweight positions in mega-cap tech.
- Avoid speculative names with no earnings.
- Focus on companies with strong cash flow and pricing power.
2. Increase Cash and Short-Term Treasuries: If growth slows and volatility returns, capital preservation matters. Cash gives you optionality. Short-term Treasuries offer yield without duration risk.
- Rebalance toward 3-month to 1-year Treasury bills.
- Hold cash equivalents yielding over 4.5 percent.
- Avoid reaching for yield in low-quality credit.
3. Tilt Toward Defensive Sectors: Slower growth hits cyclicals and high beta sectors first. Defensive sectors hold up better in downturns.
- Favor healthcare, consumer staples, and utilities.
- Limit exposure to discretionary, financial, and industrial sectors.
- Screen for dividend sustainability and balance sheet strength.
4. Prepare for Credit Stress: If recession risk rises, corporate credit spreads will widen. Junk bonds will suffer. Bank lending tightens further.
- Exit high-yield bonds and floating-rate loans.
- Review credit exposure in bond funds.
- Consider higher-quality fixed income with lower default risk.
5. Be Patient and Opportunistic: If markets break, forced selling creates dislocations. You want dry powder ready.
- Hold 10–20 percent in cash or equivalents.
- Build watchlists of high-quality names at lower valuations.
- Add in stages as prices adjust, not all at once.
You don’t need to predict a recession. Instead, prepare for the potential risk if the Fed's hopes for a soft landing fade. You can always increase risk more easily than recovering from losses. Remaining disciplined, protecting capital, and looking for opportunities is always the best course of action.
Trade accordingly.
🖊️ From Lance’s Desk
This week's #MacroView blog examines what the inflation-alarmists have missed in their continued warnings of a return to 1970s-style inflation.
Also Posted This Week:
- QE Is Back: Which Assets Benefit From The Liquidity Boost - by Michael Lebowitz
- Bull Market Genius Is A Dangerous Thing - by Lance Roberts
📹 Watch & Listen
The recent selloff early in the week tested the market's support. Will investors "buy the dip" again?
Subscribe To Our YouTube Channel To Get Notified Of All Our Videos
📊 Market Statistics & Analysis
Weekly technical overview across key sectors, risk indicators, and market internals

💸 Market & Sector X-Ray: Pullback To Support
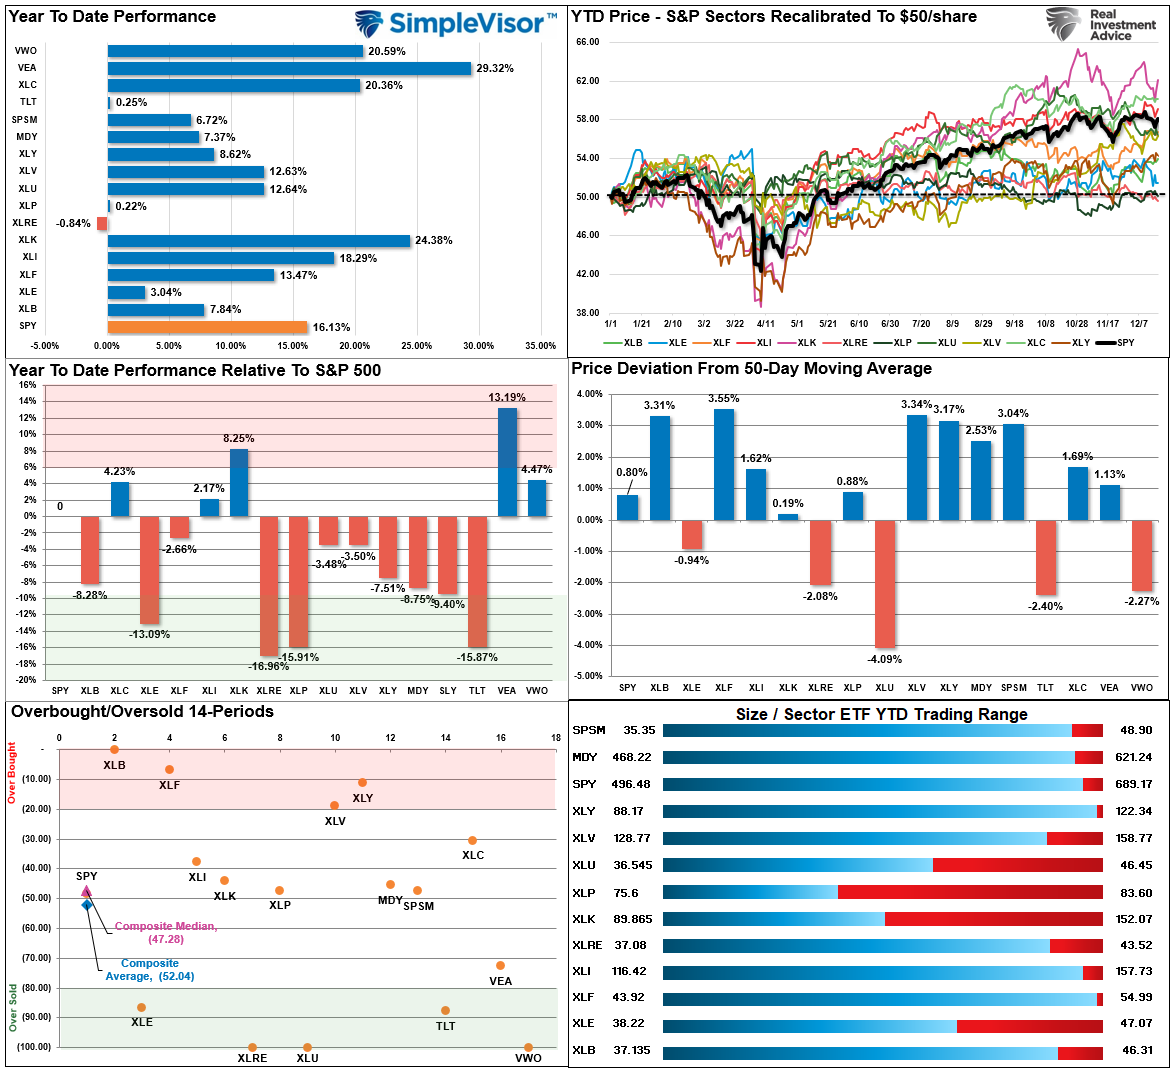
Last week, we noted that "we saw a significant portion of a rotation starting last week, with participation broadening across the overall market, pushing Materials, Financials, Staples, and Discretionary into overbought territory." That rotation continued this week, but we also saw a return to Technology late in the week. Utilities, Bonds, Emerging Markets, Energy, and Real Estate remain oversold and could see some year-end buying as rebalancing continues.
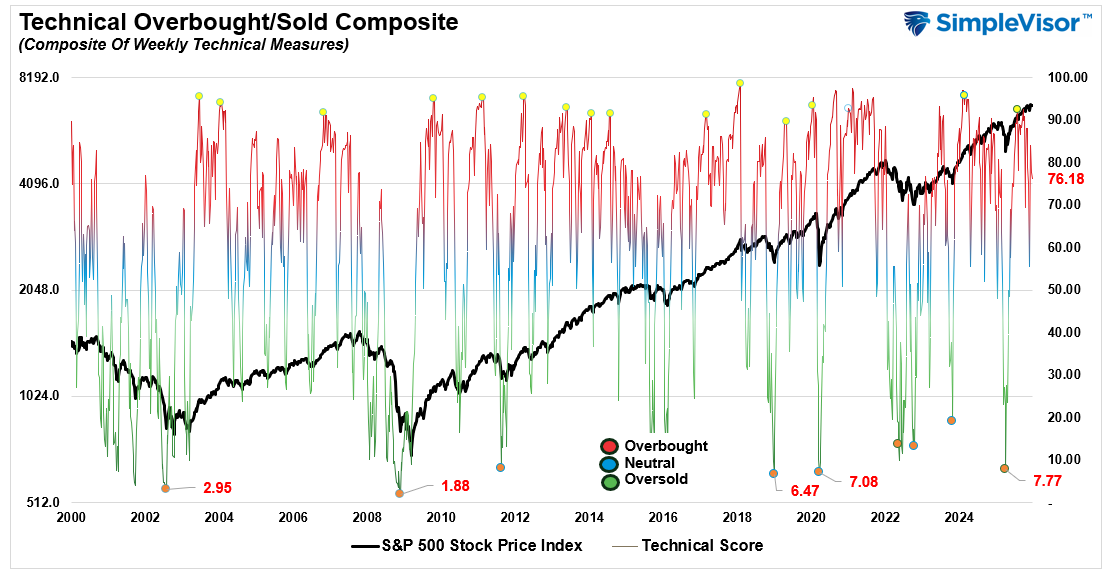
📐 Technical Composite: 76.18 – Conditions Weaken Slightly
The overall technical condition remains bullish, but has weakened slightly over the last month. After hitting more extreme overbought conditions heading into October, the market has continued to consolidate, working off some of that state. While not bearish, some further weakness early next week would be unsurprising, providing a better entry point for a year-end rally.
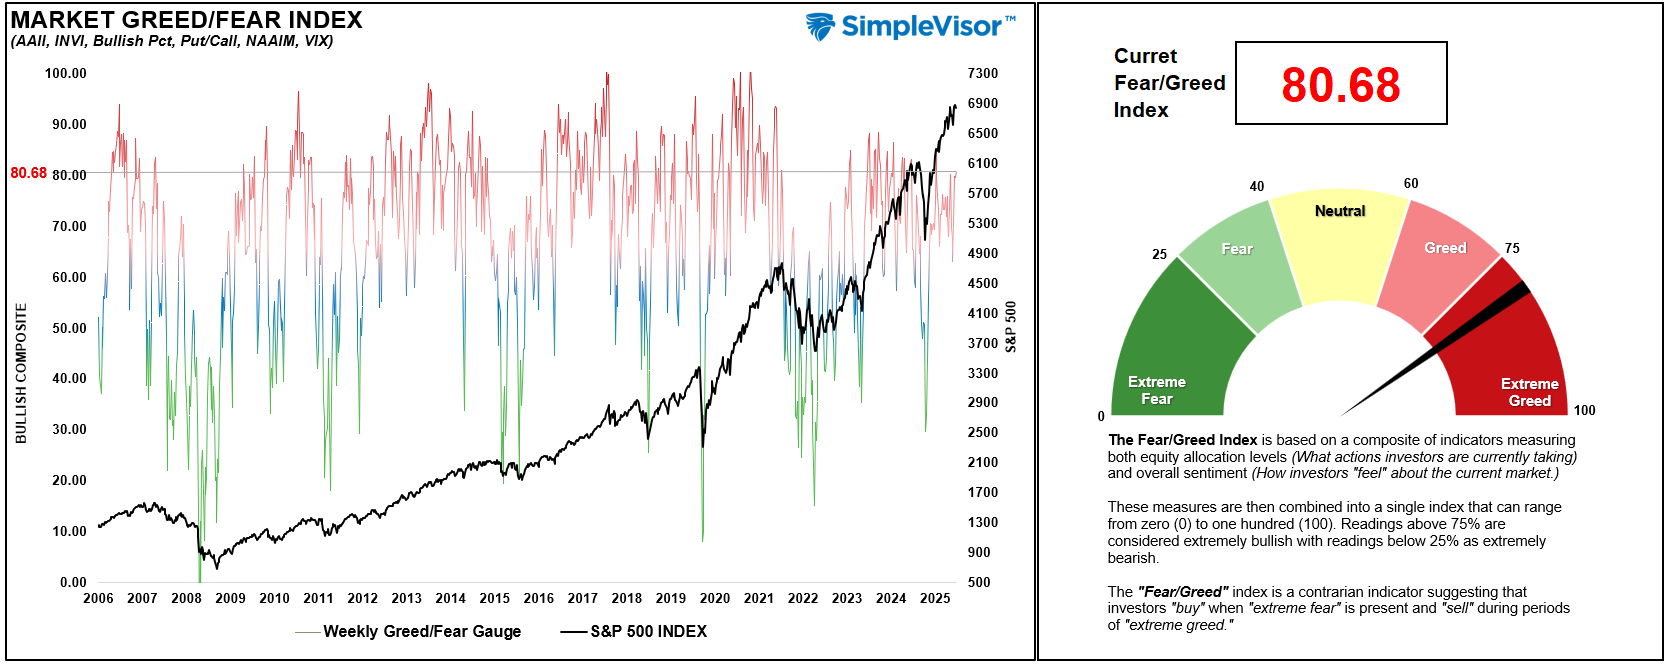
🤑 Fear/Greed Index: 80.68 – Extreme Greed Returns As "Santa Comes To Town"
Positioning in equities continued to push higher this week as the market rallied into the end of the week. Despite the recent correction, investors remain very bullish with allocations to equities at very elevated levels. Some consolidation or weakness heading into the Christmas break this next week would be unsurprising, but not necessary.
🔁 Relative Sector Performance
Last week, we noted that technology performance started to improve. That improvement continued into Friday, pushing Technology back to more neutral levels. However, Utilities and Real Estate are very oversold and could see a bid early next year if a risk-off rotation occurs.

📊 Most Oversold Sector Holdings
After a strong rally earlier in the year, Utilities have gone through a decent correction. DUK, AEP, and CEG remain very interesting, but opportunistically speaking, some value is emerging in the sector.

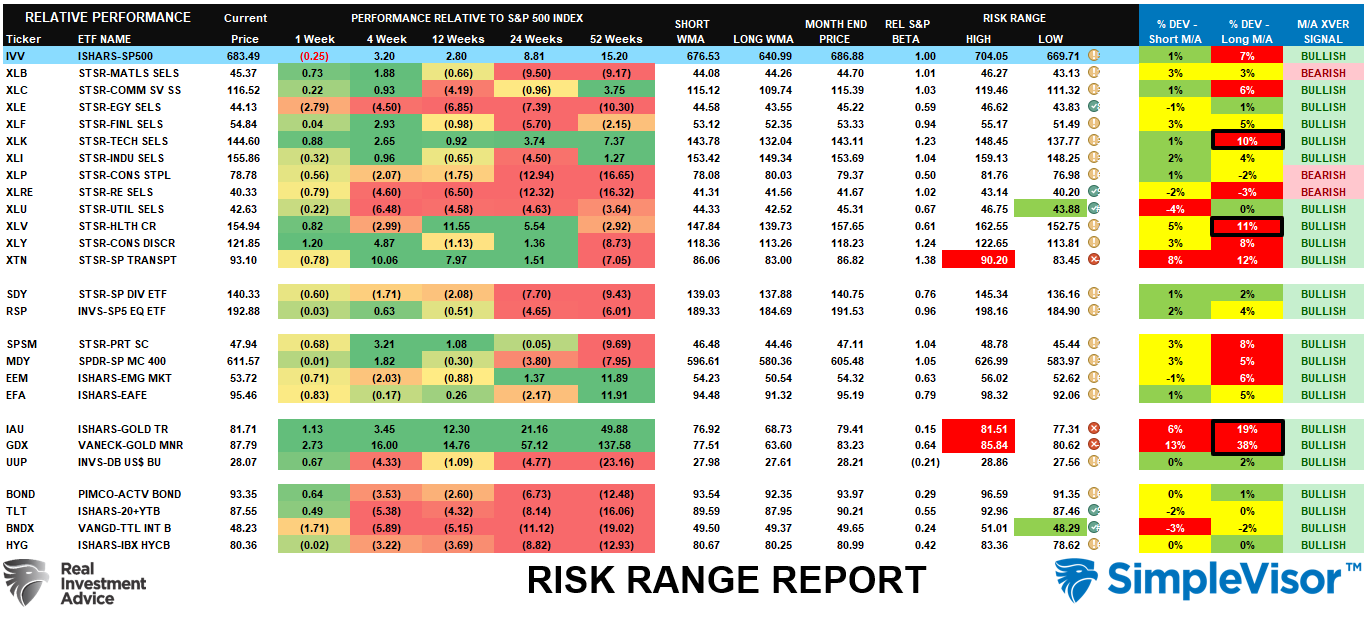
📊 Sector Model & Risk Ranges
We noted last week that while the market remains overall bullish, there has been some deterioration as "...previously, there was only ONE sector on a 'bearish' signal....but over the last three weeks, the number of bearish signals has increased from ONE to THREE." This isn't a "sell signal," but certainly something to continue monitoring. Nonetheless, the overall bullish rally continues, and Healthcare, Technology, Gold, and Gold Miners are the sectors that have deviated the most from their long-term means. While this is bullish in the near term, it is worth noting that those deviations will eventually reverse, so risk controls remain essential.
Have a great week.
Lance Roberts, CIO, RIA Advisors
The post Fed’s Soft Landing Narrative Meets Economic Data appeared first on RIA.
Full story here Are you the author?Tags: Featured,newsletter


