| Gross Domestic Product was revised slightly higher for Q4 2016, which is to say it wasn’t meaningfully different. At 2.05842%, real GDP projects output growing for one quarter close to its projected potential, a less than desirable result. It is fashionable of late to discuss 2% or 2.1% as if these are good numbers consistent with a healthy economy. This level of advance, however, factors none of the imbalances and drags still unresolved from the huge dislocation in output during the Great “Recession.” The economy simply fell down and never got back up.
Policymakers would have us forget about that first part so as to concentrate on the plus signs – at least GDP suggests a positive growth rate overall. But even here the results are disastrous, for it used to be economic potential including recessions was in the long run at least a half of a percent more, if not a full percent. Over time that difference is enormous owing to compounding, the true economic cost, meaning the economy is so far below capacity without even accounting for its shrinking nine years ago. |
GDP Corp Profits After Tax, Jan 2010 - 2017 |
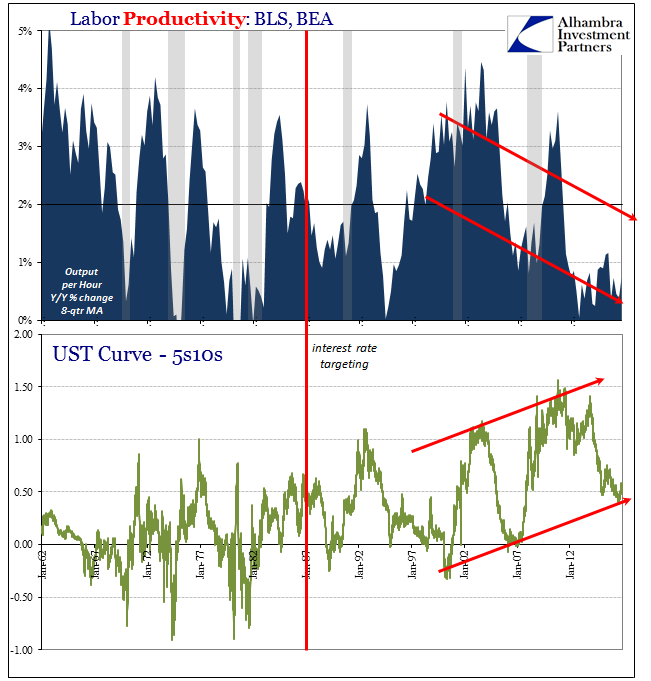
| Having been forced to accept this reality, the race is now on to figure out why. Economists handicapped by their blindness this last decade have put forth only absurdities in that effort. Whether the “skills mismatch” of retired Baby Boomers and heroin addicts or the mere mention of productivity (without specifying a cause for low productivity), there are no good answers being offered in the mainstream for this lowly, dangerous state.
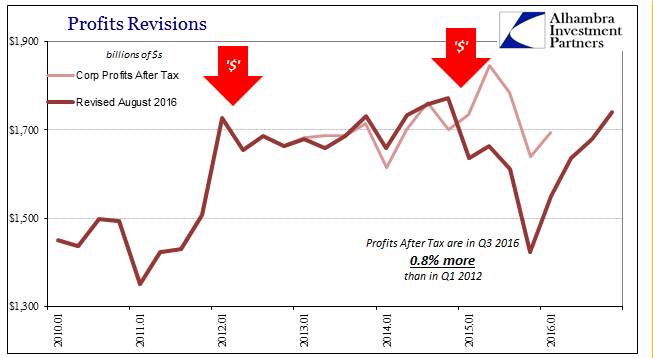
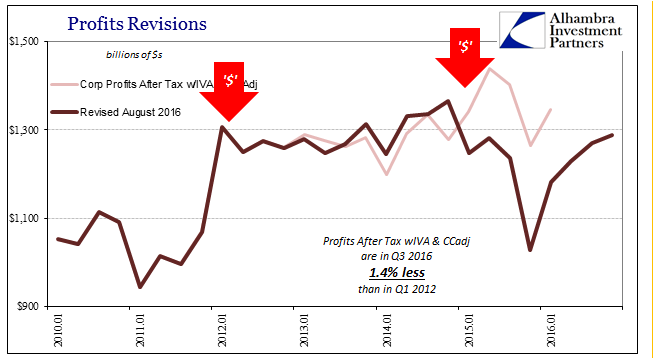
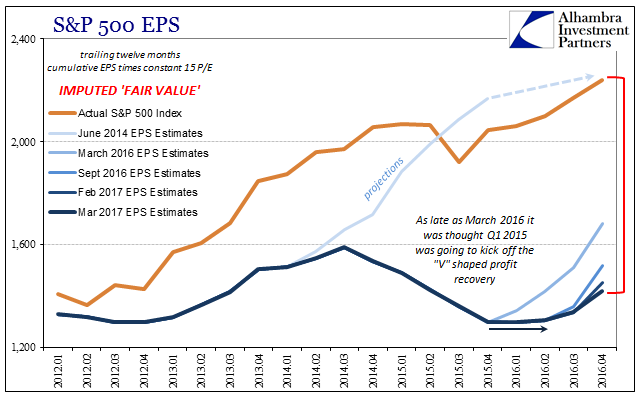
The GDP accounts, however, provide a good deal of them anyway. Concurrent with the regular revision to quarterly GDP, the BEA also released its estimates for corporate profits. The trajectory of profits over the past few years is already familiar to stock investors paying closer attention to EPS. In year-over-year terms, Q4 seemed to be a relatively good bounce-back from the depths of late 2015. By comparing to what has been so far the bottom of the “rising dollar” period, the growth rate in the latest quarter starts out seemingly in impressive fashion. |
GDP Corp Profits After Tax, Jan 2010 - 2017 |
| Corporate Profits After Tax were up 22%, while those with IVA and CCAdj increased by 25%. Those numbers, however, obscure the depths of the declines last year and the year before. In Q4 2015, Profits After Tax were down almost 20% from Q4 2014, which means that profits in the current quarter are actually less than in the same quarter two years ago, and aren’t appreciably greater than five years ago. |
S&P 500 EPS, Jan 2012 - Apr 2016 |
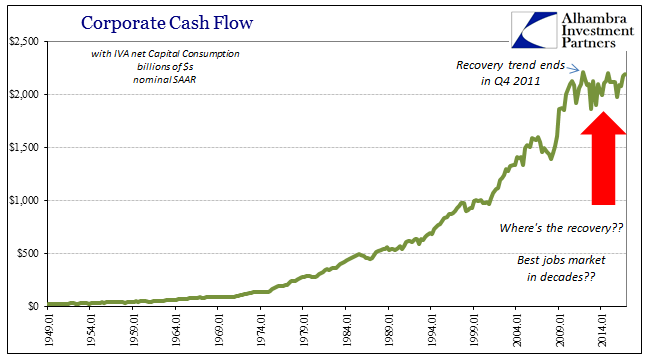
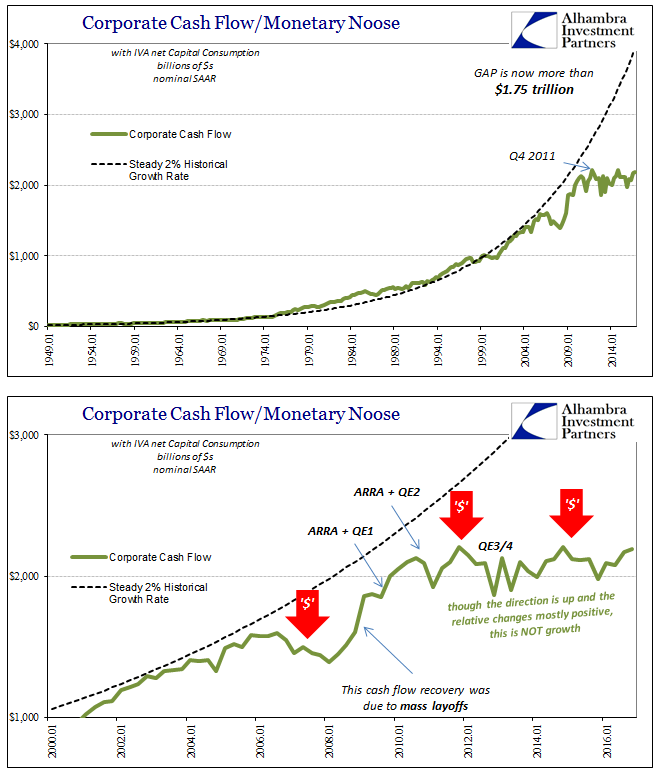
| These particularly data points are actually the most charitable views of the corporate sector. In terms of Profits from Current Production or Cash Flow, the situation is even less fruitful. Cash flow in particular is by this estimate still stagnant for a fifth complete year. The BEA estimates that corporate cash flow was just less than $2.2 trillion in Q4 2016, up almost 11% from Q4 2015, but still less than the $2.21 trillion from Q4 2011. |
GDP Corporate Profits Cash Flow, Jan 1949 - 2014 |
| The cause of that standstill cannot be Baby Boomer retirement, for all retirees though they may no longer work or be counted in the labor force are still going to eat, shop, and engage in commercial activities. Similarly, heroin addicts are going to do the same, though some of their spending would clearly be in the illicit black market outside of these statistics (a relatively small amount in the aggregate).
What the cash flow and profit series tell us is that Economists once again have it backward. The opioid epidemic is far more likely an effect of this depression economy that one of its causes. If businesses are forced to utilize so much less labor, it is because there is no cash nor expectation for growth in profit by which to put more of it to productive use. |
GDP Corporate Profits Cash Flow Baseline, Jan 2000 - 2017 |
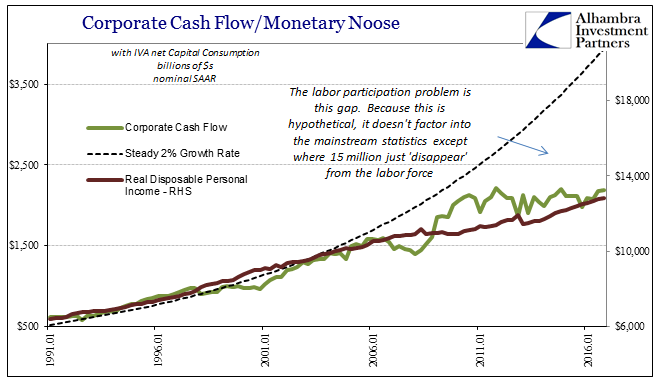
| The link between the fortunes of business and the fortunes of labor are easily established by both history as well as common sense. On any rational basis, we would expect to find ongoing difficulties in the latter where there is only chronic trouble in the former. Sure enough: |
GDP Corporate Profits Cash Flow Real DPI, Jan 1991 - 2016 |
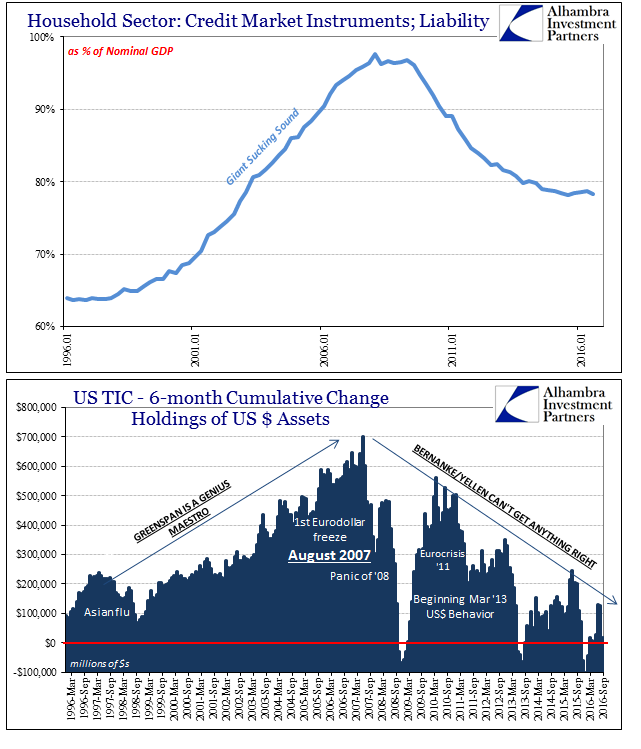
| The problem with corporate profits and cash flow actually predates the Great “Recession”, and so does the at first minor downward shift in labor and incomes. In the early part of the 2000’s, there was at least some major offset to the start of reduced labor participation and income growth in the form of debt, particularly consumer debt from mortgage equity extraction. |
Initial Claims Household Credit as GDP TIC, Mar 1996 - Sep 2016 |
| Take away the eurodollars which takes away the consumer debt leaving businesses stuck without the marginal cash flow or profit growth (as well as other related effects upon global and domestic trade). It is vicious cycle that has nothing much to do with drug abuse except as the worst kinds of symptoms of the wrong side of eurodollar function that no central bank in its current format will be able to fix.
The problem is the erosion of the national basis for income, the jobs that the Trump administration has correctly focused upon in at least its economic rhetoric. The means to correct the deficiency so far proposed, however, will in all likelihood do little or nothing toward alleviating it. For as much as the Federal Reserve in 2017 will claim that this is now a purely fiscal problem, it is instead still a monetary one just as it has been all along. When one considers such a predicament, liquidity preferences from inside the corporate sector are legitimate, including, as painful in the long run as they are for the economy, stock repurchases – the very vise by which productivity squeezes out potential. There is value to the GDP statistics, but as usual not in the way in which they are commonly presented. In keeping with this week’s semi-theme about auditing the Fed, again we find no need to do so. All the required evidence is openly available and quite satisfactorily voluminous so as to arrest the Fed’s sudden drug problem; we merely lack someone with the will and courage to use it already. |
Decomposition UST Curves Productivity |
Tags: corporate cash flow,corporate profits,currencies,depression,economy,Federal Reserve/Monetary Policy,GDP,Labor,liquidity preferences,Markets,newslettersent,retirement income,U.S. Disposable Personal Income


