


Volume profiling provides unique insight into the profit-and-loss position of recent investors by identifying price levels at which significant buying and selling have occurred. Areas of high volume can act as powerful support and resistance levels because they represent prices at which a large number of investors have established positions and are therefore likely to defend those positions or exit them if prices return to those levels. Equally important are the low-volume price ranges where little trading occurred. These areas have the potential to create price gaps, where prices can move quickly with little friction.
In the graph below, the red line, aka the POC (Point of Control), indicates the price level with the most volume within the visible price range. The gold and blue colors indicate whether the volume was up/down (blue for up volume and gold for down volume). The color coding helps better understand whether the buyer or the seller initiated the transaction. The darker bars represent 30% of the volume since the April Liberation Day lows.
The current volume profile analysis highlights that many investors are trapped in the market with losses. We suspect the market will encounter resistance all the way up to new highs as these investors, who are losing money, seek to exit their trades at no profit or with a slight gain or loss. Below 630, the volume starts to thin out. This means there are not many buyers willing to add to their positions to provide support. Said differently, it could be a slippery slope lower if new buyers are shy.
What To Watch Today
Earnings

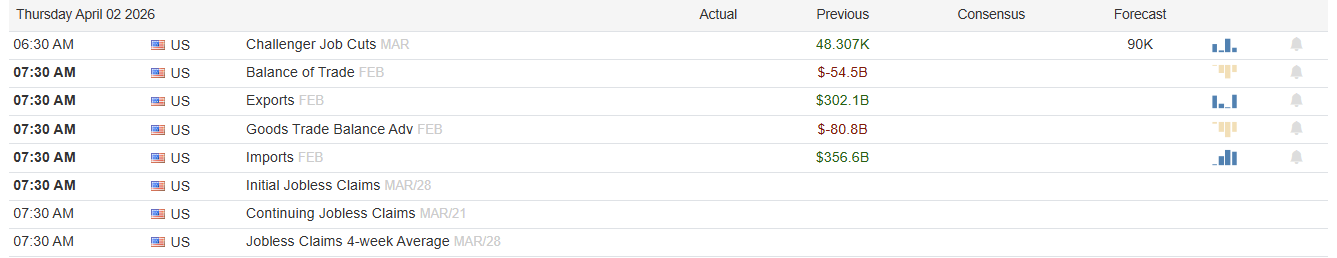
Economy
Market Trading Update
Yesterday, we discussed the stats for April, which tends to produce better returns over time. The big question now is whether we are approaching a bottom in the market or if this corrective process has further to go. For that, we will turn to both cash flows and market breadth. As shown, the Money Flow Breadth Ratio (MFBR) is a rules-based market timing indicator that measures the persistence of institutional buying and selling pressure in the S&P 500. It works by tracking weekly net dollar money flow, calculated as SPY volume multiplied by the weekly price change, and counting how many of the last 20 weeks showed positive (buying) flow. That count divided by 20 produces a ratio between 0% and 100%. Readings above 60% signal sustained buying pressure (BUY), readings below 40% signal sustained selling pressure (SELL), and everything in between is NEUTRAL. The model goes a step further by incorporating the direction of the MFBR, whether it is rising or falling, because a 25-year backtest from 2000 to 2025 demonstrated that trajectory matters as much as level, particularly in transition zones.
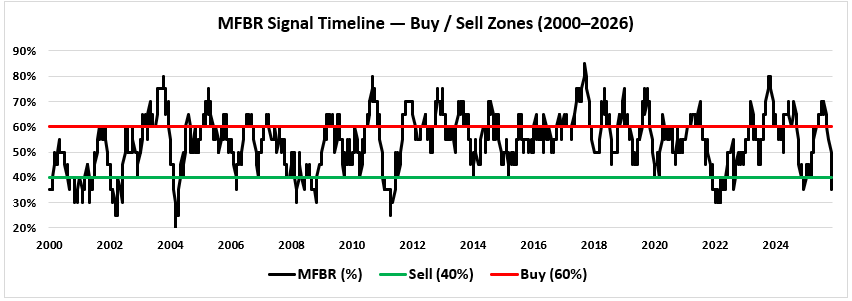
As of the most recent weekly reading, the MFBR stands at 35% and falling, placing it in the 35–40% zone, which is the single worst sub-range within SELL territory. A 25-year backtest covering 1,351 weekly observations from January 2000 through March 2025 reveals just how unfavorable this zone has been historically.
Across all 110 weeks in which the MFBR was below 40%, the average forward return was +0.3% at one month, -0.1% at three months, and +1.8% at six months, well below the all-period baseline of +0.6%, +1.8%, and +3.7% over those same horizons. Win rates tell an even starker story: only 53.2% of SELL periods saw positive returns at one month and just 46.8% at six months, compared to the baseline win rate of 69.5% at six months.

Drilling into the current 35–40% zone specifically (73 of the 110 SELL observations), the picture deteriorates further. Average returns were negative at one month (-1.1%), three months (-1.2%), and six months (-0.3%), only turning marginally positive at nine months (+2.0%) and twelve months (+3.6%). The six-month win rate was just 34.7%, meaning the market was lower six months later nearly two out of every three times. Even at twelve months, the win rate was only 58.6%, well below the 75.7% baseline.
However, the data also reveals a critical distinction within the SELL territory. When the MFBR dropped below 30%, a true washout (8 observations), the results flipped dramatically: average returns of +5.1% at one month, +4.9% at three months, +7.8% at six months, and +16.1% at twelve months, with a 100% win rate at three, nine, and twelve months. The current 35% reading has not yet reached that contrarian extreme.
The range of outcomes following SELL signals is wide, from a best-case of +66.6% to a worst-case of -29.1% over 12 months, underscoring why the model recommends maximum defensiveness at current levels. Until the MFBR stabilizes and clears back above 50% on a sustained basis, the message is clear: patience over aggression, capital preservation over return-chasing.

Nike: Good Earnings But Bad Guidance
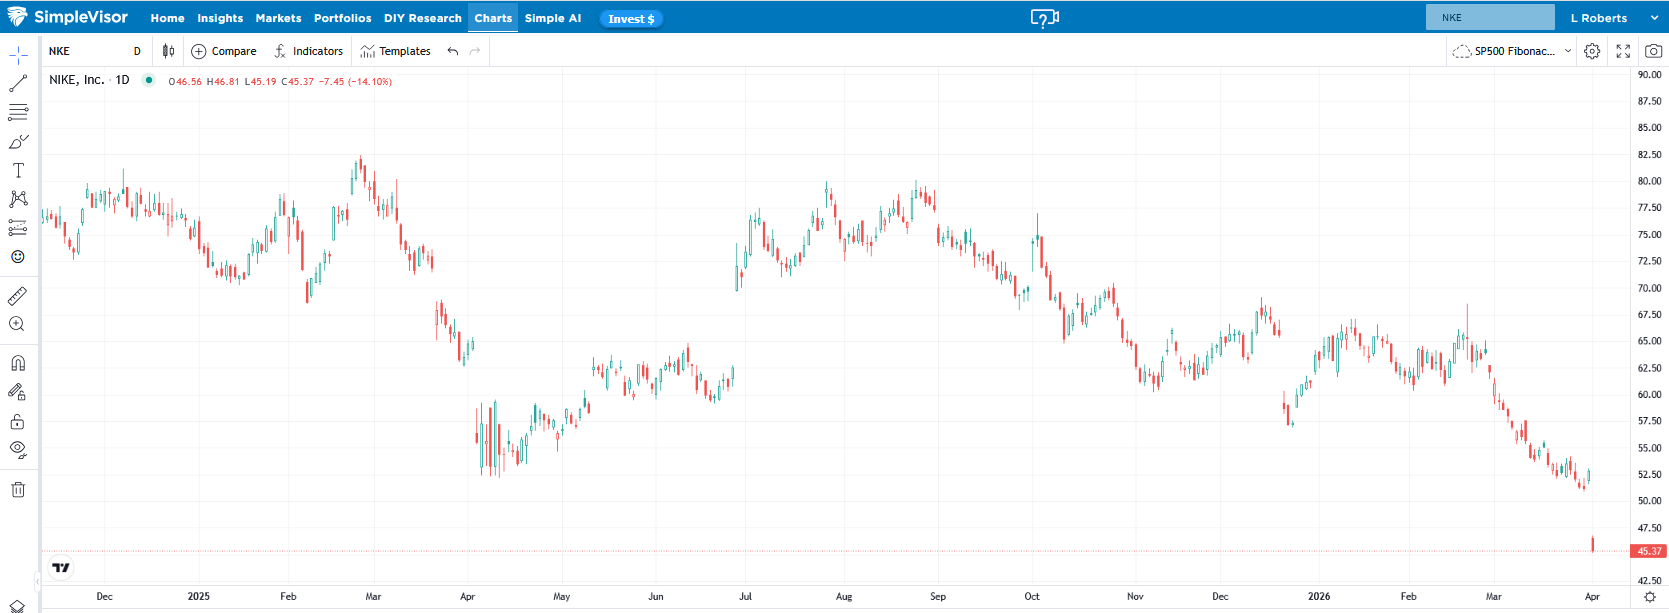
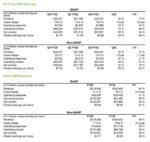
As we share below, Nike (NKE) had a better-than-expected quarter. However, as shown in the graph, Nike shares are down 14% and at their lowest levels in over ten years.
- Revenues: $11.28B (est. $11.24B)
- EPS: $0.35 (est. $0.31)
- Gross Margin: 40.2% (est. 39.8%)
A weak forward outlook is the impetus for the sharp decline. Nike's CFO Matt Friend expects fourth-quarter sales to decline 2–4%, well below Wall Street's estimate of a 2.0% increase. Moreover, he cautioned that a 20% decline is expected in its key market in China. He also discussed geopolitical uncertainty and higher oil prices as potential headwinds to both input costs and consumer demand. The weaker-than-expected guidance raises new concerns about management's ability to improve the company's fortunes.
Beta: A Powerful But Faulty Tool For Managing Risk
When investors want to reduce risk, one commonly used tool is beta. For instance, an investor may sell higher-beta stocks and replace them with lower-beta ones to cushion against an expected market decline. Such a strategy is intuitive and widely used; however, it can be greatly flawed.
We recently received a question from a client about how we use beta to manage our portfolios. Given recent volatility and declining prices, the timing could not be better to explore both the power of beta and its important constraints.
What is beta? Read More...

Tweet of the Day

“Want to achieve better long-term success in managing your portfolio? Here are our 15-trading rules for managing market risks.”
Please subscribe to the daily commentary to receive these updates every morning before the opening bell.
If you found this blog useful, please send it to someone else, share it on social media, or contact us to set up a meeting.
The post Volume Profiles: Eyeing Resistance From Trapped Longs? appeared first on RIA.
Full story here Are you the author?You Might Also Like
2026-03-02
A specter is haunting Wall Street—the specter of the “SaaSpocalypse.” Since the iShares Expanded Tech-Software Sector ETF (IGV) peaked on September 19, 2025, it has fallen roughly 30%. For context, the broad technology indexes like XLK and QQQ are essentially flat over the same period, and the semiconductor ETF (SMH) is up 30%. Between mid-January …
 Nvidia Delivers Perfection But Market Has Concerns
2026-02-27
Yet again, Nvidia delivers another incredible earnings report, reinforcing that the AI investment boom continues. As we show below, they posted annual revenue growth of of 73%, handily beating Wall Street forecasts. Most importantly, strong earnings and robust forward guidance confirm that their customers continue to aggressively expand AI infrastructure. Nvidia delivers the critical computing …
2026-02-20
Money – everybody wants it, but few actually have it. As shown in recent financial statistics, the “wealth gap” in America continues to grow between the “haves” and the “have-nots.” That gap has led to a bombardment of narratives explaining why younger generations are financially oppressed. As shown, the top 10% of income earners own …
 2026 Earnings Outlook: Another Year Of Optimism
2026-01-12
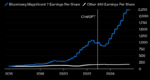
The Wall Street consensus forecast for 2026 earnings growth is strong by historical standards. Analysts are giddy and projecting another year of double-digit growth in S&P 500 earnings per share (EPS). FactSet’s most recent data showed an expected 2026 earnings growth rate for the S&P 500 of about 15 percent. That is well above the …
 Minerals, Russia, China & Iran: More On Venezuela
2026-01-07
Yesterday’s Commentary discussed the potential impact of regime change in Venezuela on the energy sector. Today, we extend the analysis and examine other reasons for the invasion. The following theories are based on a Substack commentary from Tracy Shucart, an economist and resources trader. For starters, Tracy makes it clear that oil is not the …
Tags: Featured,newsletter


