Lance Roberts
My articles My offerMy siteAbout meMy videosMy books
Follow on:TwitterSeeking AlphaFacebookAmazon
🔎 At a Glance
- Oppenheimer: The Risk Calculus Has Changed
- Market Brief & Technical Review
- From Lance's Desk: USD Stable Coins And The Rebasement Of The US Dollar
- Market stats, screens, and risk indicators
Give Us A Review *****
If you enjoy our work each week, could you be so kind as to leave us a review? It would be most appreciated.
🏛️ Market Brief - Markets Navigate Military Conflict
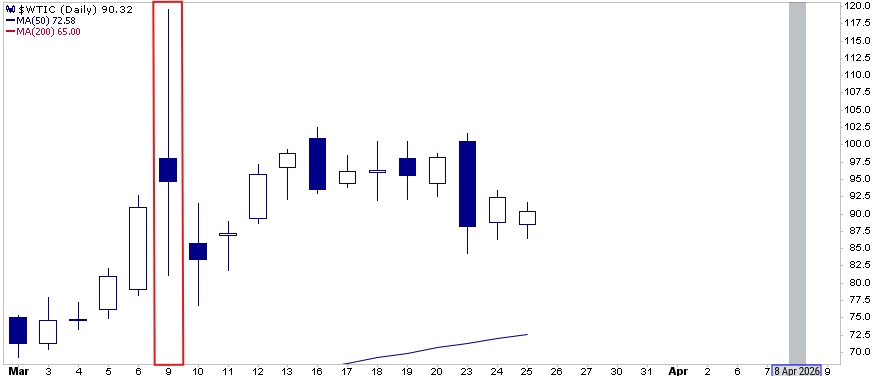
It was a brutal week on Wall Street. The S&P 500 finished at its lowest close since mid-December, logging a 2.0% loss, its largest weekly decline in nearly 5 months. It now sits 3.42% off its all-time high from January 27. The headline catalyst was unmistakably geopolitical. The U.S. and Israeli strikes on Iran over the prior weekend sent shockwaves through global markets on Monday morning. Oil markets told a more persistent story. Brent crude surged to $90 a barrel by Friday from roughly $70 before the strikes began. The potential squeeze on corporate margins and the reigniting of inflation fears weighed on outlooks.
But to pin the week's losses entirely on the Iran conflict would be a convenient oversimplification. Beneath the geopolitical noise, two structural fault lines were quietly widening. First, the labor market. Nonfarm payrolls fell by 92,000. We discuss this data more in the Key Catalyst section below.
Second, and perhaps most underappreciated by retail investors, were accelerating cracks in private credit. Blackstone's flagship $82 billion BCRED fund faced a record 7.9% redemption request. That is roughly $3.8 billion in a single quarter. In response, Blackstone lifted its usual 5% withdrawal cap and injected $400 million of its own capital to meet obligations. Blue Owl Capital separately ended regular quarterly liquidity payments in its flagship retail-facing private credit strategy. Blue Owl opted instead for periodic payouts funded by asset sales. Then on Friday, BlackRock's $26 billion private credit fund began limiting withdrawals amid rising redemption requests. That trifecta of institutional stress that, taken together, evokes uncomfortable echoes of 2007's early credit market fractures.
So what actually drove the sell-off? The Iran conflict was the spark, but the kindling was already soaked. Weak employment data, a Fed paralyzed between stagflationary forces, and institutional-grade liquidity pressure in the $1.8 trillion private credit complex had been building for weeks before the first missile was fired. The geopolitical shock simply gave institutional sellers an orderly excuse to de-risk positions they were already uncomfortable holding.
Heading into next week, traders should watch two things closely. First, whether oil prices consolidate below $90 or push toward the psychologically significant $100 level. Secondly, whether Friday's jobs report prompts any Fed officials to shift tone toward cuts. Any hawkish hold stance combined with continued energy price pressure will keep equities on the defensive. The 200-day moving average on the S&P looms as the next meaningful technical test. A break below it would likely invite a more aggressive round of deleveraging.
Which brings us to the market.
📈Technical Backdrop - Consolidation Deepens As Momentum Fades
The S&P 500 closed Friday at 6,852, down roughly 0.8% on the session and approximately 2.1% from its late-January high of 7,002. From a momentum standpoint, conditions have deteriorated on the short-term time frame. The 14-day RSI has slipped to approximately 39, a weak reading and trending lower. The MACD has crossed bearishly, with the histogram printing in negative territory. The index now trades below both its 20-DMA (~6,910) and 50-DMA (~6,881), which have flattened into overhead resistance. Most importantly, the 20-DMA has crossed bearishly below the 50-DMA, confirming the weakening market backdrop.
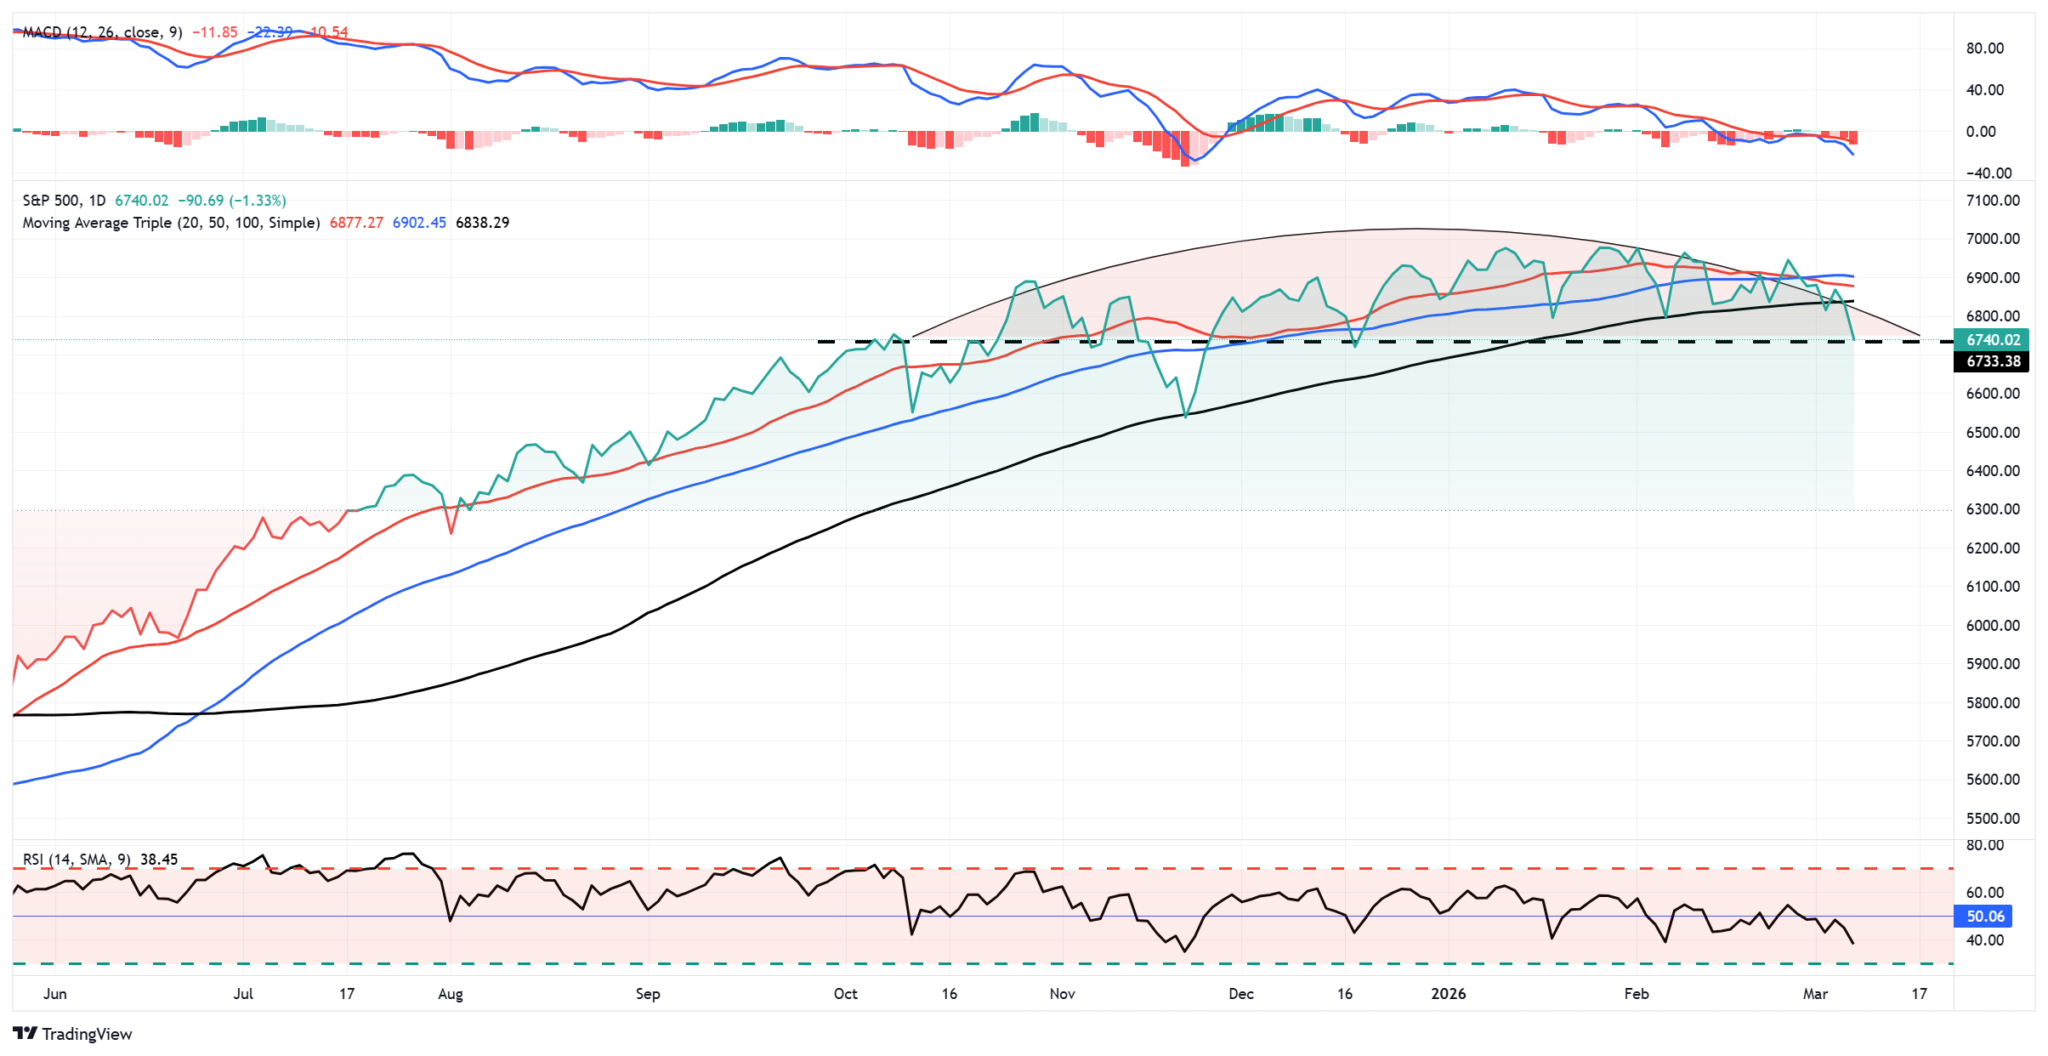
The market closed on Friday at the support, going back to mid-December and the previous tops in October. However, the close firmly below the 100-DMA, which has previously contained selloffs, suggests more risk heading into next week. Volatility is also on the move. The VIX surged on Friday, closing near 30, its highest level since last November's sell-off. That rising VIX poses a reflexive risk, as systematic strategies that added exposure during the recent low-volatility window may face mechanical de-risking if the VIX sustains above 20.

Breadth, however, remains the bull case. Approximately 58% of S&P 500 constituents remain above their 200-DMA. Despite the correction in the broad market index, this is a market correcting through rotation, not liquidation. The sectors doing the heavy lifting (Industrials, Energy, Materials, Staples) represent only ~19% of index weight, barely offsetting the drag from Technology alone (~29%).
Bottom line: The bull trend is intact, but short-term momentum has weakened into overhead resistance. I suspect we will get a better entry point for a rally as we get into mid-March, as seasonal tailwinds are mildly positive. However, this is a midterm election year, which historically delivers muted first-half returns and an average intra-year drawdown of 18%. Watch the 6,740 level closely, and a break below 6,720 would be a “warning shot.” The next meaningful rally will likely come from a rotation back into the oversold mega-cap sectors, Technology, Communications, and Financials, rather than a continuation of the value/cyclical leadership. Rebalance winners, define risk levels, and don’t fight the trend, but protect gains.
| Level Type | Price Zone | Technical Significance |
| Immediate Resistance | 6,950 – 7,000 | Psychological round-number resistance. Repeated failures during February consolidation. |
| Secondary Resistance | 7,100 – 7,206 | First extension target above the range; aligns with BofA technical objective. |
| Initial Resistance | 6,838 - 6,902 | 100-DMA (6,838), 50-DMA (~6,902), and 20-DMA (~6,877). Overhead resistance the market must reclaim. |
| Intermediate Support | 6,715 | Bottom of the consolidation range. |
| Major Support | 6,582 | 200-DMA. A breakdown to this level signals meaningful trend deterioration. |
🔑 Key Catalysts Next Week
Friday's payrolls shock, the economy shed 92,000 jobs versus expectations for a 50,000 gain. December was revised to negative 17,000, and sets up Wednesday's February CPI as the most consequential inflation print in months. The labor market is cracking: it's the third negative print in five months, unemployment ticked to 4.4%, and long-term unemployment hit its highest since late 2021. But wages ran hot at 0.4% monthly and 3.8% annually, both above forecast. That's the stagflation cocktail the Fed dreads — weakening employment with sticky wage pressure.
A cool CPI, headline below 0.2% monthly, core at or below 0.2%, would hand the Fed the cover it needs to signal a rate cut is on the table, possibly as soon as June. Fed Governor Waller practically telegraphed it Friday, saying "if we get a bad number" on jobs, followed by tame inflation, holding rates becomes hard to justify. Markets would reprice aggressively, with Treasuries rallying, the 2-year yield dropping, and rate-sensitive equities surging.
A hot print changes everything. If core CPI accelerates above 0.3% monthly or the yearly rate ticks above 2.5%, the Fed is trapped: a deteriorating labor market it can't rescue because inflation won't cooperate. That's when "higher for longer" becomes "higher into weakness," the worst possible setup for risk assets. Rate-cut expectations are pushed to late 2026 or beyond, and the yield curve reprices toward inversion again.
Friday compounds the risk with January PCE, the Fed's actual preferred gauge, where core was already running an uncomfortable 3.0% YoY with a 0.4% monthly pace. Two inflation reads in one week either confirm the disinflationary trend the doves need or cement the stagflation thesis that has no clean policy answer. The GDP second estimate (revising that soft 1.4% Q4 print) and University of Michigan sentiment round out the triple-header, but they're secondary. This week lives and dies on CPI.

Need Help With
Your Investing Strategy?
Are you looking for comprehensive financial, insurance, and estate planning services? Need a risk-managed portfolio management strategy to grow and protect your savings? Whatever your needs are, we are here to help.

💰 Oppenheimer: The Risk Calculus Has Changed
Peter Oppenheimer, Goldman Sachs’s chief global equity strategist and one of Wall Street’s most closely followed market voices, published a research note this past week that should focus the attention of every portfolio allocator. His argument is direct and increasingly difficult to dismiss: "the risk backdrop for equities has fundamentally changed."
"After an unusually powerful post-pandemic rally that ranks among the strongest multi-year stretches in a century of market history, valuations across virtually every global region are elevated, equity risk premia have compressed to levels not seen since the months preceding the 2008 financial crisis, and leadership within the market is undergoing a dramatic, generational rotation. The near-term risk of a correction is rising—even if the probability of a full-blown bear market remains low."
That final distinction matters enormously. We have noted for some time that the risks of a corrective period in the market are rising. Whether it is from excess valuations, speculation, or leverage, those risks are more prevalent than we have seen since the pandemic.
Let me be very clear: this is not a call to sell everything and retreat to cash. It is, however, a call to recalibrate expectations, reassess portfolio construction, and recognize that the margin of safety embedded in equity prices has eroded considerably, particularly in areas previously considered "value." Understanding the difference between a corrective environment and a structural bear market is critical to positioning correctly in the months ahead.
The epicenter of Oppenheimer’s thesis lies in the equity risk premium. The equity risk premium (ERP) can be calculated in different ways, but essentially, it is the incremental return investors demand for owning stocks relative to safer government bonds. The ERP is the market’s embedded compensation for uncertainty, and when it compresses to thin levels, it means investors are accepting equity-like volatility for bond-like expected returns. Today, and as Oppenheimer identifies, the equity risk premia across most markets have now fallen back to levels last observed in the run-up to the Great Financial Crisis.
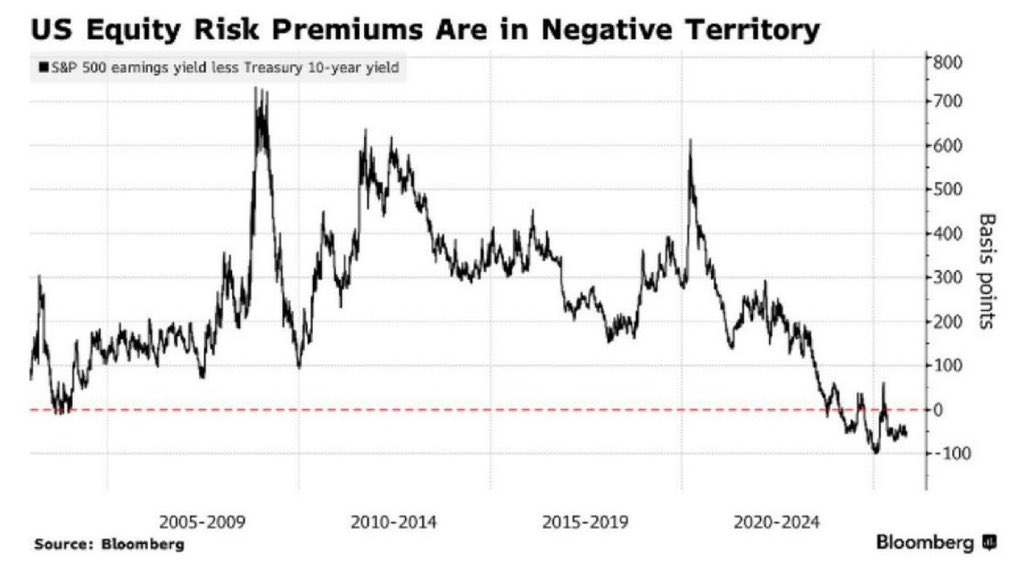
As Oppenheimer noted, the ERP is not just exceptionally low in the U.S. but globally. The exceptionally low ERP is another reason that even though investors may "think" they are buying "value," or at least markets that "seem" cheaper than the U.S., they really aren't.
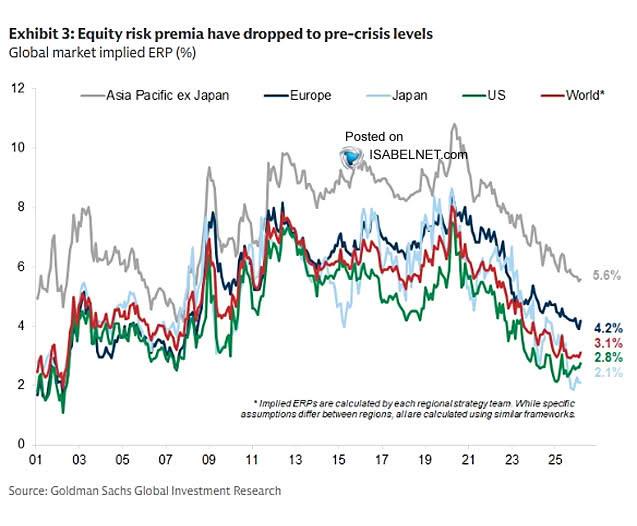
With the S&P 500’s forward earnings yield now near parity with the 10-year U.S. Treasury yield, and as Oppenheimer points out, the ERP in the US is among the lowest readings on record. For context, the long-run average ERP for the S&P 500 has historically ranged from 3% to 5%. Professor Aswath Damodaran of NYU Stern, widely regarded as the leading academic authority on ERP estimation, noted in his January 2025 data update that even assuming the ERP climbs back to 4.5%, above the 1960-2024 average but below the post-2008 norm, the implied fair value of the S&P 500 would sit roughly 12% below where the index traded at that time.
That gap has only widened since.
Crucially, a near-zero risk premium does not guarantee an imminent selloff. What it guarantees is that the market has almost no capacity to absorb negative surprises. As Oppenheimer stated, equities are now “more vulnerable to disappointments or shocks” driven by technology competition, geopolitical disruption, or a deteriorating growth-inflation mix. When investors are paid nothing extra to own stocks rather than Treasuries, even modest disappointments can trigger outsized repricing.
The Great Rotation: Technology’s Historic Reversal
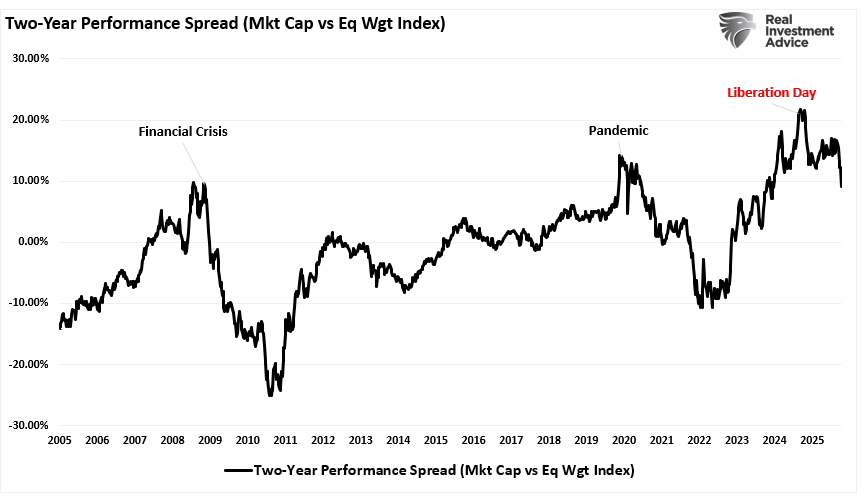
Over the past couple of months, we have discussed what Oppenheimer highlighted as one of the most significant sector-level developments in modern market history. That, of course, has been the massive rotation out of Technology stocks into the "value" sectors of Staples, Energy, Industrials, Materials, and Utilities. That rotation has led to one of the weakest relative periods for the market-cap-weighted index compared to the equal-weighted index since the Pandemic.
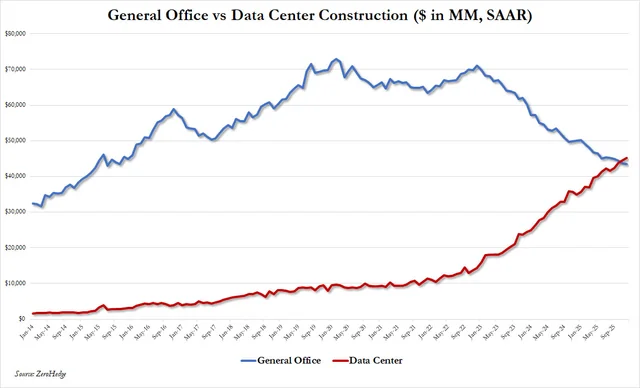
The narrative behind that rotation was driven by escalating anxiety over the returns on capital expenditures in artificial intelligence and fears that AI capabilities are disrupting existing software revenue streams faster than they are creating new ones. However, while that narrative lacks grounding in facts, it has been more of the "reflation" narrative that supported the rotation. That narrative assumes stronger economic growth, with little inflation, that keeps the Federal Reserve accommodative and improves earnings growth rates for the "asset-heavy" companies involved in data center construction.
However, here is the problem.
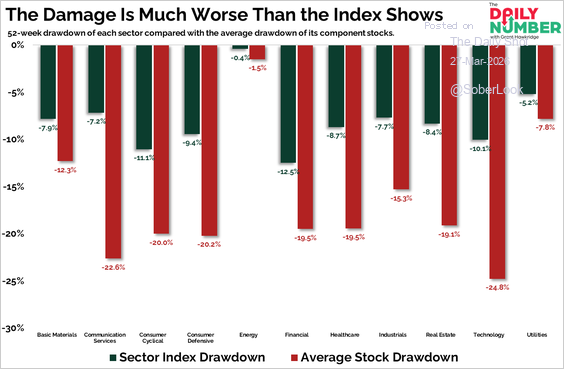
The reversal has been so profound that U.S. asset-heavy industrial stocks now trade at a price-to-earnings premium over asset-light technology companies. Oppenheimer noted that cyclical stocks outperformed defensive names for 14 consecutive trading sessions in late 2025, the longest such streak in over 15 years. As shown, the current valuations for Industrials, Energy, Materials, Staples, and Utilities are now trading at historical extremes, with sector-level dispersion in the 99th percentile of historical norms.
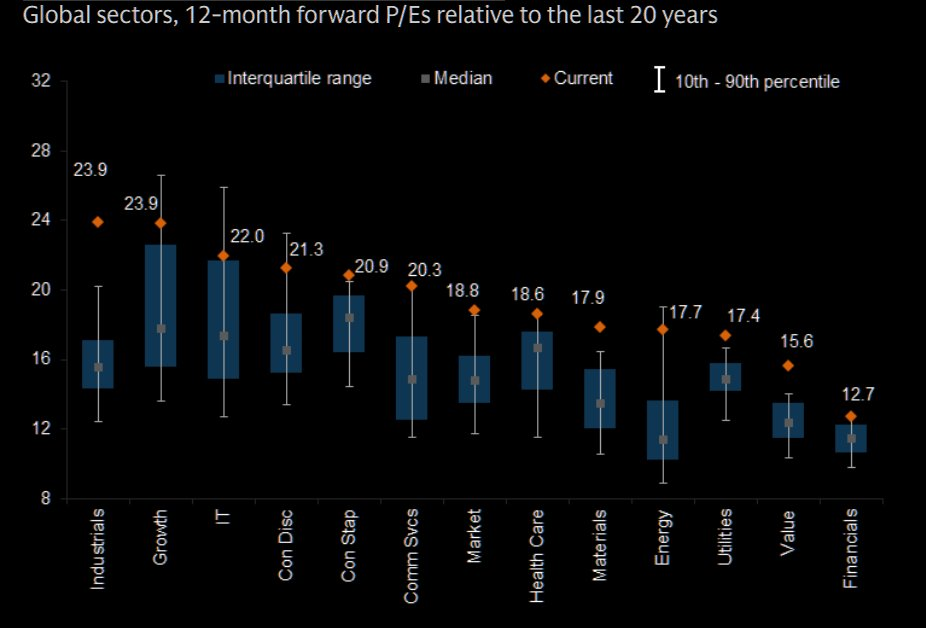
Crucially, this rotation itself creates new vulnerabilities. Cyclical sectors, which are sensitive to the economic cycle, have now dramatically outperformed defensive sectors, and cyclicals trade at roughly the same valuation as defensives. That pricing dynamic leaves virtually no margin of safety if economic confidence wavers.
Investor Positioning: Tactical Adjustments for a Correction-Prone Market
The current conditions certainly suggest a potential for a corrective cycle in which value shifts back to growth due to valuation differentials. However, I agree with Oppenheimer's view that the conditions needed for an extended bear market are largely absent. While there are currently some concerns about "private credit," those issues are largely contained and relatively small compared to the "subprime credit issues" that led up to the financial crisis. There is also no impending risk of a severe recession, banking-sector collapse, or consumer withdrawal.
What is present is a market priced for perfection, leaving it fragile to anything less. In Oppenheimer’s framework, the current cycle sits in the “optimism phase” that follows the despair of a bear market, the hope of a rebound, and the growth phase driven by fundamentals. It is in these late-cycle periods that valuations stretch and corrections become more frequent. Oppenheimer’s historical analysis shows that most geopolitical shocks produce a median S&P 500 correction of roughly 6% over 18 days, followed by stabilization. Yes, it is painful but not catastrophic, and often provides attractive re-entry points. As Oppenheimer wrote,
"Correction risks are high, but any pullback should present a buying opportunity rather than the onset of a sustained downturn."
So, what is Oppenheimer’s prescription for navigating the next phase of the market cycle? For investors seeking to align portfolios with a shifting risk landscape, it will be more critical and warrants consideration:
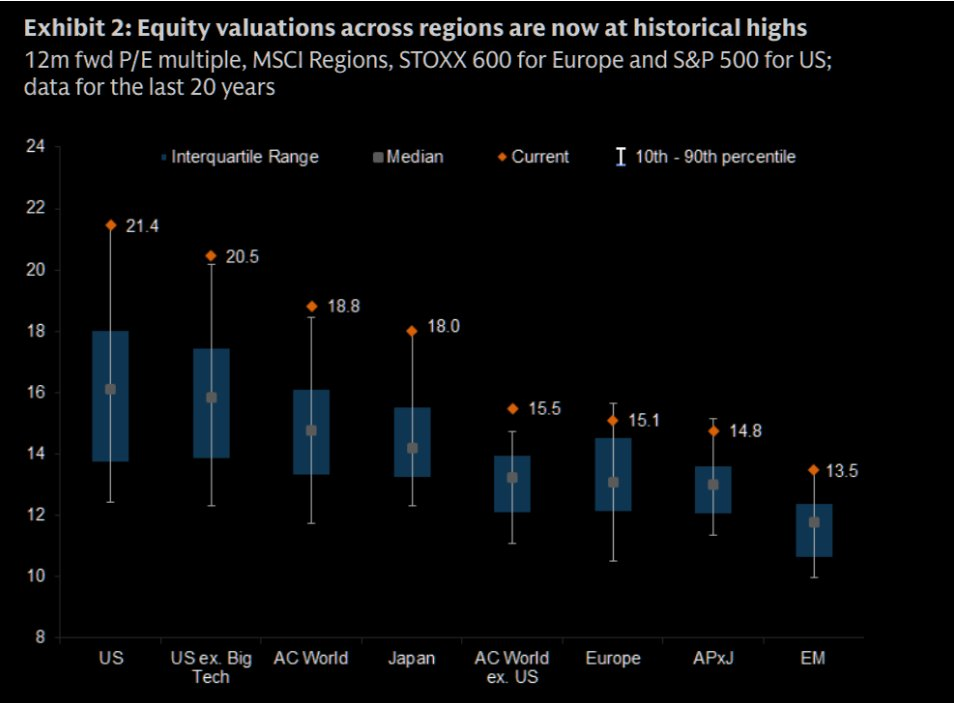
- Rebalance Geographic Exposure. As shown below, the tailwinds of a weaker US Dollar have been hugely supportive of international and emerging markets. However, those markets are now exceptionally overvalued relative to their long-term averages. Rebalance exposures to reduce the risk of a stronger US dollar cycle.
- Diversify Across Factors and Sectors. With technology’s relative premium compressing and cyclicals having already repriced sharply higher, the opportunity increasingly lies in quality-oriented, dividend-growing companies that can deliver returns through earnings and distributions rather than further multiple expansion.
- Integrate High-Quality Fixed Income. For the first time in nearly two decades, bonds offer a genuinely competitive alternative to equities. With the equity risk premium near zero, investment-grade corporate bonds and intermediate-duration Treasuries provide attractive yields without requiring investors to bear the full downside risk of an equity selloff.
- Maintain Disciplined Cash Reserves. With pullback risks elevated but bear market probabilities low, the optimal posture is not wholesale de-risking but rather ensuring sufficient dry powder to deploy opportunistically when the inevitable repricing arrives. This is especially prudent in a midterm election year where historical drawdowns tend to be front-loaded before November, with the subsequent six-month period historically delivering average S&P 500 returns of 14%.
- Reduce Concentration Risk. Portfolios that are heavily concentrated in specific sectors or markets carry idiosyncratic risk that diversified approaches can mitigate without necessarily sacrificing upside participation.
- Build Optionality Around Tail Risks. In a market priced for perfection, the cost of hedging tends to be lower than investors expect precisely because complacency suppresses implied volatility. Protective put strategies, collar structures, or systematic risk-management overlays can provide asymmetric payoff profiles that cushion drawdowns without requiring precise market timing.
The overarching thesis of these adjustments is a single imperative: reduce fragility. Like us, Oppenheimer's discussion is not about fostering fear, but about preparation. The structural supports for this bull market remain intact. Earnings are growing, balance sheets are healthy, and monetary policy remains broadly accommodative. But the price investors are paying for those favorable conditions has left almost no margin for error.
The bottom line is not complicated. The post-pandemic rally has been extraordinary, but the risk-reward calculus has shifted. Valuations are rich, the cushion of the equity risk premium has largely evaporated, market leadership is rotating at historic speed, breadth is deteriorating beneath the surface, and the smart money is selling into strength. Investors who acknowledge this shift and position accordingly will be best prepared to navigate what comes next and capitalize on the buying opportunities that corrections inevitably create.
🖊️ From Lance’s Desk
This week's #MacroView blog digs into how the rise of stablecoins could strengthen the Dollar.

Also Posted This Week:
- The Passive Aggressive Market: Bogle's Warning Came True - RIA - by Michael Lebowitz
- SaaS: Is There Opportunity In The Destruction? - RIA - by Lance Roberts
📹 Watch & Listen
A discussion about the 100-DMA and what potentially happens if a break occurs, as it did on Friday.
Subscribe To Our YouTube Channel To Get Notified Of All Our Videos
📊 Market Statistics & Analysis
Weekly technical overview across key sectors, risk indicators, and market internals

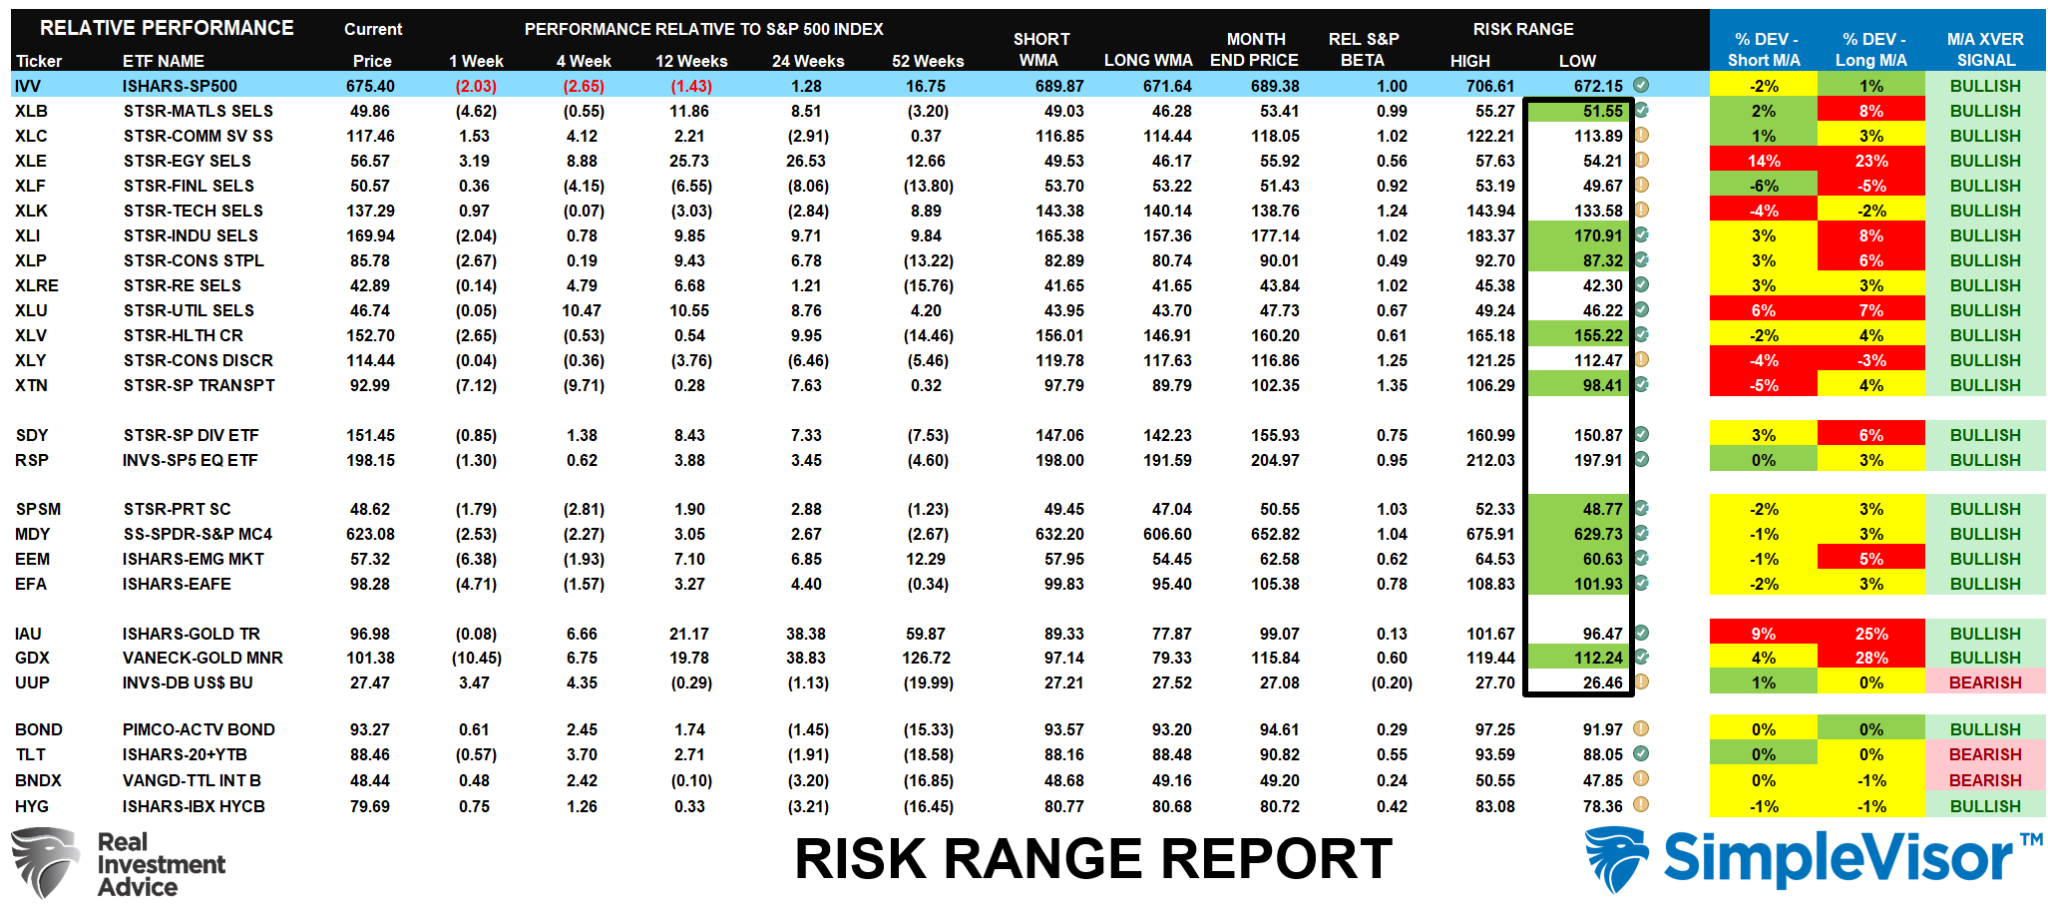
💸 Market & Sector X-Ray: Market Cracks Support
As discussed last week, "Energy, Materials, Industrials, and Staples, or rather 'value,' have strongly outperformed every other market and sector this year. These areas are the most overbought. A rotation back to growth seems increasingly obvious, but momentum is a hard thing to kill. Take profits and rebalance portfolios accordingly." This past week, with the exception of energy, the rotation out of value, particularly international, was strong. We may not be done yet if oil prices remain elevated, so manage risk carefully.

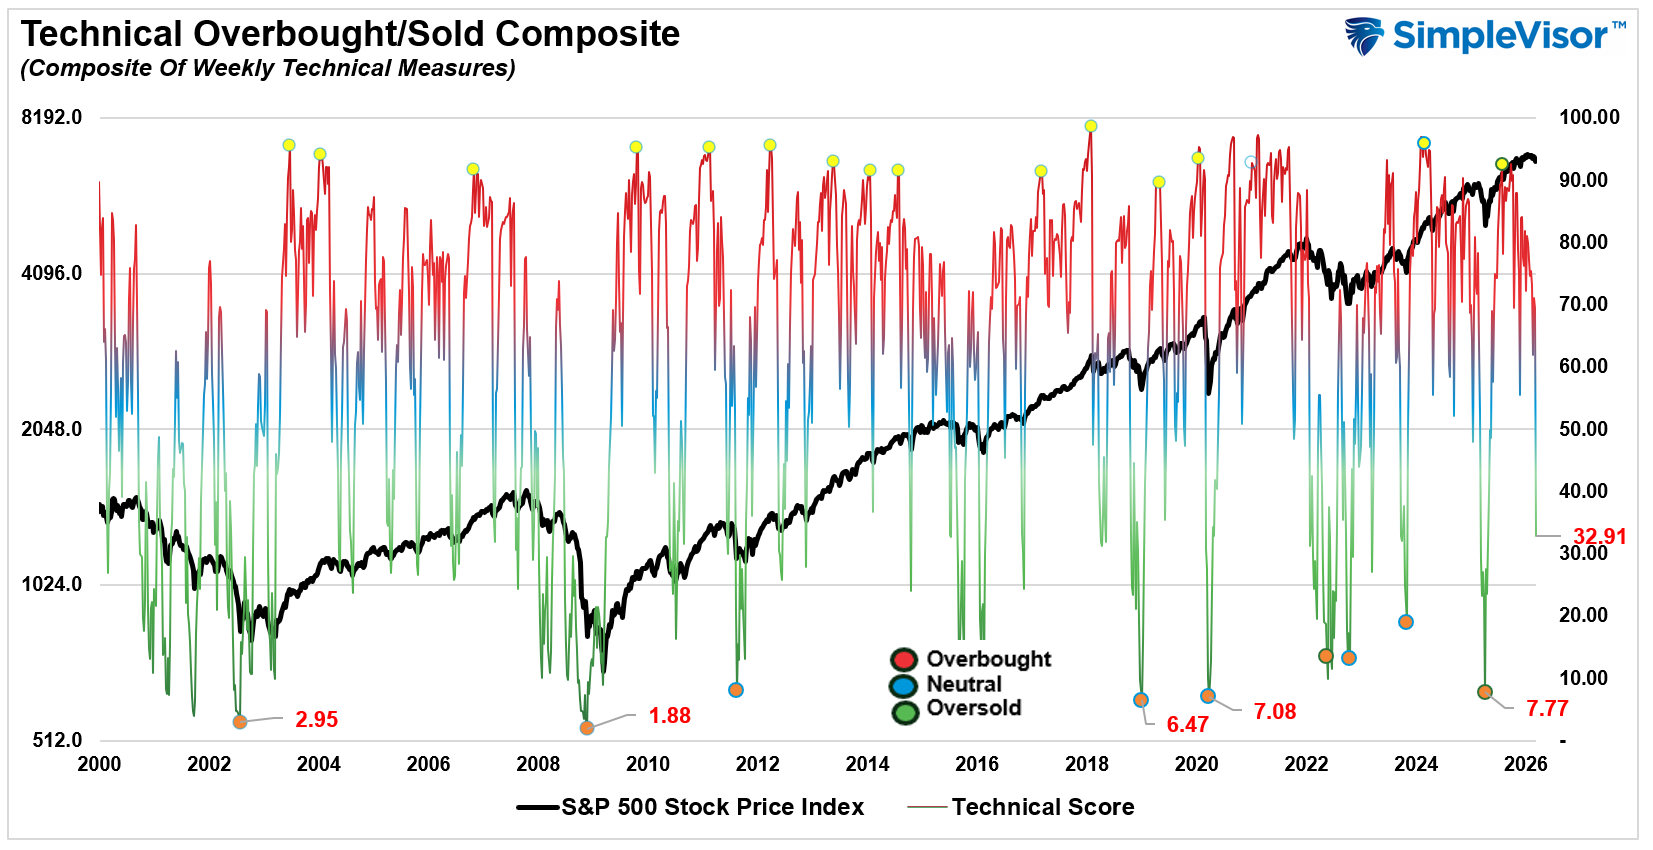
📐 Technical Composite: 32.91 – Market Oversold
As noted last week: "I continue to suspect we will get a better entry point for a rally as we get into March." The Iran conflict this past week set the market back on its heels and pushed it into even more oversold territory. If energy prices remain elevated next week, we could see some additional pressure, but an entry point is approaching for traders to increase allocations.
🤑 Fear/Greed Index: 64.18 – Sentiment Retreating
This past week, sentiment dropped sharply as expectations of global economic outperformance faded, the Iran conflict intensified, and energy prices surged. While the reversal in sentiment was sharp, it was mostly due to a contraction in outlook and a sharp uptick in volatility, rather than a decisive risk-off move in equity positioning.

🔁 Relative Sector Performance
As we noted last week, the "bifurcation" in market-sector performance is pretty telling. Financials, Discretionary, Services, and Technology (the largest sectors of the S&P 500) are the most oversold, while Industrials, Energy, Materials, Utilities, and Real Estate are the most overbought.

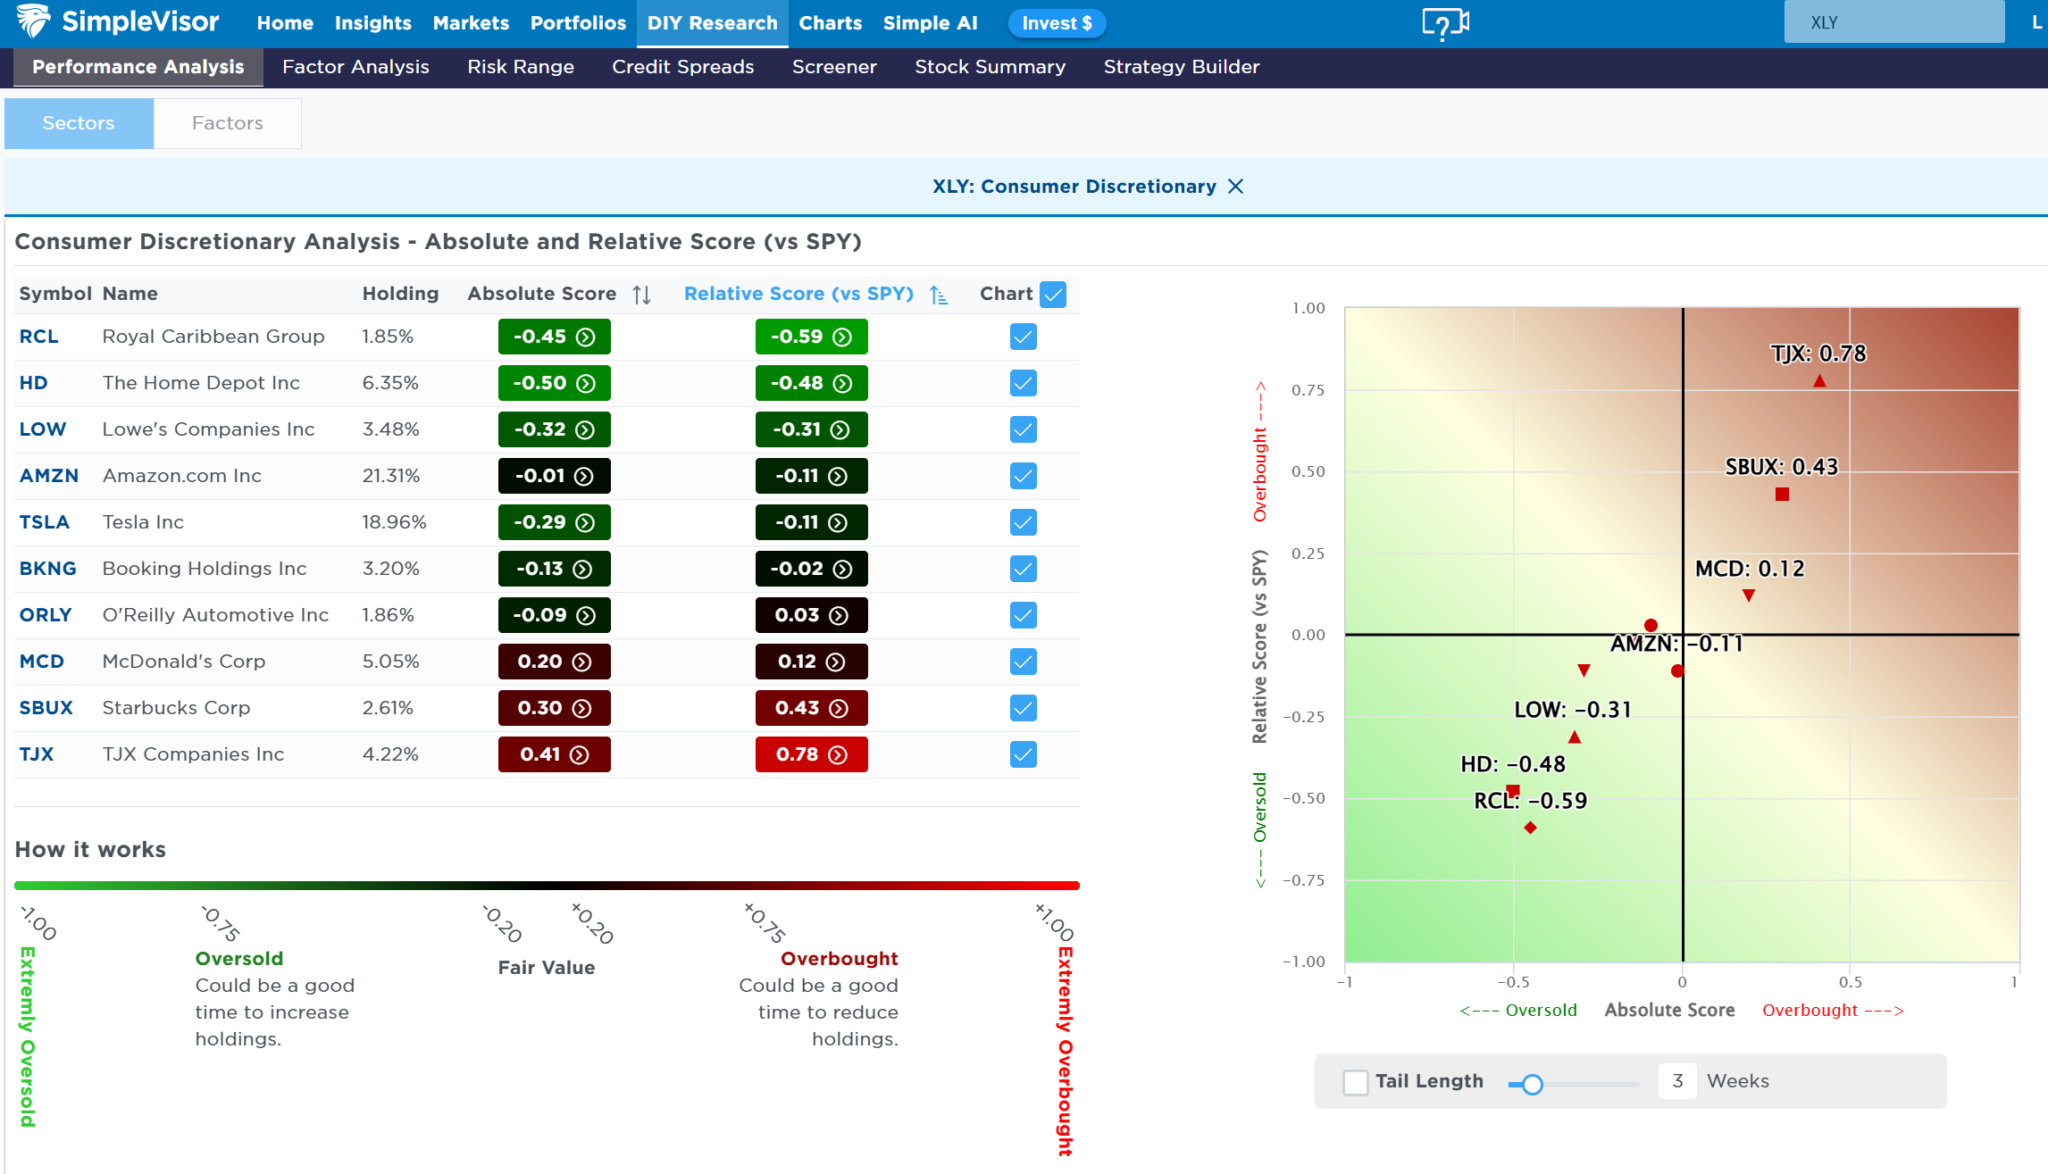
📊 Most Oversold Sector Holdings
While Financials remain the most oversold, I wanted to look at Discretionary given the recent selloff in those stocks. The most oversold in the sector are RCL, HD, LOW and AMZN. These stock are very oversold, and if we see a rotation back to growth, these stocks will likely participate in that advance.
📊 Sector Model & Risk Ranges
Last week, we noted that many sectors were all at extreme deviations from their longer-term means. "These more extreme deviations will eventually correct themselves, so continue to manage risk accordingly." This week, with the exception of Energy, the reversals were sharp. Those deviations still remain this week, so we could see further weakness next week if energy prices remain elevated. Risk management is key heading into next week.
Have a great week.
Lance Roberts, CIO, RIA Advisors
The post Oppenheimer: The Risk Calculus Has Changed appeared first on RIA.
Full story here Are you the author?You Might Also Like
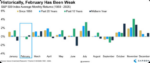
 The Weak Dollar Narrative
2026-02-14
🔎 At a Glance 🏛️ Market Brief – February Lives Up To Its Name We noted last week that February tends to be a weaker month for returns. So far, it has certainly lived up to its name. This past week opened with investors selling technology, and particularly software stocks, to buy value sectors. Energy, …
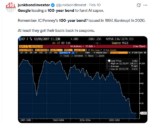 Century Bonds: A Long Term Bet On Google
2026-02-13
Google’s parent, Alphabet, just issued $32 billion in global debt, including £1 billion of rare century bonds. Alphabet’s century bonds are called such because they do not mature for 100 years (2126). While the century bond is a small piece of its recent debt offering and even less of its outstanding debt ($78 billion), the …
2026-02-12
“Based on its current assessment, the Governing Council considers that the key ECB interest rates have reached levels that, maintained for a sufficiently long duration, will make a substantial contribution to the timely return of inflation to target.” And with that statement, the European Central Bank (ECB) appears to have halted its rate hiking cycle. …
 Technology Stocks: Dead Or An Opportunity?
2026-02-07
🔎 At a Glance 🏛️ Market Brief – Market Volatility Returns Markets stumbled into February, a historically weak month. February tends to deliver modest returns, with average performance trailing the stronger gains typically seen in January and March. Seasonal tailwinds, such as earnings season and new-year fund flows, begin to fade, while macro headwinds, such …
 The Santa Claus Rally Begins
2025-12-27
🔎 At a Glance 💬 Editor Note I am traveling this weekend for the Christmas holidays with the family. Therefore, I don’t have access to all of my usual data and analysis. However, I did not want to miss the opportunity to send you at least a short note. The following Market Brief and Technical …
 QE Is Back: Which Assets Benefits From The Liquidity Boost
2025-12-17
QE is back! On December 10th, the Federal Reserve announced its plan to purchase $40 billion in Treasury securities each month for at least four months. Through these QE purchases, bank reserves will increase, and recent liquidity concerns should lessen. Furthermore, increased liquidity often leads to more speculative market conditions and higher asset prices as …
 Rebasing The Dollar: Another Look At The Debasing Narrative
2025-10-29
The phrase “debasing the currency” is all the rage in the media. Moreover, the debasement narrative is used to support the significant surge in gold and other precious metal prices. We have written a few articles on the subject of debasement, for example: Dollar Debasement and Debasement: What It Is and Isn’t. To help further …
Tags: Featured,newsletter