Lance Roberts
My articles My offerMy siteAbout meMy videosMy books
Follow on:TwitterSeeking AlphaFacebookAmazon
🔎 At a Glance
- CDX: Credit Spreads Are Flashing A Warning
- Market Brief & Technical Review
- From Lance's Desk: The Dollar's Plumbing: Conspiracy Vs. Data - RIA
- Market stats, screens, and risk indicators
🏛️ Market Brief - A Tough Market Week
This week gave investors a brief exhale — and then took it back as Monday opened with genuine relief after news broke that a U.S.-led coalition would escort tankers through the Strait of Hormuz. On that news, oil pulled back sharply, the S&P surged 1.2%, and the Nasdaq led with a 1.4% gain. It was the index's best single session in over a month. However, that optimism didn't survive the week.
By midweek, the inflation data changed the tone. February CPI came in line at 2.4% year-over-year, technically benign. However, as economists noted, it was the last clean read before the oil shock flooded the March data. The producer side told a more urgent story. February PPI jumped 0.7% month-over-month, its hottest reading since July 2025, pushing the year-over-year rate to 3.4%. Goods prices surged 1.1%, which was the largest single-month jump since August 2023, and core PPI logged its tenth consecutive monthly increase. That is a pipeline problem, and it arrives precisely when energy costs are about to hit with full force.
But that wasn't all, as the FOMC meeting was scheduled for Wednesday. The Fed held rates steady at 3.5%–3.75%, as expected. But it was the messaging that rattled markets. The updated dot plot pointed to just one cut in 2026 and another in 2027, with seven participants now signaling no cuts at all this year. Powell acknowledged the Fed had made progress on inflation, but "not as much as we had hoped." With the potential for "higher rates" for the rest of this year, stocks fell to session lows.
But that was the headline data. In the background, private credit continues quietly deteriorating. Blackstone, Blue Owl, and BlackRock have all seen redemption requests breach or approach the standard 5% threshold that allows managers to restrict withdrawals. JPMorgan's Bill Eigen warned that "bad news often happens all at once" in private markets. That seems to be the case as the opacity and leverage embedded in the sector have now come to light.
This brings us to two questions for next week:
- So what matters most? Oil is the master switch. If Brent stabilizes below $95, the Fed gets breathing room and rate-cut expectations reopen. If it pushes toward $110, the March CPI will be damaging, and the Fed will stay frozen; and,
- Should investors panic? Not yet. The S&P remains roughly 5% off its January all-time high, a routine pullback by all measures. But the convergence of energy inflation, a paralyzed Fed, softening labor markets, and private credit stress raises the probability of a harder landing than the base case assumes. Patience is a position.
Which brings us to the market.
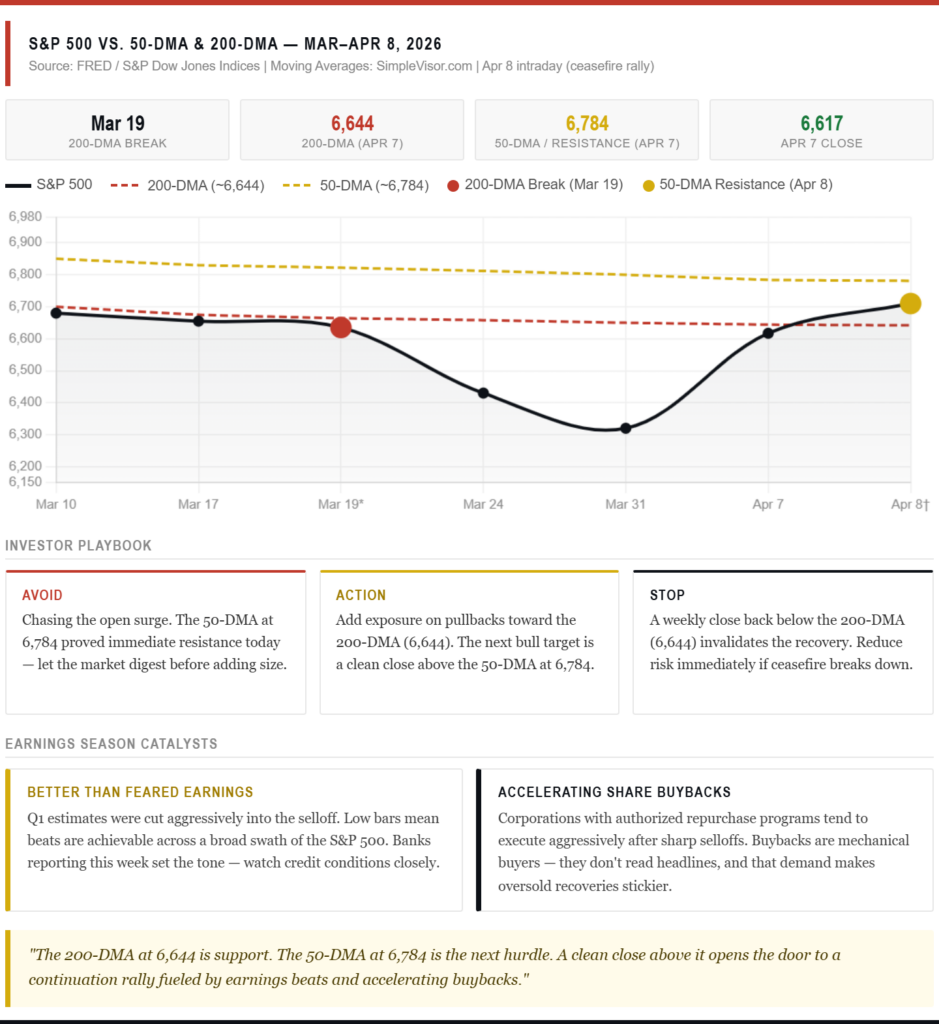
📈Technical Backdrop - Market Breaks The 200-DMA
The S&P 500 closed Friday at 6,506.48, down 1.5% on the session and now 7.1% below January’s all-time high of 7,002. This marks the fourth consecutive weekly loss and the lowest close since mid-September 2025. The Russell 2000 slipped into official correction territory, and the Dow and Nasdaq sit on the doorstep. The week was defined by a classic bull trap. A Monday/Tuesday reflex rally, fueled by Nvidia’s GTC conference and a brief retreat in oil below $100, sucked in late buyers before Wednesday’s Fed meeting violently reversed the tape. Friday’s selling accelerated after Iraq declared force majeure on all foreign-operated oil fields, confirming the Hormuz disruption is broadening.
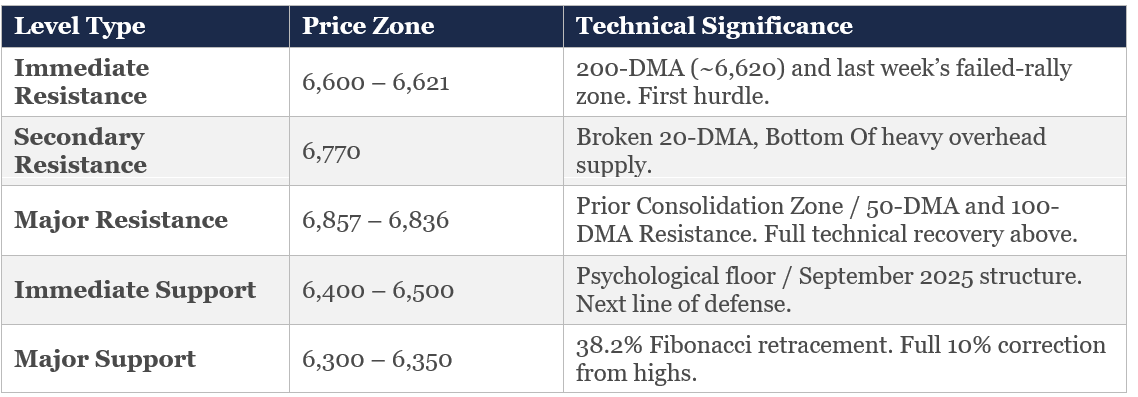
The index is now firmly below its 200-DMA (~6,620), which was decisively broken last Thursday and has failed every subsequent attempt to reclaim it. As we discussed last week, breaking the 200-DMA ended a 214-session streak above that trendline. The historical data on such breaks, however, should temper the panic: over the past decade, the S&P 500 was higher 87% of the time six months later (avg. +9%) and 85% of the time twelve months later (avg. +14%). But the path matters. The average maximum drawdown across those episodes was roughly −16.5%—meaning from current levels, a full washout could take us into the 5,800–6,000 range before a durable bottom forms. We aren’t forecasting that, but it’s the risk you need to size for.
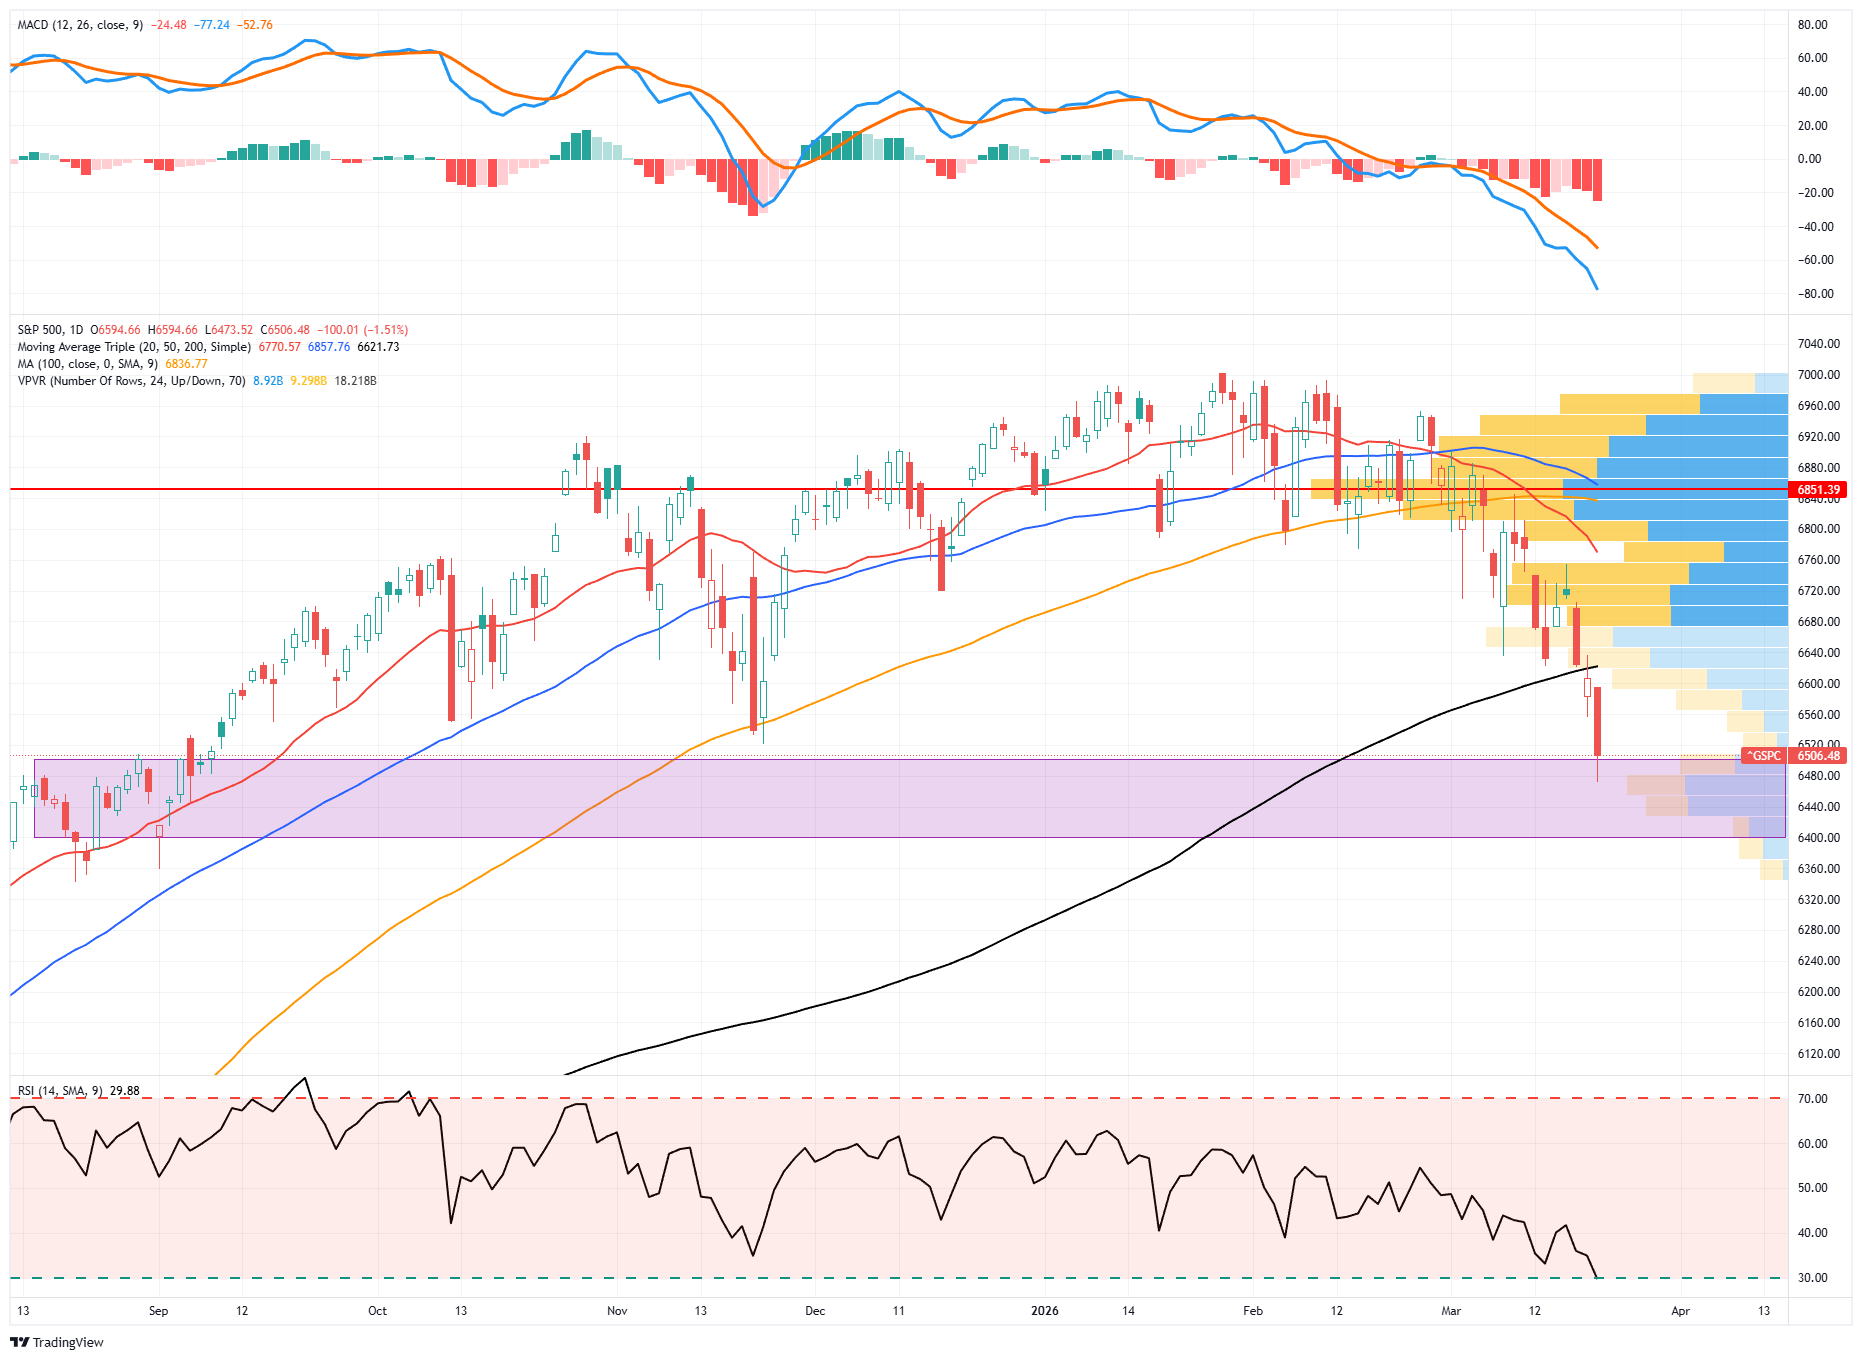
The fundamental overlay worsened this week. The Fed’s “hawkish hold” at 3.5–3.75% came with upwardly revised inflation forecasts and lower growth projections, the textbook stagflation signal we flagged two weeks ago. Macquarie now expects the Fed’s next move to be a hike, not a cut, pushed to 1H27. However, oil remains the transmission mechanism: Brent closed above $108, and the Iraq force majeure escalation on Friday threatens to widen the supply disruption. Selling has broadened beyond mega-cap tech, and Friday saw 21 S&P 500 stocks hit 52-week lows, including Home Depot, Domino’s, and McCormick, a sign the damage is spreading into consumer names.
Bottom line: The failed mid-week rally was the “buyer’s remorse” moment that confirms this tape has changed character. History says we’re more likely higher in 12 months than lower, but the next durable bottom requires either a sustained decline in oil or a credible de-escalation in the Middle East. Neither is imminent. HSBC notes markets are “pricing a recessionary outcome” and sees dislocations worth watching. I agree, this is a shopping list market, not a buy-everything market. Accumulate quality at pre-defined levels (6,400, then 6,300), keep cash reserves, and treat every bounce as suspect until the VIX sustains below 20 and oil finds a ceiling. Defense over offense.
Trade accordingly.
🔑 Key Catalysts Next Week
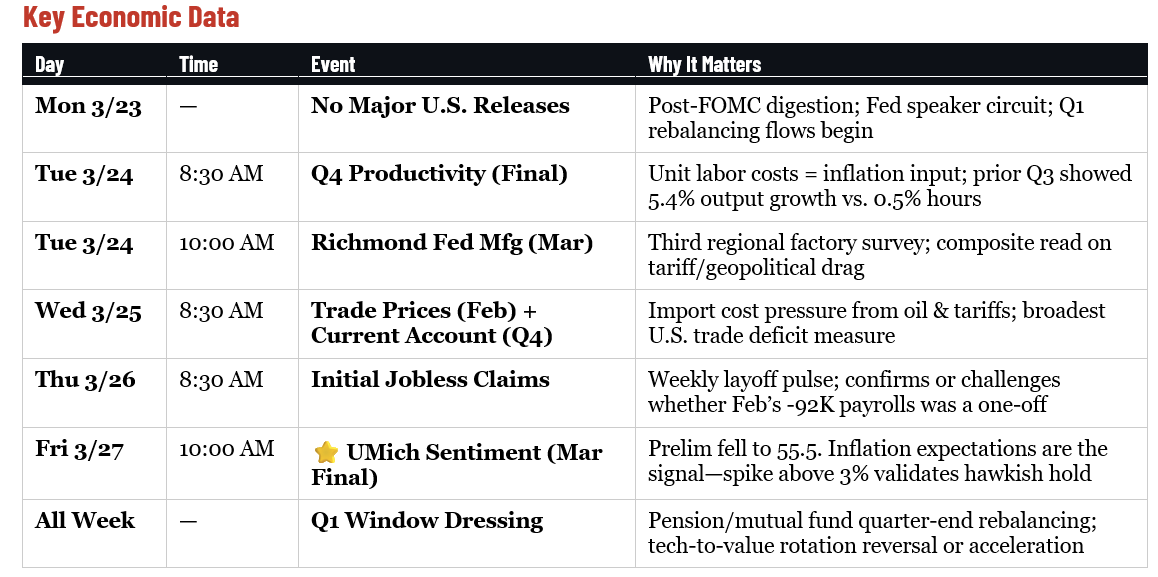
The calendar downshifts after two consecutive weeks of high-impact data. No marquee releases are scheduled, but don’t mistake a thin calendar for a quiet tape. The dominant forces will be the market’s ongoing digestion of the March 18 FOMC decision, the updated dot plot, and Powell’s characterization of the stagflation dilemma—all compounded by quarter-end institutional flows that historically amplify moves in both directions.
By Monday, traders will have had a full weekend to digest whether the dots shifted to zero cuts (risk-off repricing in housing, small caps, and high-duration tech) or held at one with dovish language acknowledging labor deterioration (relief bid). A parade of Fed speakers throughout the week will provide color, walking back or reinforcing whatever Powell signaled. Those headlines will move markets more than any scheduled data.
Tuesday’s Q4 Productivity final revision matters more than usual. The prior quarter showed output rising 5.4% while hours worked grew just 0.5%. The unit labor cost component is the inflation signal: falling costs give the Fed room, rising costs tighten the stagflation case. Richmond Fed Manufacturing rounds out the regional factory picture alongside the Empire State and Philly Fed surveys.
Friday’s final UMich Consumer Sentiment is the week’s marquee event. The preliminary reading dropped to 55.5—near post-pandemic lows. The one-year and five-year inflation expectations are what the Fed watches most closely; a spike above 3% would validate the hawkish hold and kill remaining hopes for near-term easing.
Underneath the data, the real story is mechanical: Q1 ends March 31. Pension funds and institutional allocators begin quarter-end rebalancing and window dressing. After the sharp rotation out of tech and into value that defined the first quarter, the question is whether those flows reverse or accelerate. In a thin-catalyst week, flow-driven moves can be outsized.
Don’t mistake repositioning for conviction.
Need Help With Your Investing Strategy?
Are you looking for comprehensive financial, insurance, and estate planning services? Need a risk-managed portfolio management strategy to grow and protect your savings? Whatever your needs are, we are here to help.

💰 CDX: What Do Bonds Know That The Stock Market Doesn't
Most investors spend their time watching the S&P 500. That's a mistake, because the credit market is the real "tell." The bond market has been whispering a warning for weeks now, and credit spreads are now shouting it. As of this writing, the CDX Index, a benchmark measure of credit default swap spreads, has climbed to a nine-month high while the S&P 500 sits within 5% of its all-time peak. Over the past 20 years, every time that combination appeared, a bear market followed. Every single time.
That's a track record worth taking seriously, and credit spreads are critical to understanding market sentiment and predicting potential stock market downturns. A credit spread refers to the difference in yield between two bonds of similar maturity but different credit quality. This comparison often involves Treasury bonds (considered risk-free) and corporate bonds (which carry default risk). By observing these spreads, investors can gauge risk appetite in financial markets. Such helps investors identify stress points that often precede stock market corrections.
The chart shows the annual rate of change in the S&P 500 market index versus the yield spread between Moody’s Baa corporate bond index (investment grade) and the 10-year US Treasury Bond yield. Rising yield spreads consistently coincide with lower annual returns in the financial markets.
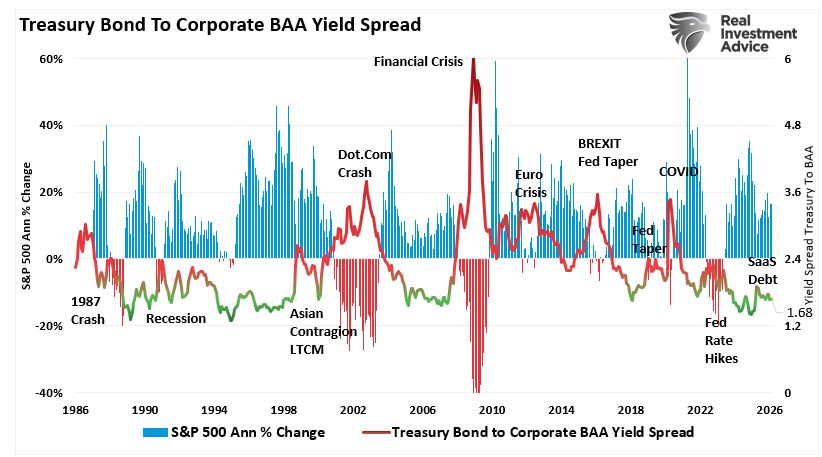
The reason is that credit is the lifeblood of the economy. Businesses borrow to operate, and consumers borrow to spend. As such, when the cost of that borrowing rises, particularly the premium lenders demand to extend credit to riskier borrowers, it signals that the economy is under stress. That "stress" directly affects forward earnings estimates and increases the likelihood of a valuation repricing.
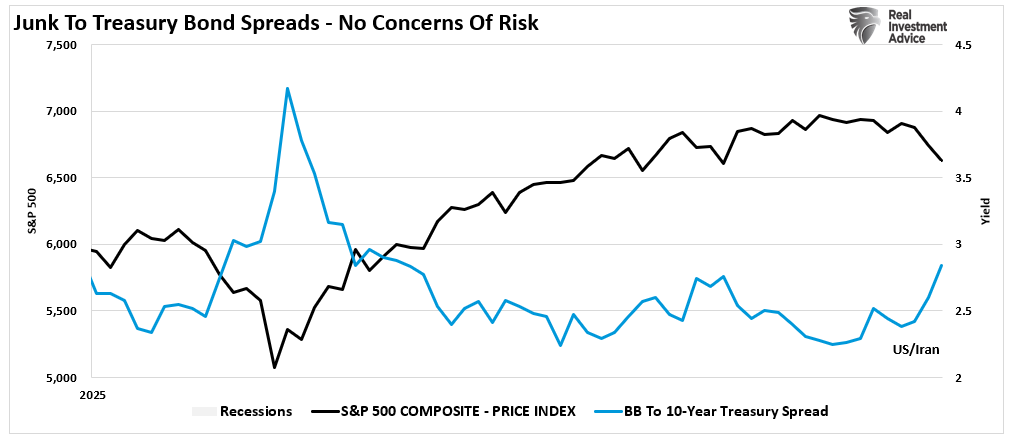
The "Junk to Treasury" spread is the clearest expression of this dynamic. Investors who buy high-yield bonds, the ones with a meaningful chance of default, should demand a premium above the risk-free rate offered by U.S. Treasury bonds. When that premium compresses, it signals that investors are comfortable speculating, willing to reach for yield without demanding adequate compensation for the risk they're accepting. When the premium expands, the mood has shifted. Lenders are getting nervous. Credit conditions are tightening. And historically, tighter credit conditions have preceded more challenging environments for stocks.
This isn't a theoretical relationship; it has repeatedly appeared in the data for decades. The bond market (CDX) prices risk continuously across thousands of issuers and maturities. It's harder to talk up than equities, and it's not susceptible to the same retail-driven momentum that can keep stock prices elevated long after the fundamental picture has deteriorated. When credit spreads widen, investors should pay attention.
What The CDX Is Telling Us Now.
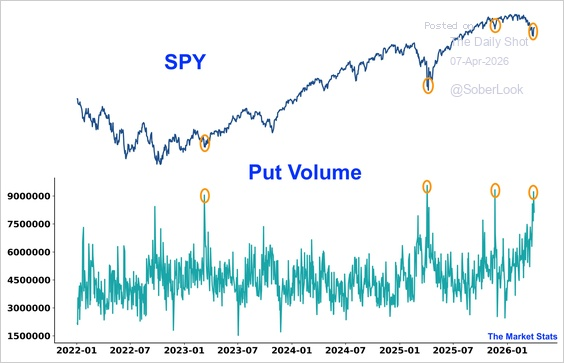
The chart from Sentiment Trader below tells the story as clearly as any amount of prose could. The top panel tracks the S&P 500 since 2007. The middle panel shows the CDX Index of credit default swaps. The bottom panel shows where those spreads stand relative to their 189-bar range, essentially a percentile reading of how elevated they are relative to recent history. (Red markers indicate instances where CDX spreads hit 9-month highs while the S&P 500 is within 5% of its high.)
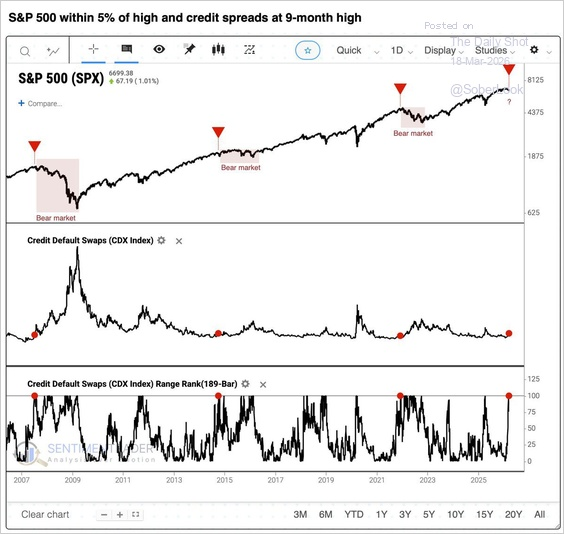
Notice that each red arrow marks a moment when CDX spreads reached a nine-month high while stocks remained near their all-time highs. The 2007 signal preceded the worst financial crisis since the Great Depression. The 2015 signal preceded a sharp correction and an extended period of volatility. The 2022 signal arrived just before the Federal Reserve's aggressive rate-hiking campaign drove the S&P 500 down 25%. And now, in early 2026, the signal has triggered again.
"This has been one of the more important divergences we've been tracking recently. CDS is pushing to a 9-month high even with equities near highs, effectively tightening financial conditions. Historically, this setup has been unstable: about half the time it led to sharp drawdowns, while the rest saw either mild pullbacks or continued gains." - Sentiment Trader
The range-rank reading in the bottom panel is particularly instructive. It shows that current CDX spread levels are not a minor blip, but are registering near the upper end of their recent historical range. That's not statistical noise, but a market pricing in genuine credit stress. The table below summarizes the four instances over the past two decades where CDX spreads hit nine-month highs while the S&P 500 traded within 5% of its peak. The subsequent market outcomes speak for themselves.
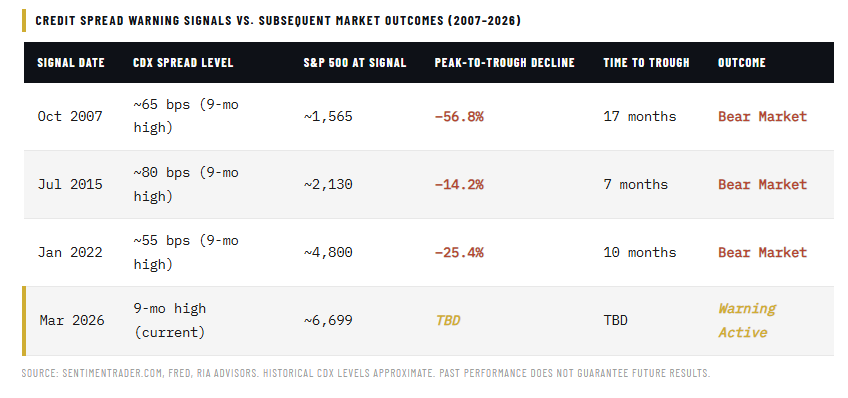
Does this mean the current situation will devolve into a bear market? Not necessarily, but history suggests the risk is elevated enough to warrant investors' attention. It is also worth noting that the magnitude of the subsequent declines varied considerably, from the catastrophic 2008 to 2009 bear market to the more contained 2015 correction. That is due to the severity of the credit impact on the underlying economy. However, they all shared a period of elevated credit spreads that the equity market initially chose to ignore.
So far, this "time is not different."
The Counterargument Is Not Convincing
The bulls will argue that CDX spreads are widening from historically tight levels and that the absolute level of stress remains modest by historical standards. That's technically accurate, as shown, Treasury-to-Junk Bond spreads in early 2026 are not at the panic levels seen in 2008 or 2020. So why worry?

It isn't the absolute level of the CDX that matters, but the direction of travel and the rate of change. If investors wait for the "spike," it will likely be too late to act. Sentiment Trader's nine-month high threshold isn't about measuring the peak of a crisis; it is a warning of a potential turn. Credit stress doesn't arrive fully formed. It builds. Each of the prior signals triggered before the real damage was done, precisely because spreads were starting to move, not because they had already maxed out.
There's also the macro backdrop to consider. The S&P 500 enters this period with valuations near the upper end of its historical range, forward earnings estimates elevated, and sentiment still bullish. As investors, we monitor the high-yield spread closely because it is often one of the earliest signals of a fundamental shift in corporate and economic conditions. In other words, watching spreads provides insights into the health of the corporate sector, which is a major driver of equity performance. When CDX spreads widen, they often lead to lower corporate earnings, economic contraction, and stock market downturns. The reason is that a significant widening of the CDX spreads signal:
- Liquidity Drain: As investors become more risk-averse, they shift capital from corporate bonds to safer assets, such as Treasuries. The flight to safety reduces liquidity in the corporate bond market. Lower liquidity can lead to tighter credit conditions, affecting businesses’ ability to invest and grow and weighing on stock prices.
- Corporate Financial Health: Credit spreads reflect investor views on corporate solvency. A rising spread suggests a growing concern over companies’ ability to service their debt. Particularly if the economy slows or interest rates rise.
- Risk Sentiment Shift: Credit markets are more sensitive to economic shocks than equity markets. When CDX spreads widen, it typically indicates that the fixed-income market is pricing in higher risks. This is often a leading indicator of equity market stress.
- Corporate earnings may decline: Companies with lower credit ratings may struggle to refinance debt at favorable rates, thereby reducing profitability.
- Economic growth is slowing: A widening CDX spread often reflects concerns that the economy is heading for a slowdown, which can lead to reduced consumer spending, lower business investment, and weaker job growth.
- Stock market volatility may rise: As credit conditions tighten, investor risk appetite tends to decline, leading to higher volatility in equity markets.
Listening to credit spreads, particularly the high-yield spread versus Treasuries, is a critical indicator of stock market downturns. Historically, they have been a reliable early warning signal of recessions and bear markets. With that in mind, what should investors be doing now?
What Investors Should Be Doing Right Now
None of this means selling everything and going to cash. It means adjusting your portfolio's risk profile to reflect the environment the data actually describes, not the one you're hoping for. The window to act on a leading indicator is before the equity market confirms what credit is already pricing. Here are seven concrete steps worth taking today.
- Rebalance to your target equity allocation. If a strong run in stocks has pushed your equity weighting above plan, trim back to target. This isn't market timing — it's disciplined risk management. Reducing exposure while prices are still elevated is always easier than doing it after a 15% drawdown forces your hand.
- Tighten stop-loss levels on existing positions. In a normal market environment, wider trailing stops give individual holdings room to work. When credit spreads are signaling stress, tighter controls mean smaller potential drawdowns if the signal proves correct. Review your stops and tighten them by 20-25% from current levels.
- Reduce exposure to the most leveraged sectors. Credit stress hits leveraged balance sheets first. That means lower-quality industrials, speculative-stage technology companies, and commercial real estate names with significant debt loads are the most vulnerable early in a credit-tightening cycle. Trim or exit overweight positions in these areas before the broader market reprices them.
- Raise cash selectively as positions hit targets or stops. You don't need to sell everything for cash all at once. As individual holdings reach price targets or trigger stop levels over the coming weeks, let the proceeds accumulate rather than redeploy them immediately. A 10 to 15% cash position is a buffer, not a bet — it gives you the flexibility to act when better opportunities emerge after volatility arrives.
- Shift fixed income exposure toward quality and shorter duration. When CDX spreads widen, high-yield bonds get hit from two directions: rising spreads and the flight-to-safety bid that compresses Treasury yields. Now is not the time to be reaching for yield in the bond portion of your portfolio. Move toward investment-grade and short-duration instruments that hold up better in risk-off environments.
- Review your portfolio's correlation in a stress scenario. Many investors believe they're diversified until a credit event hits and everything moves down together. Pull up a stress test and map how your current holdings performed in 2015 and 2022. If the model shows unacceptable drawdowns in a repeat of either episode, you know exactly where to focus your risk reduction efforts.
- Keep watching the CDX spread level — don't declare the all-clear prematurely. This signal requires monitoring, not a one-time response. If spreads continue widening from here, the risk posture should tighten further. If they reverse and compress back below nine-month highs over the coming weeks, the urgency eases. Set a weekly review cadence on credit spread data. The bond market will tell you when the risk is rising and when it's fading — but only if you're paying attention.
There is no guarantee this time ends the same way as 2008, 2015, or 2022. Markets can and do defy patterns. But a three-for-three track record on a clearly defined signal, in a market already carrying stretched valuations and thin risk premiums, is not something a responsible investor waves away. The credit market is raising its hand. It deserves an answer.
🖊️ From Lance’s Desk
This week's #MacroView blog digs into the "Dollar is dying" arguments and the case for the dollar's survival.
Also Posted This Week:
- Private Credit Stress: Will The Fed Backstop Exuberance Again? - RIA - by Michael Lebowitz
- Treasury Bond Yields Don't Lie: But Wars Don't Drive Them - RIA - by Lance Roberts
📹 Watch & Listen
We discuss the attack on the 200-DMA and what traders should be looking for next.
Subscribe To Our YouTube Channel To Get Notified Of All Our Videos
📊 Market Statistics & Analysis
Weekly technical overview across key sectors, risk indicators, and market internals

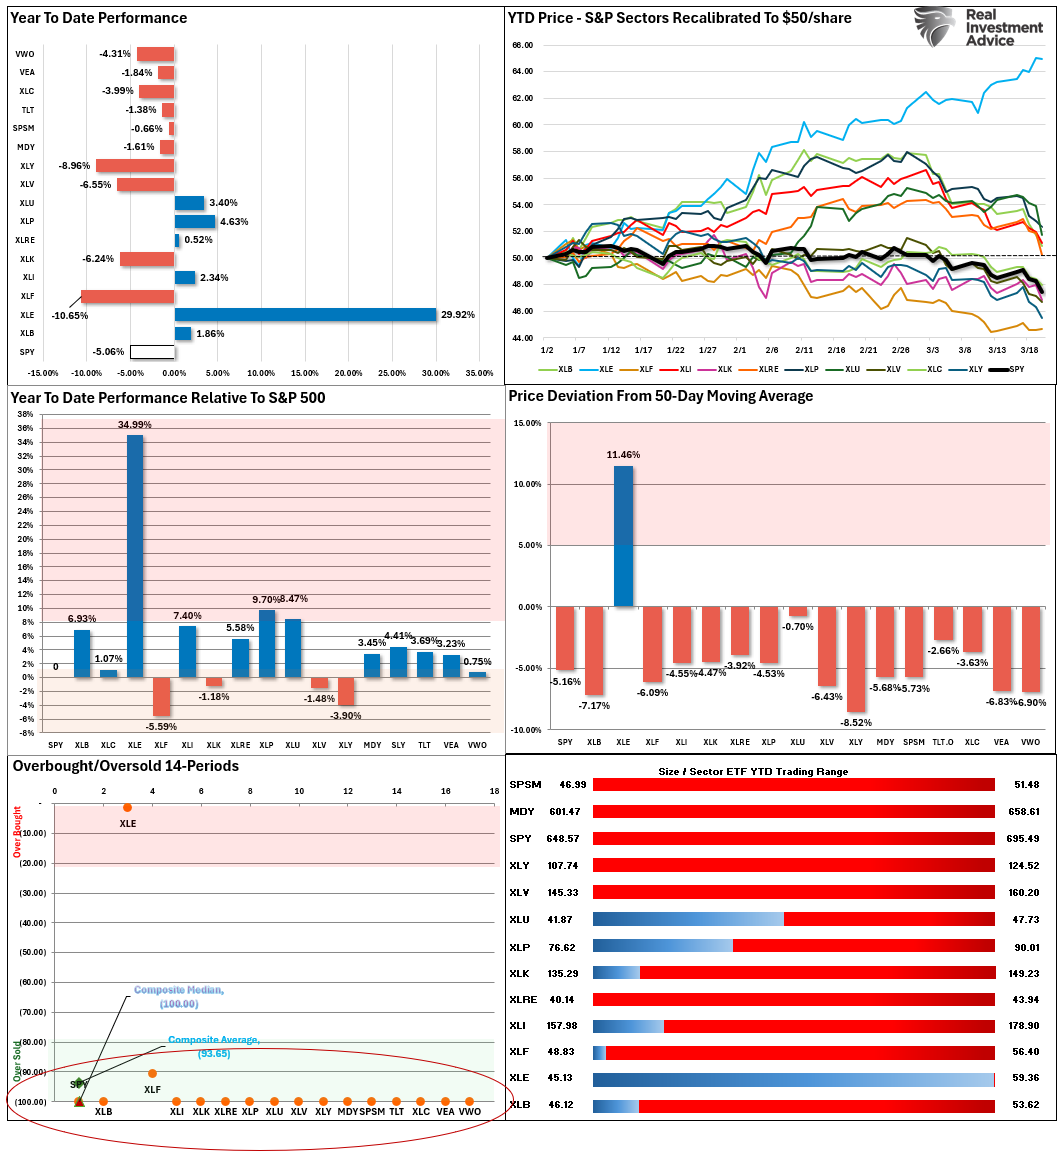
💸 Market & Sector X-Ray: Market Cracks Support
Last week's selling pressure pushed every market and sector, except for Energy, back into very oversold territory. The extreme bifurcation in Energy is going to reverse sharply when the conflict settles down, taking profits and rebalancing holdings accordingly. With every other sector extremely oversold, the logical setup now is for that rotation out of energy into other areas of the market to begin as soon as next week.
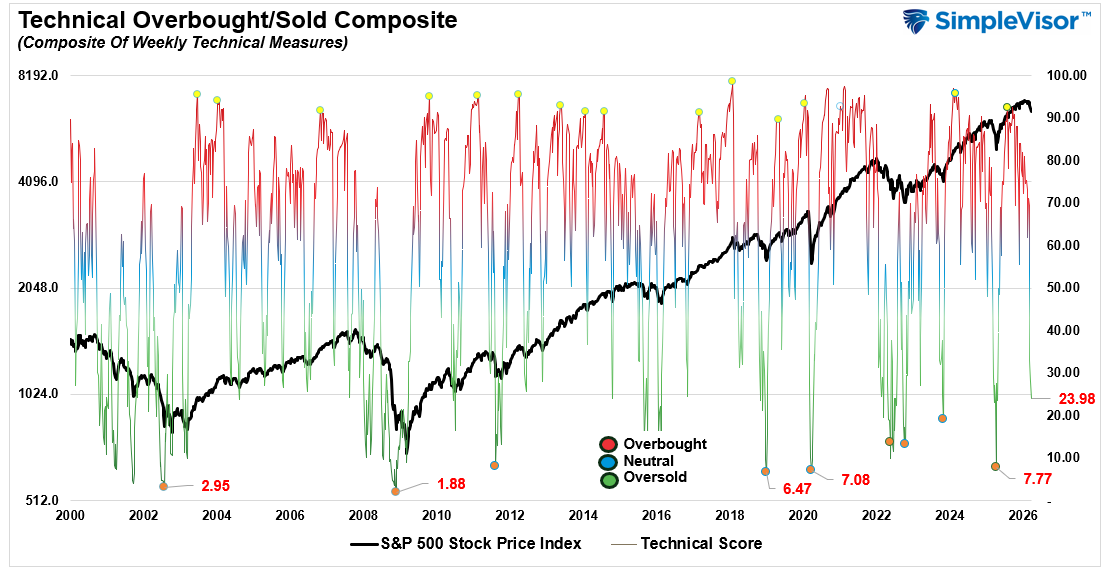
📐 Technical Composite: 23.98 – Market Very Oversold
The Iran conflict continues to weigh on risk appetite. Oil prices remain the key driver for the markets in the near term. As the market approaches oversold levels, the odds of a reflexive rally are increasing.
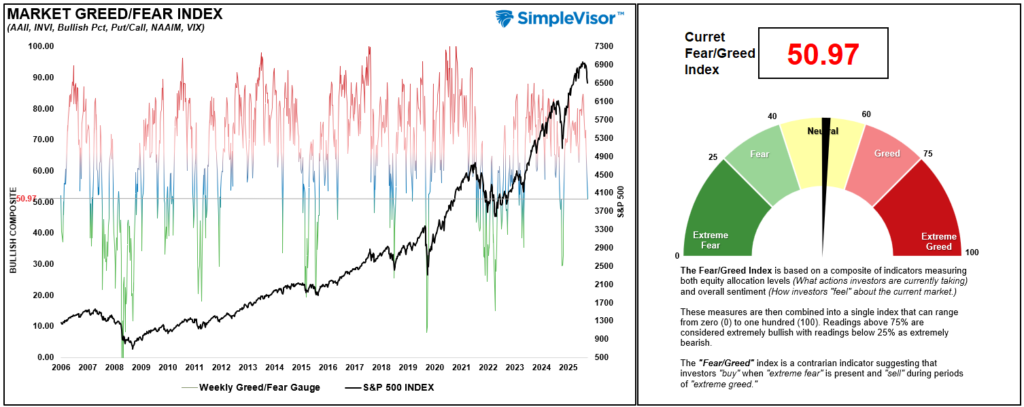
🤑 Fear/Greed Index: 50.97 – Sentiment Reverses Sharply
This past week, sentiment dropped sharply as expectations of global economic outperformance faded. The Iran conflict intensified, and energy prices remained elevated, pushing investors to become increasingly cautious last week. While not at "fear levels" yet, the selloff has been rather sharp, so a reflexive rally is likely before a further decline.
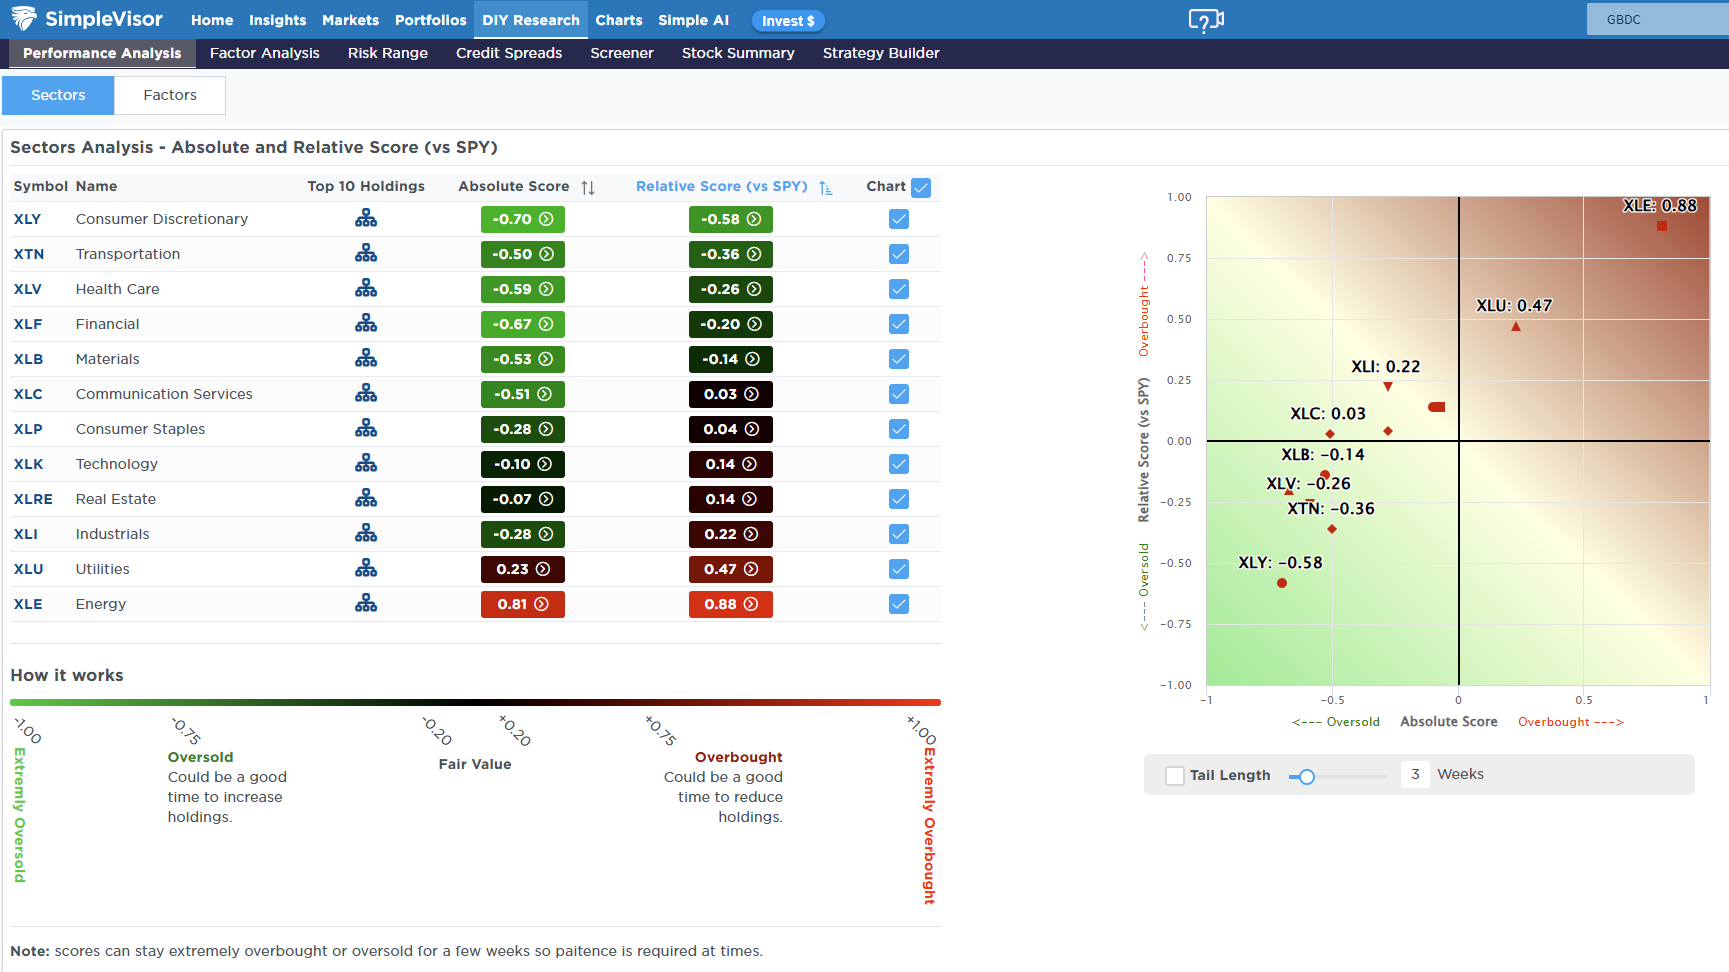
🔁 Relative Sector Performance
The market continued to correct this past week, as we discussed was a risk previously, and Discretionary stocks are now extremely oversold. Conversely, Energy is extremely overbought. Given the divergence between these two sectors, profit-taking in Energy seems prudent, and nibbling at really oversold areas of the market may be opportunistic.
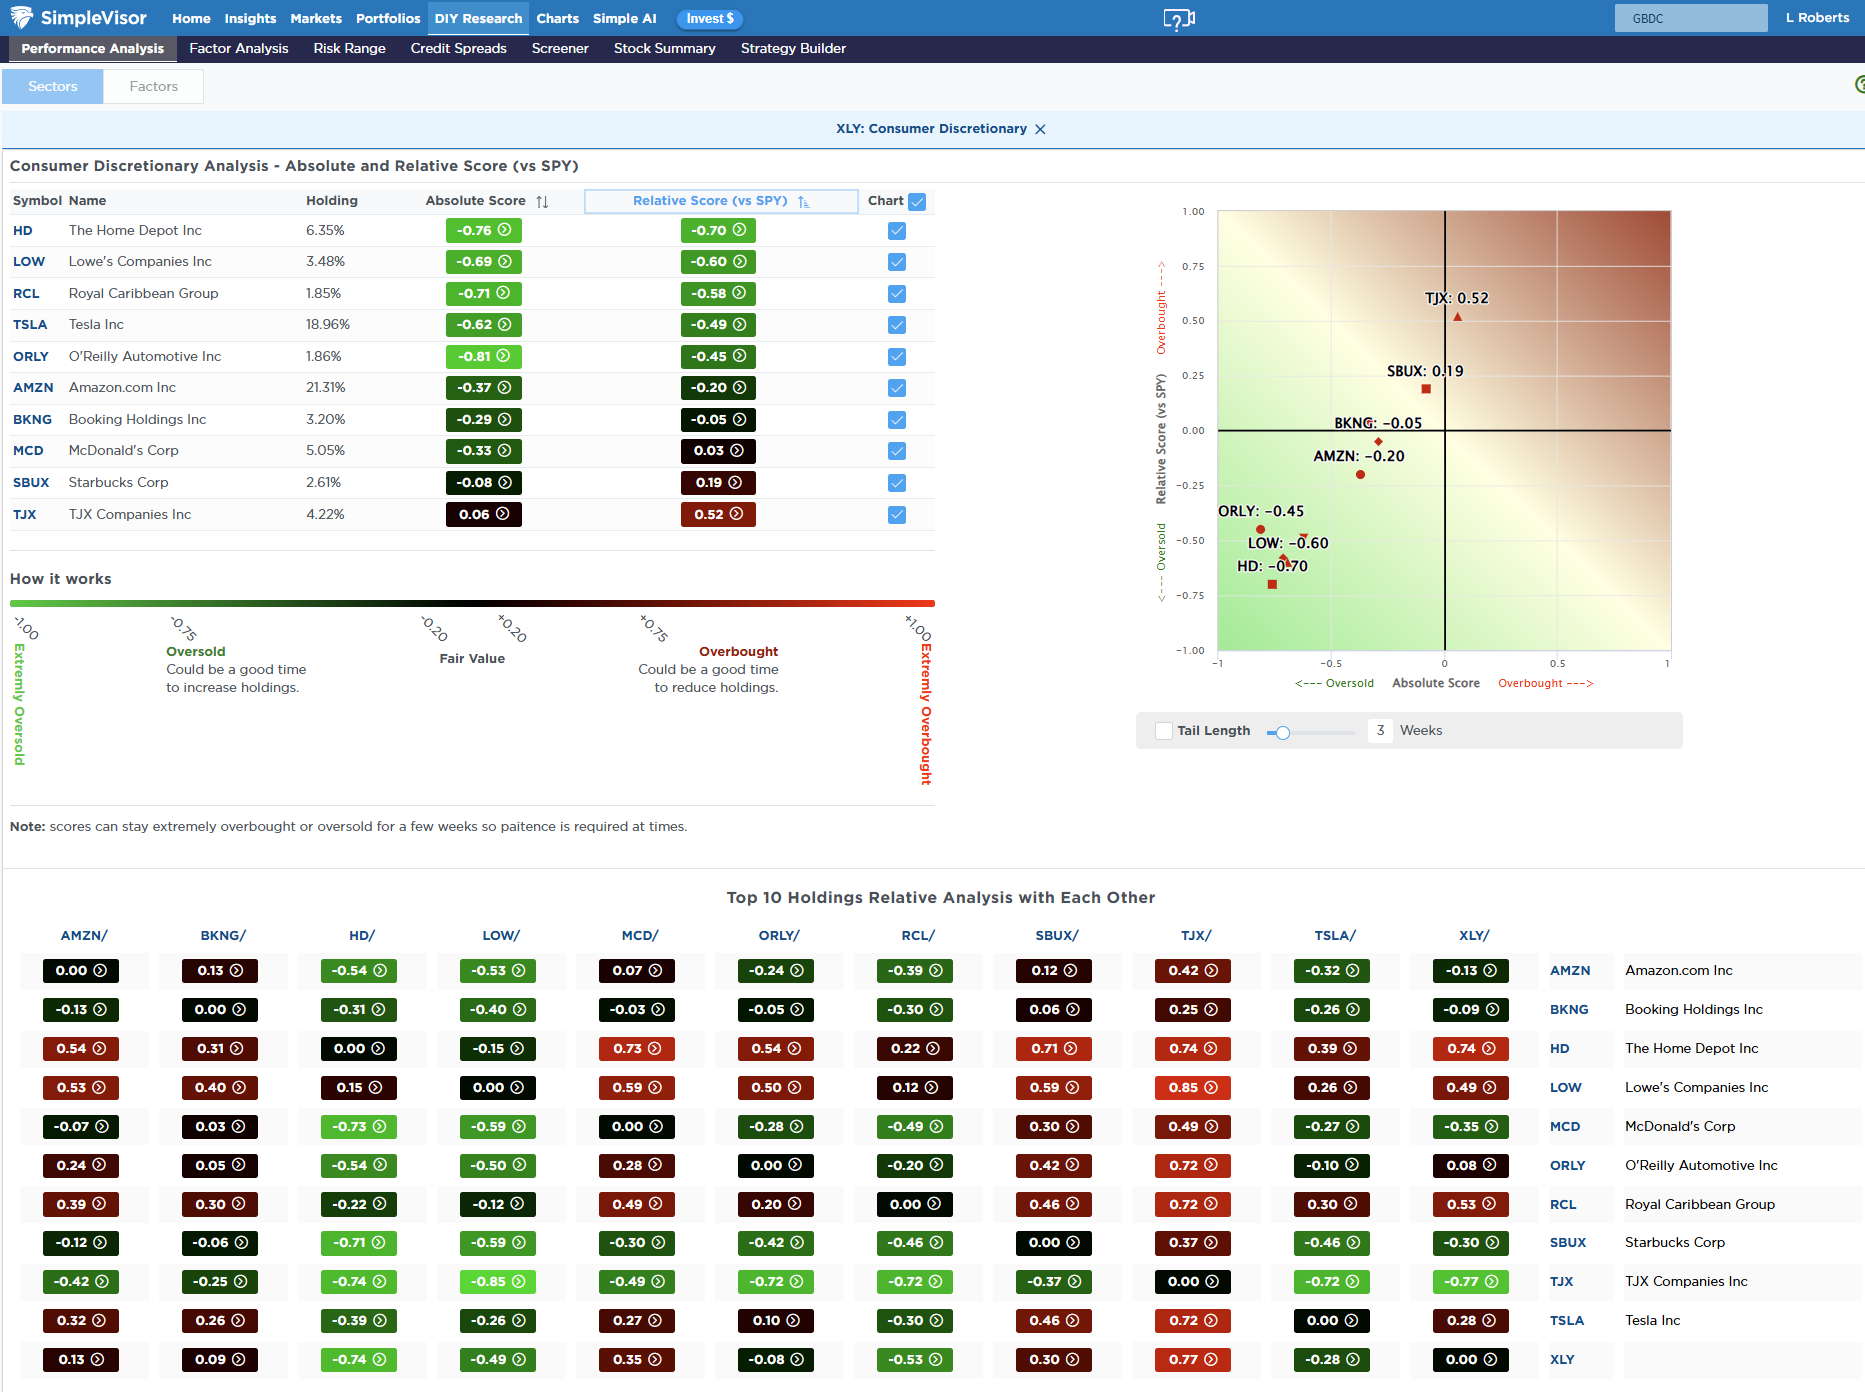
📊 Most Oversold Sector Holdings
As noted, the Discretionary sector is now the most oversold. HD, LOW, RCL, and TSLA have been hit the hardest as of late due to concerns about consumer spending and an economic slowdown driven by higher oil prices. While it may be early, these are the kinds of conditions that eventually make for a good entry point.
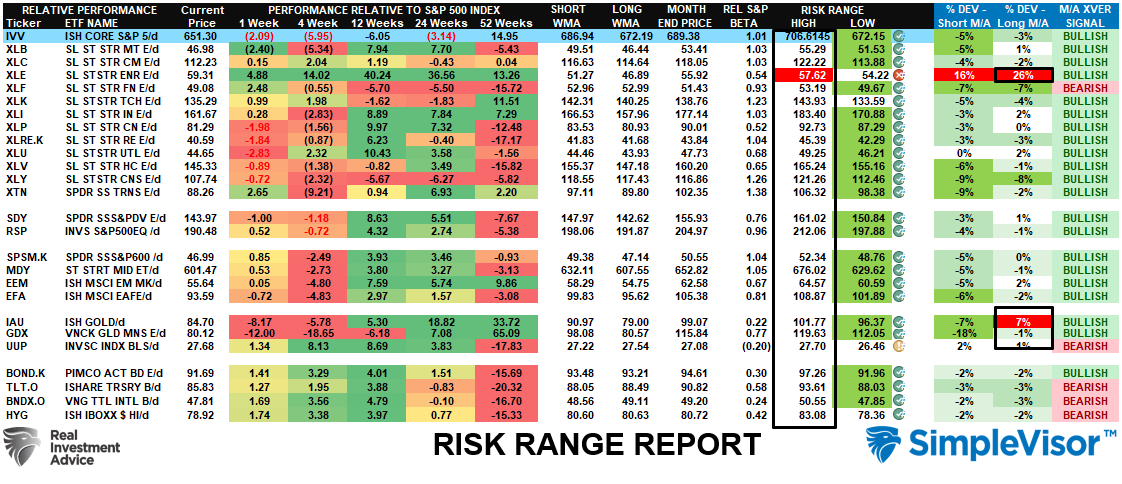
📊 Sector Model & Risk Ranges
Heading into the end of 2025, we repeatedly warned that the massive deviation in Gold and Gold Miners (historical extremes) would eventually reverse sharply. That reversal of those deviations is now mostly complete. This is why we recommend taking profits when those deviations exist. We now see the same deviation in Energy. Just as it was with Gold and Gold Miners, this extreme deviation will eventually reverse in a more painful manner. Take profits in Energy stocks and rebalance accordingly.
Have a great week.
Lance Roberts, CIO, RIA Advisors
The post CDX: Credit Spreads Are Flashing A Warning appeared first on RIA.
Full story here Are you the author?You Might Also Like
 Our Take On Tariffs
2026-02-24
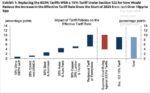
To address the many emails we received, we present our take on the Supreme Court’s tariff ruling. First, President Trump has multiple ways he can implement trade restrictions beyond what the Supreme Court ruled against. In fact, he implemented a 150-day 15% global tariff after the court’s ruling. As we share below, the effective tariff …
 YTD Returns Highlight a Narrow Market
2025-12-31
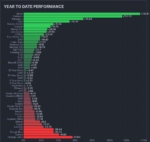
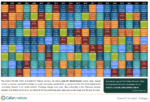
YTD returns across major U.S. asset classes continue to reflect a highly concentrated market. The Finviz chart below does a nice job illustrating YTD returns across a wide array of futures contracts. Large-caps dominate YTD equity returns, while small- and mid-cap stocks lag amid tighter financial conditions and slower earnings growth. Outside of equities, YTD …
 The ECB Changes Tone: Will The Fed Follow?
2025-12-23
Inflation in the European Union is nearing 2%, expected to dip below it in 2026 and 2027 and then settle at its 2% target thereafter. The ECB’s President Lagarde and other ECB members have recently stated that they are comfortable with the central bank’s current interest rate level. The markets are taking the ECB’s public …
2025-11-12
Here we go again. The overnight funding markets are showing signs of stress, and the scent of QE is in the air. Per New York Fed President John Williams: Based on recent sustained repo market pressures and other growing signs of reserves moving from abundant to ample, I expect that it will not be long …
2025-11-11
Buckle Up! With the end of the government shutdown and the return to work of government employees comes a flood of economic data. Below is a list of old economic data that should be released over the coming weeks: The list goes on. But, of more importance is whether or not the markets will care …
 Tariffs Are On The Docket: Will SCOTUS Upset The Market?
2025-11-05
The Supreme Court (SCOTUS) will begin hearing arguments challenging President Trump’s use of tariffs. Given the market volatility that tariffs have generated over the last six months, the SCOTUS case could prove to be yet another market-moving event. The tariff challengers argue that the administration overstepped its bounds under the 1977 International Emergency Economic Powers …
Tags: Featured,newsletter