Rather than focusing on valuation or fundamentals, momentum strategies use price behavior and relative performance to identify securities that are gaining or losing strength. One would think that, given the massive rotation trade and the resulting gaps in relative performance between various sectors and factors, momentum strategies would be doing well. While some such strategies are doing very well, others aren't. A flaw in some momentum strategies is that their signals can react slowly; they enter trends late in a rotation cycle, after much of the move has already occurred. Further compounding the problem, they may also exit only after losses have begun. These lags can cause investors to chase crowded trades near peaks and suffer reversals when market leadership rotates quickly.
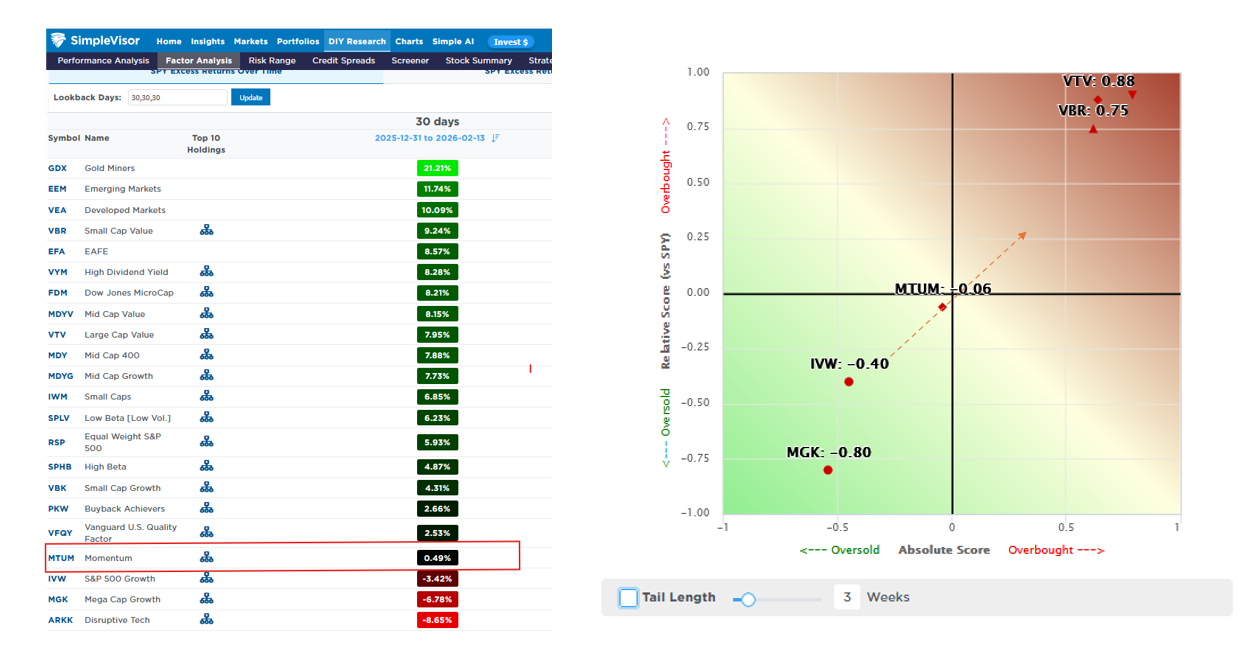
To illustrate the flaw in some momentum strategies, we share findings from SimpleVisor. SimpleVisor uses the iShares USA Momentum Factor ETF (MTUM) to assess the relative and absolute technical standing of momentum strategies.
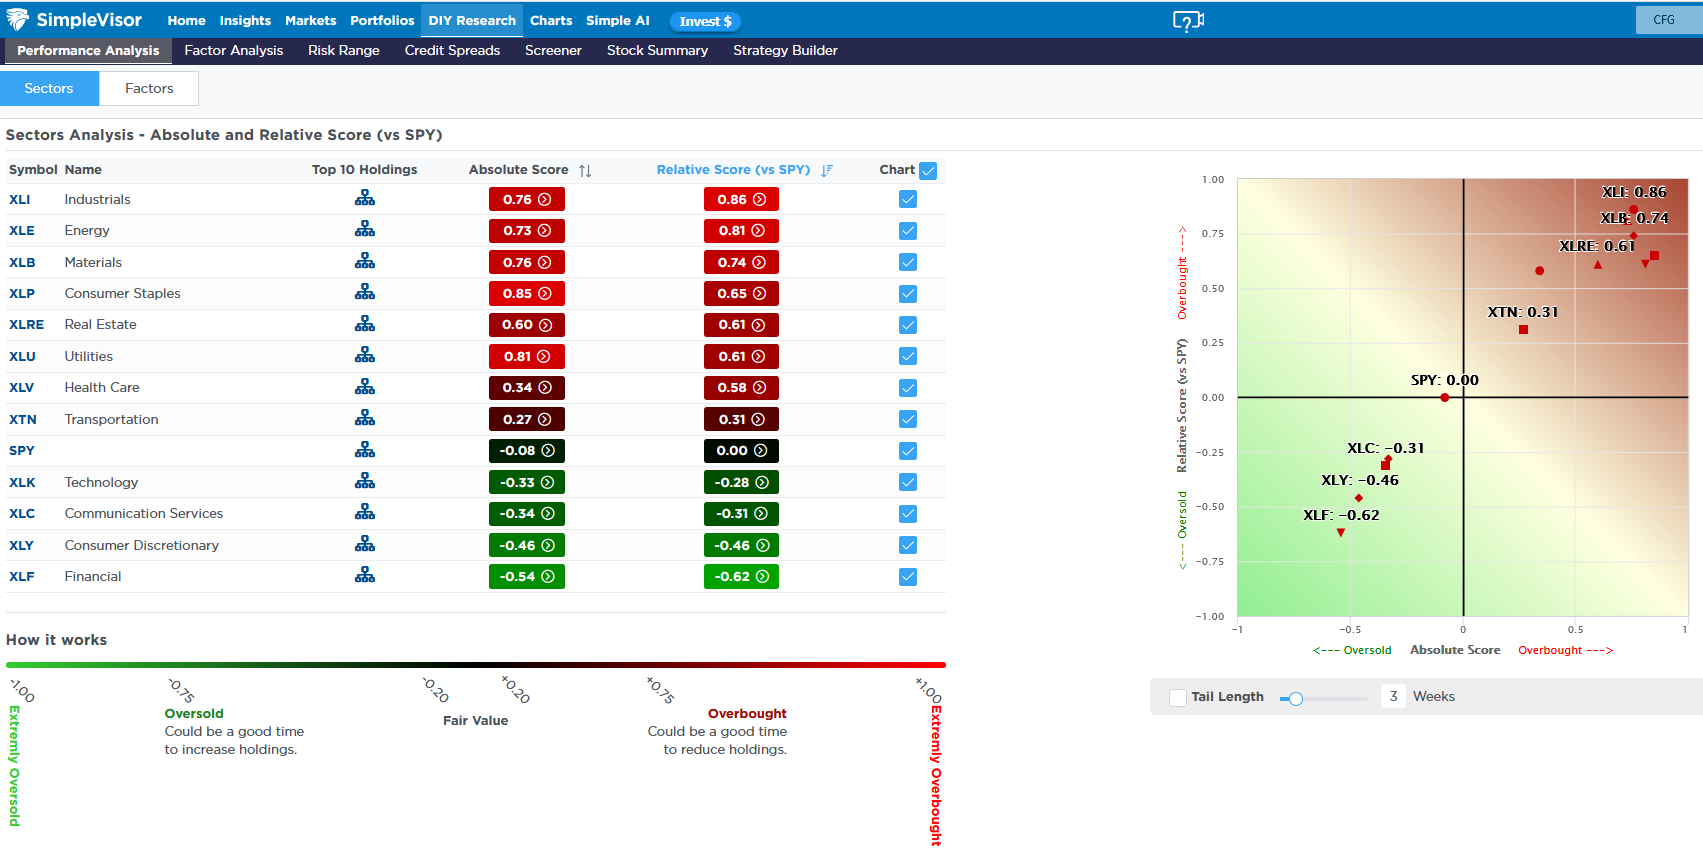
The left graphic shows the excess returns (relative to the S&P 500) of the factors over the last 30 trading days. Two-thirds of the factors have handily beaten the market, while large-cap growth stocks have lagged. The red rectangle shows that the MTUM ETF has kept pace with the market. The graphic on the right shows that MTUM is at fair value, while value is very overbought and growth is decently oversold. MTUM is slowly shifting from growth to value, but as we share, it's late to the game. Might it be shifting toward value and away from growth just as the market is about rotate back toward growth?
Momentum strategies work in long-lasting trending markets. But in markets with quick, pronounced rotations, or even in the early phase of a longer-lasting trend, they can be flawed, as we see.
What To Watch Today
Earnings

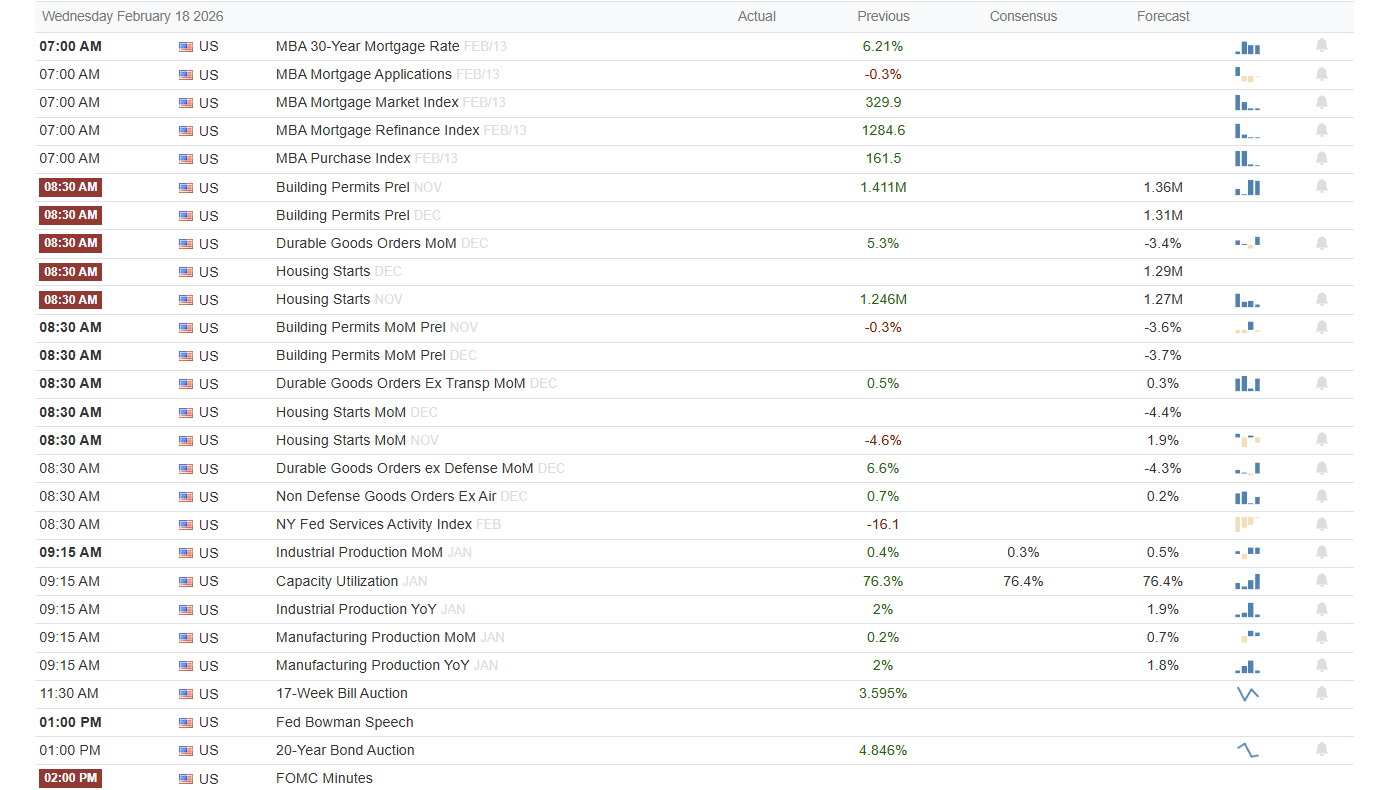
Economy
Market Trading Update
Yesterday, we reviewed the technical backdrop of the market. Also, yesterday, I published a sector-by-sector review of the S&P 500. As I noted, the bifurcation between sectors of the market is very stretched. To wit:
"As shown below, those market sectors make up a relatively small portion of the overall index: Basic Materials (1.93%), Industrials (8.26%), Energy (3.11%), and Staples (5.76%). In other words, those 4 sectors combined (~19%) are smaller than the Technology sector alone (~29%). This also suggests that the relative outperformance of those sectors in recent weeks has more than offset the weakness in the Technology sector."

"The breadth of those market sectors has also been extremely strong, with very high percentages of stocks in those sectors trading above their respective 50-, 100-, and 200-day moving averages, versus very low percentages in Communications, Technology, and Financials."

If you haven't read the article from yesterday, it is an interesting piece of analysis that clearly shows the market's current extreme conditions. However, in yesterday's analysis, I left out the Energy sector. As noted, Energy currently accounts for just 3.11% of the index, but 95% of its constituents are above their respective 50-, 100-, and 200-day moving averages. The following is the same analysis we did for the other sectors of the market.
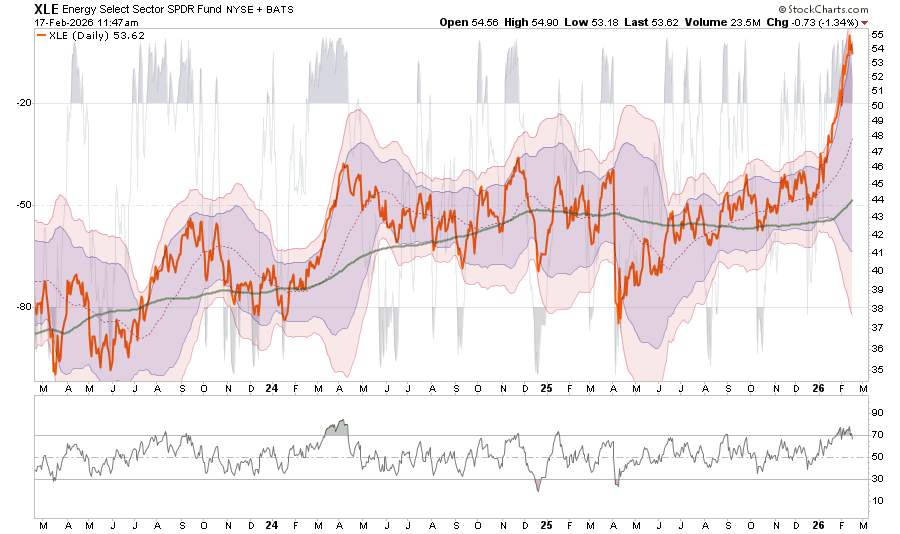
- Energy broke through previous resistance at 47 and is now 3 standard deviations above the moving average.
- Currently, the price is very deviated above the rising 200-day, and extension risk is high after a steep run into 54 to 55.
- With both longer-term readings at more extreme overbought levels as the risk of a correction is rising.
- Keep stops on trading positions at the 50-dma (48ish), which is now support. Critical support remains at 44, which is the 200-dma.
- Action plan: Trim into strength, raise stops to 48 or 49 for tactical positions. The longer-term trend stop is near 45-46. Avoid new buys until the 48-49 level holds.
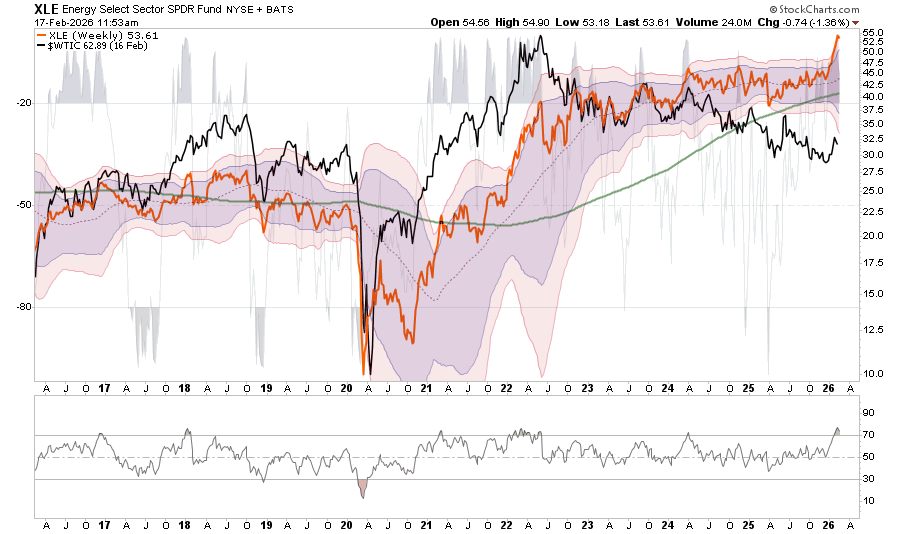
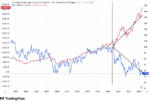
As we have noted previously, the rush into Energy stocks is not supported by the underlying fundamentals, which increases risk in the near future. As we have shown previously, the gap between Energy stock prices and the underlying oil price is key to watch. If oil prices don't catch up to the market, the market will eventually catch down to the source of Energy company revenues.
Trade accordingly.

Buy Reflation Sell Growth
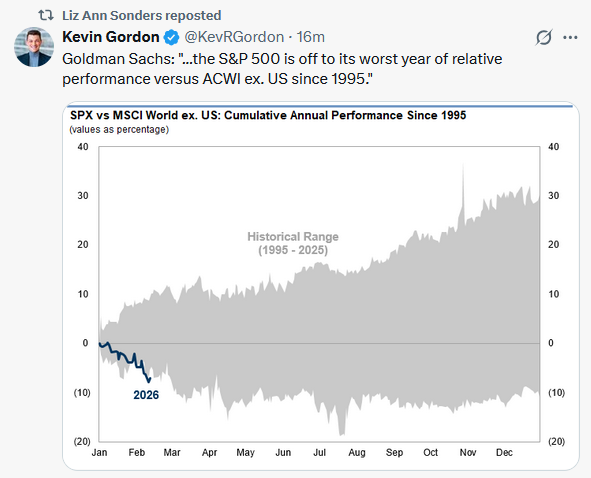
As we share below, the rotation toward economically sensitive sectors and toward value-oriented or conservative stocks, and away from technology and growth, has become severe. The bifurcation of returns is likely to normalize in the coming days or weeks. The question is what will get investors to change their behavior to allow for a more normal distribution of returns across sectors and factors.
We think there are two potential factors. First, the reflation trade fails to deliver. Last week's CPI was lower than expected, and other price indicators suggest lower price growth in the coming months. It's hard to believe the economy is taking off, yet inflation is falling. Moreover, excluding the recent BLS employment report, all other labor indicators point to continued weakness. Again, such doesn't jibe with a reflationary narrative.
Second is Nvidia. Their earnings report, a week from today, could rejuvenate the technology and growth bulls. They are likely to exceed earnings expectations and once again increase their growth forecasts. Given that many stocks in the sector, especially software companies, are trading poorly, a rotation back to growth from value may kick off with their earnings next Wednesday.
Bear in mind that while we expect a rotation toward growth, we are unsure whether it will be temporary or longer lasting. Our technical indicators and analysis will help us cross that bridge when the day comes.

Market Sector Review
Since the beginning of the year, we have discussed the “reflation trade” and its impact on specific market sectors. This past weekend’s newsletter also showed some of these more extreme returns in various market sectors since the beginning of the year. To wit:
“Despite what seemed like a rough week in the market, it really wasn’t as most sectors and markets, outside of technology, moved into very overbought territory on a short-term basis. Energy, Materials, Industrials, and Staples, or rather “value,” have strongly outperformed every other market and sector this year. These areas are the most overbought, and a rotation back to growth seems increasingly obvious.”
There are several key takeaways from the analysis below.
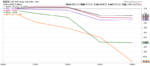
- Since the beginning of 2026, Staples (up 15%), Industrials (up 12%), Energy (up 21%), and Materials (up 17%) have vastly outperformed the market as a whole, which is effectively flat YTD.
- The performance differential of those sectors versus the markets, and the deviations from their 50-day moving averages, are at extremes.
- While the overall market has been trading weakly since January, that is only a function of the largest market sectors, by capitalization, underperforming and are now oversold.

As shown below, those market sectors make up a relatively small portion of the overall index: Basic Materials (1.93%), Industrials (8.26%), Energy (3.11%), and Staples (5.76%). In other words, those 4 sectors combined (~19%) are smaller than the Technology sector alone (~29%). This also suggests that the relative outperformance of those sectors in recent weeks has more than offset the weakness in the Technology sector.
Tweet of the Day
“Want to achieve better long-term success in managing your portfolio? Here are our 15-trading rules for managing market risks.”
Please subscribe to the daily commentary to receive these updates every morning before the opening bell.
If you found this blog useful, please send it to someone else, share it on social media, or contact us to set up a meeting.
The post Are Momentum Strategies Late To The Game? appeared first on RIA.
Full story here Are you the author?You Might Also Like
2026-01-20
Supporting the dollar-debasement narrative is the claim that money supply growth is out of control. For instance, we saw a post claiming “US money creation is happening at an alarming pace.” Specifically, he says the money supply increased by $1.65 trillion in 2025. Quoting the money supply, as he does, in absolute dollar terms is …
2026-01-09
Every January, it happens like clockwork: you drive by gym parking lots that look like a Taylor Swift concert. Go to the store, and the salad aisles are ransacked like there’s a lettuce shortage, and half of your coworkers suddenly start quoting Warren Buffett while buying stock in companies they can’t spell. You got it, …
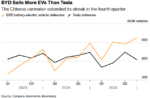 Tesla EV Deliveries Continue to Lag Global Rivals
2026-01-05
Tesla EV deliveries totaled 1.64 million vehicles in 2025, leaving the company behind China’s BYD, which delivered more than 2.2 million EVs for the year. The result marks a second consecutive annual decline in Tesla EV deliveries, reinforcing the growing pressure on the company’s core automotive business. Fourth-quarter deliveries fell sharply year over year, underscoring …
 Year-End Rally Begins
2025-11-29
🔎 At a Glance 💬 Ask a Question Have a question about the markets, your portfolio, or a topic you’d like us to cover in a future newsletter? 📩 Email: [email protected]🐦 Follow & DM on X: @LanceRoberts📰 Subscribe on Substack: @LanceRoberts We read every message and may feature your question in next week’s issue! 🏛️ …
 The K Shaped Economy In One Graph
2025-11-28
Tuesday’s weak Consumer Confidence report was a good reminder of why some economists are calling our economy the K shaped economy. The Conference Board Consumer Confidence Index fell 6.8 points to 88.7 in November, below expectations of 93. Moreover, it sits at levels similar to those of early 2020, when the pandemic shuttered the economy. …
 EBITDA And The Warnings Of Charlie Munger
2025-11-15
🔎 At a Glance 💬 Ask a Question Have a question about the markets, your portfolio, or a topic you’d like us to cover in a future newsletter? 📩 Email: [email protected]🐦 Follow & DM on X: @LanceRoberts📰 Subscribe on Substack: @LanceRoberts We read every message and may feature your question in next week’s issue! 🏛️ …
Tags: Featured,newsletter