Lance Roberts
My articles My offerMy siteAbout meMy videosMy books
Follow on:TwitterSeeking AlphaFacebookAmazon
🔎 At a Glance
- Marketing Topping Process? Yes or No.
- Market Brief & Technical Review
- From Lance's Desk: Money: The 10 Immutable Laws Of Building Wealth
- Market stats, screens, and risk indicators
Give Us A Review *****
If you enjoy our work each week, could you be so kind as to leave us a review? It would be most appreciated.
🏛️ Market Brief - Turmoil In AI Stocks
As we will discuss further in today's commentary, the market remains stuck in a fairly narrow trading range. The week opened with a broad selloff after Anthropic's expanded AI capabilities rattled software, cybersecurity, and financial stocks, with IBM suffering its worst session since 2000. CrowdStrike and Zscaler also dropped about 10% on the news. The financials sector fell more than 3% as American Express, Goldman Sachs, and Blackstone came under pressure on fears that AI could automate large portions of their businesses. A widely circulated Citrini Research piece warning of 10% AI-driven unemployment gave bears a macro narrative.
Yet the "AI kills everything" narrative ignores what the data actually shows: companies are integrating AI, not dying from it. McKinsey's 2025 State of AI survey found 88% of firms already use AI in at least one business function, up from 78% a year prior, while by Q1 2026, that figure reached 78% of U.S. corporations scaling AI enterprise-wide, according to Netguru. Salesforce's Q4 2026 earnings showed over 22,000 Agentforce deals closed in the quarter, with combined AI and Data Cloud ARR surging to $1.8 billion from $1.4 billion just three months earlier, proving enterprise buyers are choosing to buy AI tools from incumbents rather than be replaced by them.
Deloitte's 2026 State of AI in the Enterprise report found that two-thirds of organizations already report productivity and efficiency gains, while a Harvard study showed that consultants using AI completed tasks 25% faster and at 40% higher quality, augmentation, not elimination. Goldman Sachs Research estimates AI-driven productivity could lift global GDP by 7% (roughly $7 trillion) and sees the next phase of the AI trade rotating precisely toward "productivity beneficiaries," the non-tech companies that harness AI to widen margins.
Meanwhile, LPL Research notes that BLS data already shows real output rising 5.4% while hours worked grew just 0.5%, and that only 5.7% of U.S. job hours currently involve generative AI, meaning the largest productivity gains are still ahead, not behind us.
The crucial point to consider is that the IBM selloff and SaaS panic of this year may ultimately look less like the beginning of a displacement cycle and more like the kind of reflexive fear that preceded every prior wave of technological adoption. We have seen this same cycle, from ATMs (which reduced bank teller employment) to cloud computing (which expanded, not destroyed, enterprise software). Notably, the companies that adapt capture outsized value, and the ones that don't were already failing for other reasons.
The main event came on Wednesday after the close. Nvidia reported fiscal Q4 revenue of $68.1 billion, beating the $65.9 billion consensus by 3.3%. Notably, it guided Q1 to $78 billion, well above the $72.8 billion estimate. Data center revenue totaled $62.3 billion, up 75% year over year. However, the stock still fell 5% on Thursday as investors flagged a lack of detail on lingering China uncertainty. However, Nvidia currently trades at a deep discount to the broad market index. While the S&P trades near 22x earnings, Nvidia's forward PE is 17x with a 0.45 price-to-earnings-growth ratio. With EPS expected to grow by 39.2% over the next 5 years, the fundamentals are compelling. By focusing on a possible future event that may or may not occur, they may miss a fundamentally strong company trading at a discount.
The big risk worth watching is that tariff policy remains in legal limbo after the SCOTUS ruling. The AI disruption narrative is broadening beyond software into financials and logistics. And the extreme rotation into Energy, Materials, and Industrials (up 21%, 17% and 12% respectively) has left positioning dangerously one-sided against Technology.
Resilience is not the same as safety.
Which brings us to the market.
📈Technical Backdrop - Technology Gets Tripped Up
The S&P 500 closed Friday at 6,878, marking a second consecutive down session. From a pure trend perspective, the market remains in a bullish primary uptrend. But it is clearly struggling within the February consolidation range. The index sits below both its 20-DMA (~6,896) and 50-DMA (~6,899), which have crossed. That bearish crossover acts as overhead resistance rather than support. Every rally attempt in February has stalled in the 6,950–7,000 zone, while every pullback has found buyers near the 100-DMA and the lower consolidation range around 6,831.

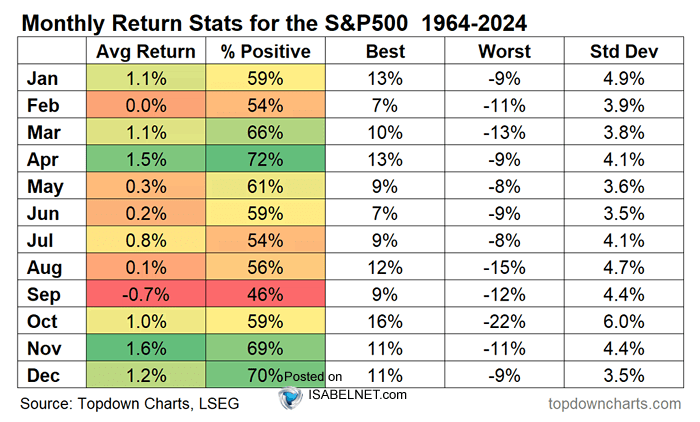
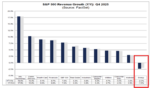
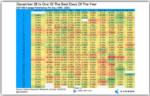
Heading into March, seasonal data provides a positive tailwind. Since 1964, the S&P 500 has posted an average price return of approximately +1.1% during March. That makes it one of the better-performing calendar months. March also falls within the traditionally favorable “best six months” window (November through April). Historically, this period outperformed the May–October stretch.
However, there is a critical asterisk: 2026 is a midterm election year. Midterm years carry a well-documented pattern of elevated volatility and muted returns during the first half of the calendar year. According to Motley Fool, the S&P 500 has returned an average of just +1% during midterm election years. It has also historically suffered an average intra-year drawdown of roughly 18%. When a new president takes office, as is the case now, the average midterm-year return drops to approximately ~7%.
In the overall market, momentum indicators are deteriorating on the short-term time frame. However, they remain supportive on an intermediate- to long-term basis. The 14-day RSI stands at approximately 48. That is firmly in neutral territory, and well off the highs when the index was testing 7,000. The RSI is not yet oversold (below 30), which means the index has room to drift lower. Notably, the market is flirting with the bottom of its recent consolidation range and the 100-day moving average, where a break lower could draw more selling.
Bottom line: The bull trend is intact, but the “easy money” phase appears mature. The intermediate-to-long-term structure remains constructive. The 200-DMA is rising, breadth is near record levels, and the rotation trade is broadening participation. However, short-term momentum has deteriorated notably. The index is below both its 20- and 50-DMAs, the MACD has crossed bearishly, and the RSI is declining. Layer in the midterm election year seasonal headwinds, hotter-than-expected inflation, and Iran-related geopolitical risk, and the path of least resistance in early March tilts toward further consolidation or a modest pullback before the seasonal tailwinds attempt to reassert themselves. I suspect we will get a better entry point for a rally as we move into March. However, use that opportunity to rebalance oversized winners, define risk levels, and avoid chasing strength. Don’t fight the trend, but protect gains if volatility inevitably returns.
| Level Type | Price Zone | Technical Significance |
| Immediate Resistance | 6,950 – 7,000 | Psychological round-number resistance. Repeated failures in this range during the February consolidation. |
| Secondary Resistance | 7,100 – 7,206 | First extension target above the range; aligns with BofA’s technical objective. |
| Initial Resistance | 6,896 – 6,900 | 50-DMA (~6,899) and 20-DMA (~6,896). Must reclaim these to reassert short-term bullish control. |
| Intermediate Support | 6,750 – 6,800 | Bottom of the consolidation range. BofA primary trendline support at 6,750. |
| Major Support | 6,550 | 200-DMA. A breakdown to this level would signal a more meaningful trend deterioration. |
🔑 Key Catalysts Next Week
Traders face a packed week of macro data and heavyweight earnings beginning Monday, March 2nd. On the macro side, the week is bookended by two critical reads on the economy. ISM Manufacturing PMI lands Monday morning, after January's surprise jump to 52.6 (the first expansion in 12 months), markets will scrutinize whether that rebound was genuine or simply a post-holiday reorder effect distorted by tariff front-running. A print below 50 would revive contraction fears and likely pressure cyclicals and small caps; a firm reading above 52 would reinforce the reflation narrative that has lifted Energy, Materials, and Industrials.
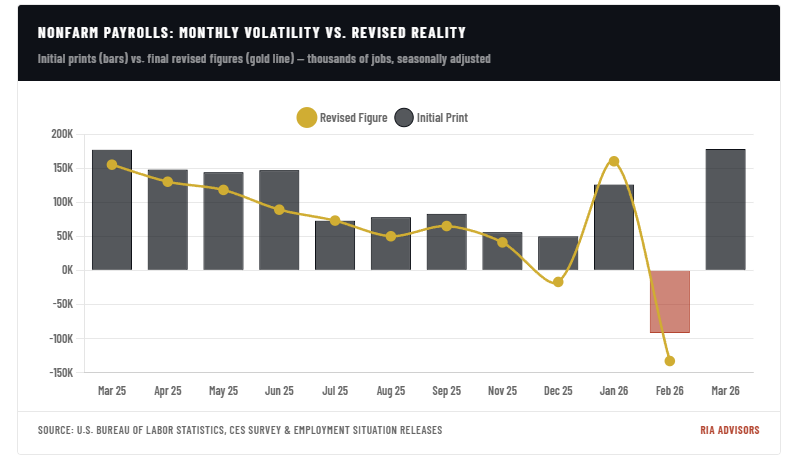
Wednesday is the ADP Employment Report and ISM Services PMI. Services never entered contraction, and ADP has shown a recovery in employment as of late. Then on Friday, the February Employment Situation (Nonfarm Payrolls) caps the week and will set the tone heading into mid-March. The key number will be the wage growth component; if average hourly earnings accelerate, it could push out rate-cut expectations and weigh on rate-sensitive sectors.
Earnings will also move the market next week: CrowdStrike (CRWD) reports after the close on Tuesday — the cybersecurity bellwether will offer a key read on enterprise security spend and the penetration of its Falcon Flex model. The market has priced in roughly a ±10% earnings move, so guidance will be the real catalyst. On Wednesday, Broadcom (AVGO) reports its fiscal Q1 2026 results with consensus revenue estimates near $19.2 billion.
Focus will be squarely on AI semiconductor revenue (guided to $8.2B for the quarter), custom ASIC demand from hyperscalers, and infrastructure software margins. Given the recent selloff in semis, a strong guide-up could reignite the AI trade. Thursday is Costco (COST) and Marvell Technology (MRVL), both reporting after the bell. Costco's comparable sales trends and membership fee income will set the tone for the consumer, while Marvell's data center revenue trajectory and Celestial AI integration update will add another data point to the AI infrastructure narrative.

Need Help With Your Investing Strategy?
Are you looking for comprehensive financial, insurance, and estate planning services? Need a risk-managed portfolio management strategy to grow and protect your savings? Whatever your needs are, we are here to help.

💰 Market Topping Process? Yes or No.
The question facing equity investors in early 2026 is deceptively simple: Is the stock market topping? This was a topic we touched on in Wednesday's #DailyMarketCommentary:
"Technically, the market looks weak, as shown in the chart below. Momentum continues to fade along with Relative Strength. Furthermore, the market has been making lower highs as of late and is threatening to break important support at the 100-day moving average."

Greg Feirman also touched on this concern, noting:
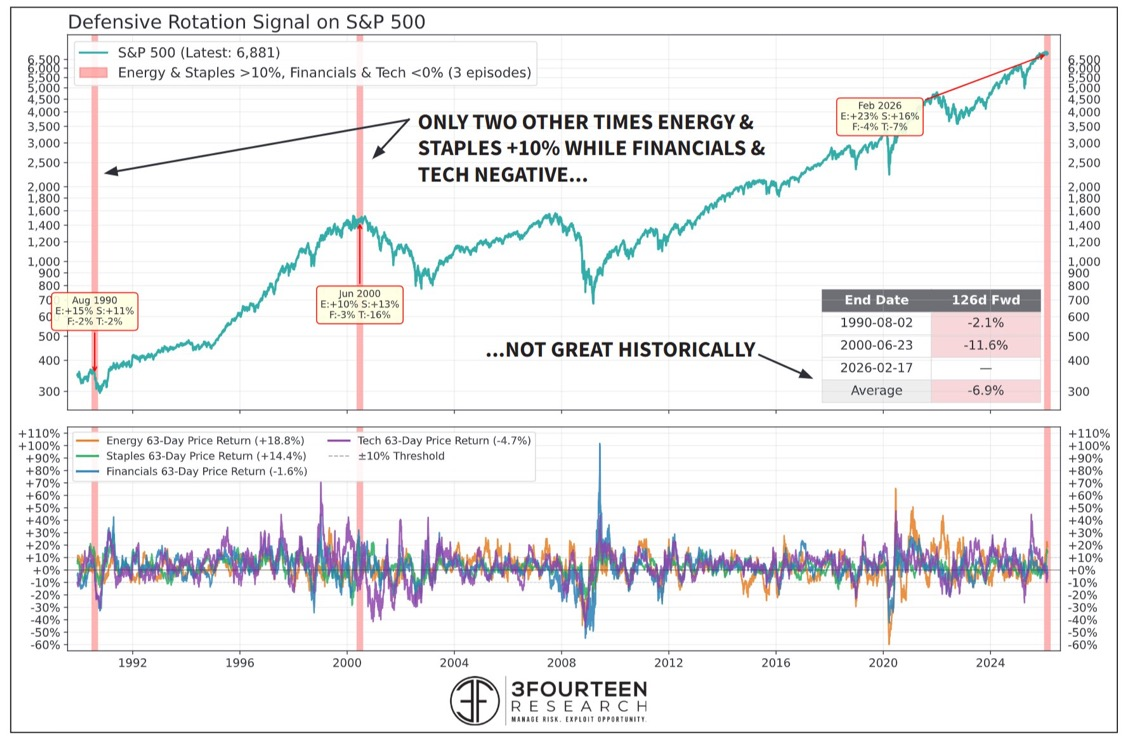
“While the S&P is only about 2% off its all-time highs, beneath the surface the market is showing signs of a top. Warren Pies tweeted today that there have been only two other times when Consumer Staples and Energy were up more than 10% and Technology and Financials were negative over the previous 63 trading days: 1990 (Desert Storm) and 2000 – both of which were market tops. Health Care – another defensive sector – has also been outperforming the S&P of late.”
Another warning came from the recent triggering of a "Hindenburg Omen." The last time we discussed this warning was in early November:
Bottom line: market breadth is horrendous and will likely lead to a rotation favoring out-of-favor sectors and stocks. Thus, it’s not surprising that the Hindenburg Omen was triggered. If we continue to see more of these Omens, the threat of a drawdown grows.
At the time, Mega-Cap stocks were grossly outperforming the market, while many sectors lagged the market. Since that Hindenburg Alarm, our expectations have come to fruition. We have, in fact, seen a “rotation favoring out-of-favor sectors and stocks.” Over the last month, the Hindenburg Omen has sent 6 alarms. The last batch of Hindenburg alarms signaled drawdowns in the leaders and strong performance in the laggards.
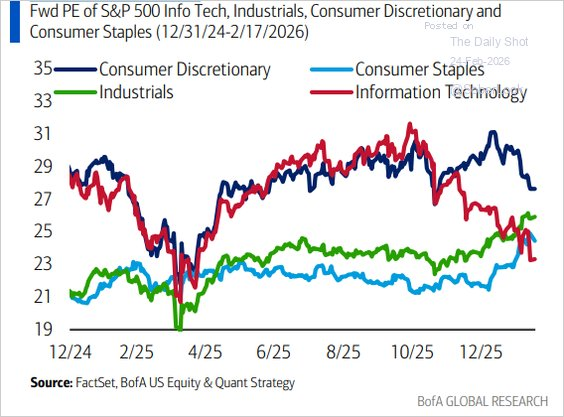
Lastly, as discussed over the last few weeks, the problem with the potential market-topping process is the divergence between the defensive names, which are extremely overbought, and the growth names, which are extremely oversold. However, those growth names are where the earnings and revenue growth reside. With that in mind, the next rotation could be from defensive names back to growth names, which are now trading at significantly lower forward PEs. Such a rotation would be exactly what often happens, as no one currently expects it.
If it isn't a market top, then is the recent rotation out of growth and into defensive sectors merely the kind of healthy digestion that precedes a further leg higher?
These are the questions we will dig into today.
The Case for a Top: What the Bears See
The S&P 500 has spent recent weeks grinding in a range that has tested the patience of both bulls and bears. More notable than the index’s headline price action has been the dramatic shift beneath the surface: utilities, healthcare, and consumer staples have led the tape, while the mega-cap technology stocks that powered the bulk of the post-2022 rally have stalled or retreated. The Nasdaq 100’s underperformance relative to the equal-weight S&P 500 has reached levels not seen since the first quarter of 2022, a period that, it bears noting, preceded a punishing bear market leg.

For market technicians, the pattern is uncomfortably familiar. Market-topping processes throughout history, from 2000 to 2007 to 2021, have been preceded by precisely this kind of internal deterioration: narrowing leadership, defensive outperformance, and a growing divergence between price-weighted and breadth-based indicators. The question is whether history is rhyming again, or whether the analogy is misleading.
The most compelling argument that equities are in a market-topping process begins with the market’s internal structure. When investors rotate aggressively into utilities, staples, and healthcare sectors prized for their dividend yields and earnings stability rather than their growth prospects, it is typically a signal that institutional capital is seeking shelter. Money doesn’t move into Procter & Gamble and Duke Energy because portfolio managers are feeling adventurous. It moves there because they are seeking relative safety.
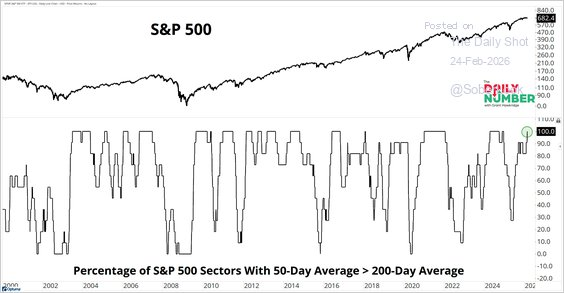
The breadth picture reinforces this concern. The percentage of S&P 500 constituents trading above their 200-day moving average has been declining even as the index itself has held near its highs, a classic negative divergence. We also see the same negative divergence in the market's relative strength measures. In past market-topping processes, such divergences have preceded meaningful corrections by 2 to 6 months.

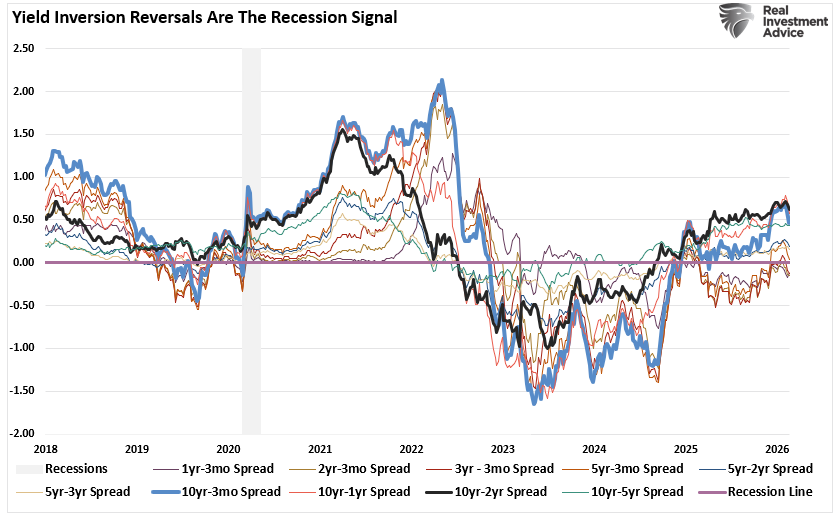
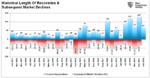
Then there is the yield curve. After a prolonged inversion that began in 2022, the curve’s re-steepening in late 2024 and into 2025 prompted some relief among investors who viewed the normalization as a sign the recession everyone feared had been avoided. But historically, the most dangerous period for equities is not during the inversion itself; it is in the 12 to 18 months after the curve un-inverts. The logic is straightforward: the curve steepens because the Fed is cutting rates in response to slowing growth, and the lagged effects of prior tightening are still working through the economy. By the time the damage becomes visible in earnings, the market-topping process has likely been completed.
Lastly, credit markets, while not yet flashing red, are showing early signs of strain. Investment-grade and high-yield spreads have widened modestly from their tightest levels, and dispersion within the high-yield market, particularly in private credit, has increased. Historically, credit leads equities, and the subtle deterioration in risk appetite in fixed income is difficult for equity bulls to dismiss entirely.

But let's also discuss the bull case.
The Case for a Base: What the Bulls See
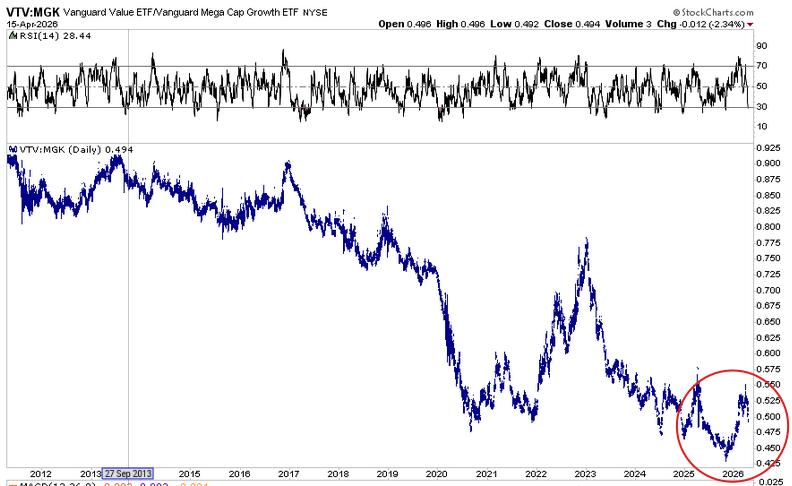
The bull case is not built on dismissing the rotation into defensives but on reframing it. Proponents of the view that the market is building a base, rather than a market-topping process, and point out that leadership transitions within a bull market are not inherently bearish. In fact, some of the healthiest and most durable advances in market history have been accompanied by exactly the kind of broadening and rotation currently underway.
Consider the precedent of 2016. After a narrow, FANG-led rally in 2015, the market experienced a gut-wrenching correction in early 2016 driven by growth fears and an oil price collapse. What followed was not a bear market but a powerful rotation: value outperformed growth, small caps outperformed large caps, and the equal-weight index began to lead. As shown, that outperformance remained intact for nearly 36 months before it failed.

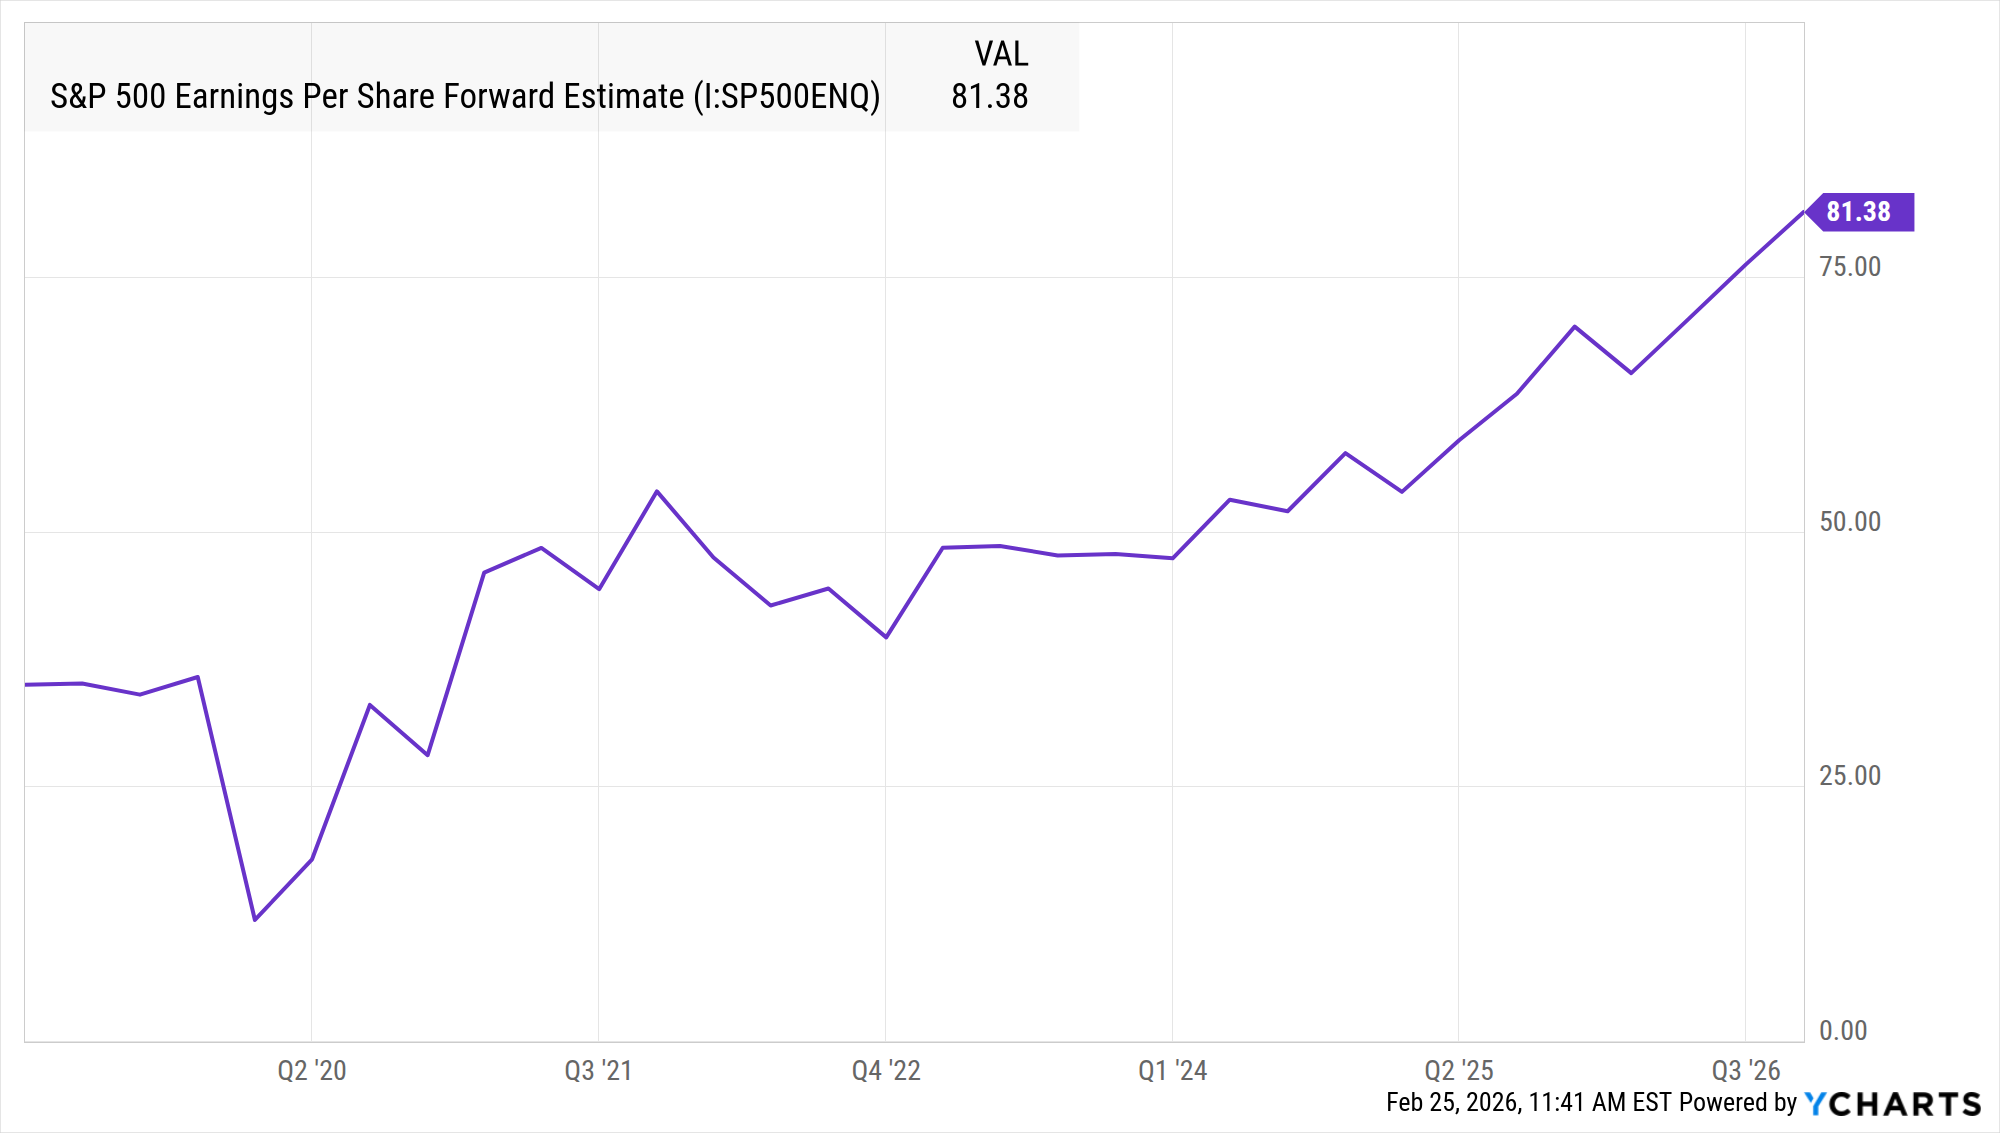
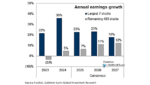
The key distinction, then, is between rotation that signals deterioration and rotation that signals broadening. The former typically occurs alongside falling earnings estimates and rising unemployment claims. The latter occurs when the economy is resilient enough to support a wider set of winners. On this score, the fundamental backdrop remains constructive. Aggregate S&P 500 earnings estimates for the forward twelve months have continued to grind higher, not lower, which is a crucial differentiator from the pre-recession environments of 2000 and 2007, when estimates were rolling over well before the index peaked.
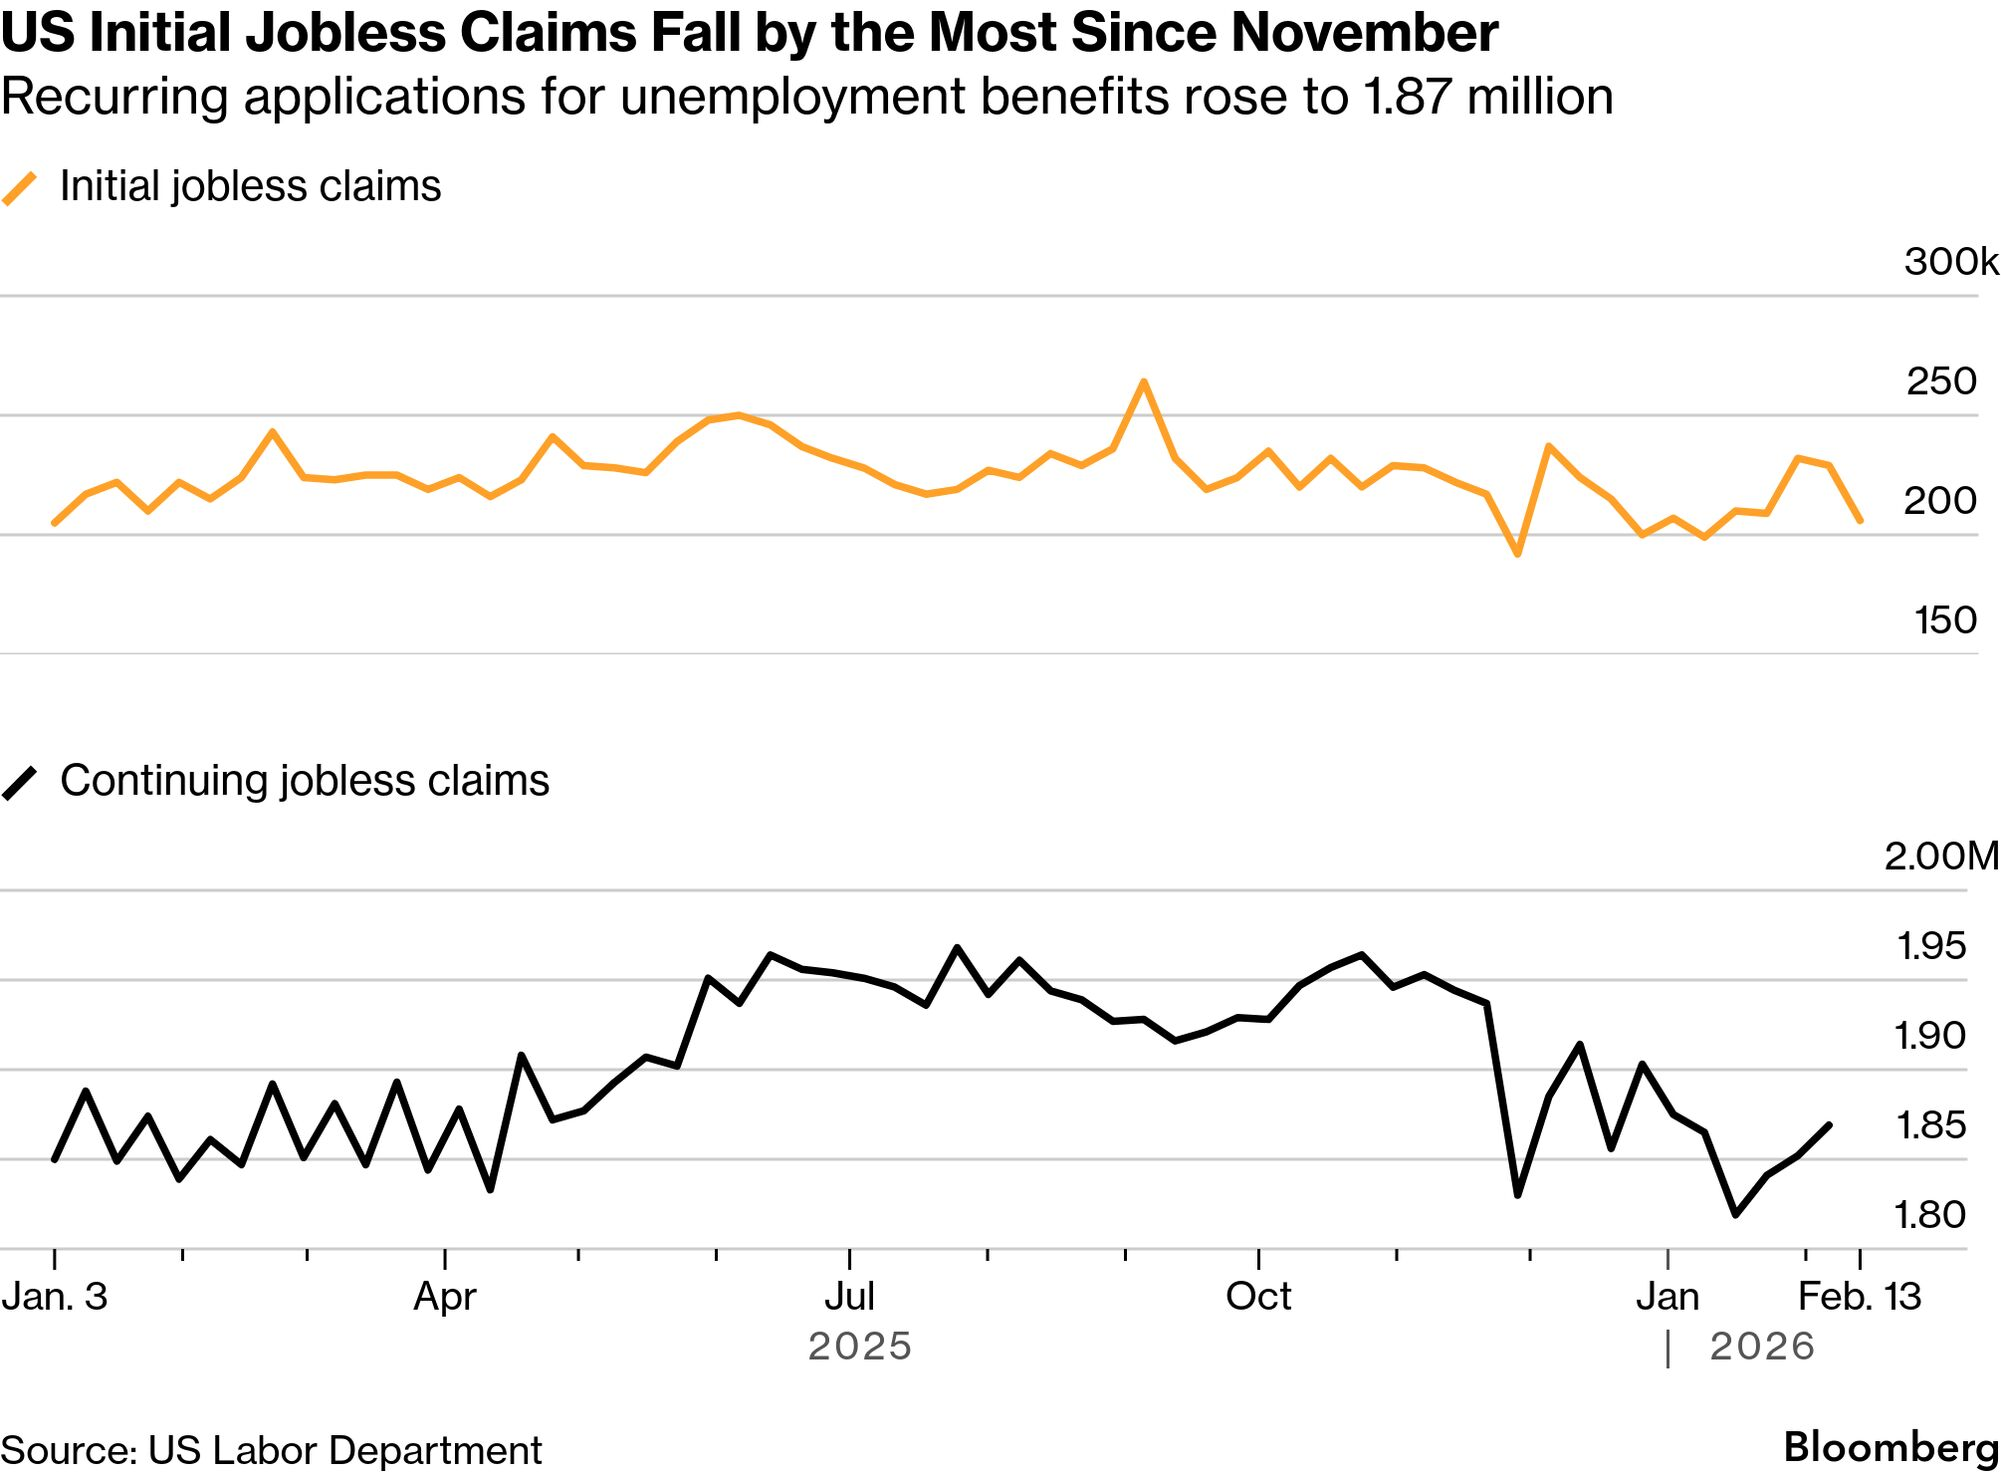
The labor market, while cooling from its post-pandemic tightness, has avoided the kind of abrupt deterioration that typically precedes a recession. Initial jobless claims, perhaps the single most reliable real-time indicator of labor market health, have remained contained.
Monetary policy also supports the bullish interpretation. The Federal Reserve’s pivot toward accommodation, whether through actual rate reductions or a clear willingness to ease if conditions warrant, provides an important backstop. Historical analysis from Ned Davis Research shows that when the Fed eases into an environment of positive earnings growth, the S&P 500 has posted gains in more than 80% of the subsequent 12-month periods. The combination of falling rates and rising earnings is, statistically, one of the most favorable macro regimes for equities.
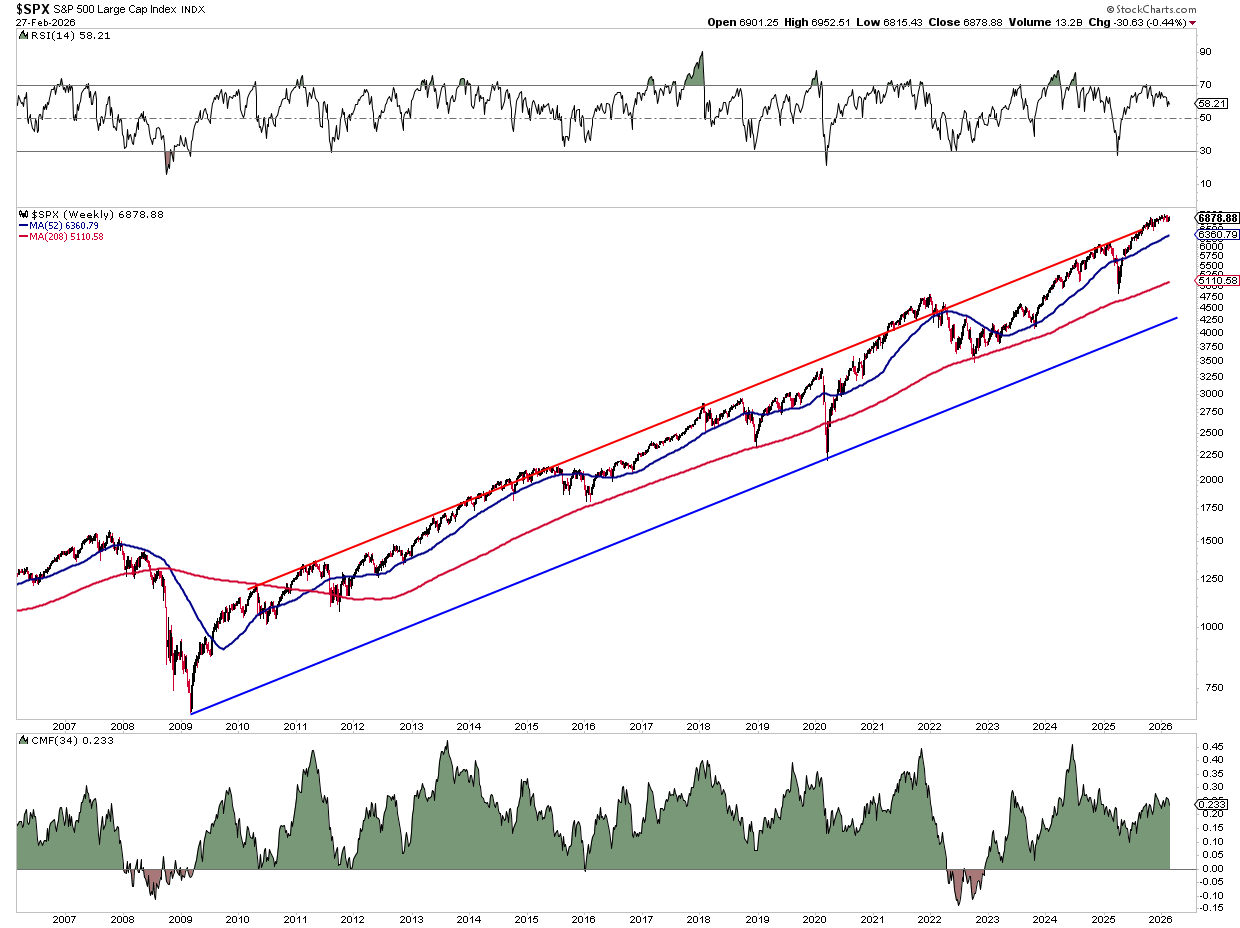
The technical picture, while mixed, is not uniformly bearish either. The S&P 500 remains above its rising 52-week (1-year) and 208-week (4-year) moving averages. That 52-week moving average has been a consistent bullish "line in the sand" that, when lost and confirmed, has historically been one of the most reliable signals that a cyclical bear market is underway. As long as that trend anchor holds, the benefit of the doubt arguably belongs to the bulls. The most important trend line is the 208-week moving average. If that fails, the bears will have control of the market.
Moreover, sentiment indicators have swung sharply toward pessimism during the recent rotation, with the AAII bull-bear spread, the put-call ratio, and the CNN Fear and Greed Index all at levels that historically don't suggest a market-topping process is underway. Market-topping processes are generally built on euphoria, not rising levels of uncertainty.

There is also a structural argument. The ongoing buildout of artificial intelligence infrastructure, the reshoring of manufacturing supply chains, and the capital expenditure cycle across the energy transition represent multi-year tailwinds for corporate earnings that extend well beyond the mega-cap technology cohort. If the AI investment cycle is broadening from the hyperscalers to the enterprise software layer and the industrial economy, then the rotation could have further to go.
So, which side do you pick?
The Verdict: Healthy Skepticism, Not Conviction
Markets rarely announce their intentions clearly, and the current environment is no exception. The bearish case rests on pattern recognition, the eerie similarity between today’s internal deterioration and the breadth collapses that preceded the last three major market topping processes, and on the arithmetic of valuation, which suggests that the margin of safety for equity investors is thinner than it has been in over two decades.
The bullish case rests on fundamentals that remain, for now, constructive: earnings are growing, the Fed is friendly, the labor market is intact, and sentiment is depressed enough to provide contrarian fuel. History shows that expensive markets with rising earnings can stay expensive far longer than value-oriented bears expect, and that defensive rotations within a secular uptrend are more often buying opportunities than exit signals.
The honest answer is that the market is at an inflection point where the evidence supports both interpretations. What will resolve the debate is not opinion, but price. As such, investors should pay close attention to key market levels, as noted in the Technical Update above.
- The 100-day moving average remains a key bullish trend support.
- The 200-day moving average is a critical support level for markets during a corrective process.
If the market breaks below the 100-day moving average, the market-topping process will likely be confirmed. If that happens, the next question for the bulls will be whether the S&P 500 can hold its 200-day average. The bulls, on the other hand, will need to see the market eventually confirm all-time highs on broader participation. A bull market can not last without the major sectors of Financials, Technology, and Healthcare providing support.
Bottom line: There is currently no evidence to suggest that the current rotation is the opening act of a more ominous distribution phase. However, that does not mean the evidence won't eventually manifest. Therefore, investors who position dogmatically for a specific outcome are taking a lower-probability bet than those who remain flexible, watch the key levels, and let the tape itself provide the answer.
As the old market adage goes: the trend is your friend until it bends. The trend has not yet broken. But it is bending.
🖊️ From Lance’s Desk
This week's #MacroView blog digs into the laws of building money and wealth and the tricks to spend less than you earn.
If you want the E-BOOK version to send to your children, you can download it here.

Also Posted This Week:
- Software Stocks: Navigating The SaaSpocalypse - RIA - by Michael Lebowitz
- Is China Really Dumping US Treasuries? - RIA - by Lance Roberts
📹 Watch & Listen
A discussion about whether a potential rotation back to growth from value may be underway.
Subscribe To Our YouTube Channel To Get Notified Of All Our Videos
📊 Market Statistics & Analysis
Weekly technical overview across key sectors, risk indicators, and market internals

💸 Market & Sector X-Ray: Pullback To Support
Despite what seemed like a market-topping process, most sectors and markets outside technology remain in overbought territory on a short-term basis. Energy, Materials, Industrials, and Staples, or rather "value," have strongly outperformed every other market and sector this year. These areas are the most overbought, and a rotation back to growth seems increasingly obvious, but momentum is a hard thing to kill. Take profits and rebalance portfolios accordingly.

📐 Technical Composite: 69.47 – Overbought Conditions Continue To Ease
The overall technical condition remains bullish as the market remains stuck in a consolidation range. One argument against a market-topping process is that price consolidation is easing the previous overbought conditions. I continue to suspect we will get a better entry point for a rally as we get into March. However, as noted above, this weakness is very selective and is driven by Technology, Communications, and Financials. The next market rally will likely be driven by a rotation into these areas.

🤑 Fear/Greed Index: 72.80 – Greed Remains (In Certain Sectors)
Positioning in equities remained strong this week, driven by continued strength in Materials, Industrials, Staples, and Energy as noted above. Overall, retail investors continue to remain aggressively invested, while professional managers slightly reduced net exposure this past week. We could see further sloppy trading and one-sided positioning again next week.

🔁 Relative Sector Performance
As we noted last week, the "bifurcation" in market-sector performance is pretty telling. Financials, Discretionary, Services, and Technology (the largest sectors of the S&P 500) are the most oversold, while Industrials, Energy, Materials, Utilities, and Real Estate are the most overbought.

📊 Most Oversold Sector Holdings
While Financials remain the most oversold, I wanted to look at Technology, given the recent selloff in those stocks. The most oversold in the sector are IBM, AMD, MSFT, and PLTR, with IBM swept up in the SaaS disruption narrative. These stocks, particularly IBM, are very oversold, and if we see a rotation back to growth, these stocks will likely lead the way.

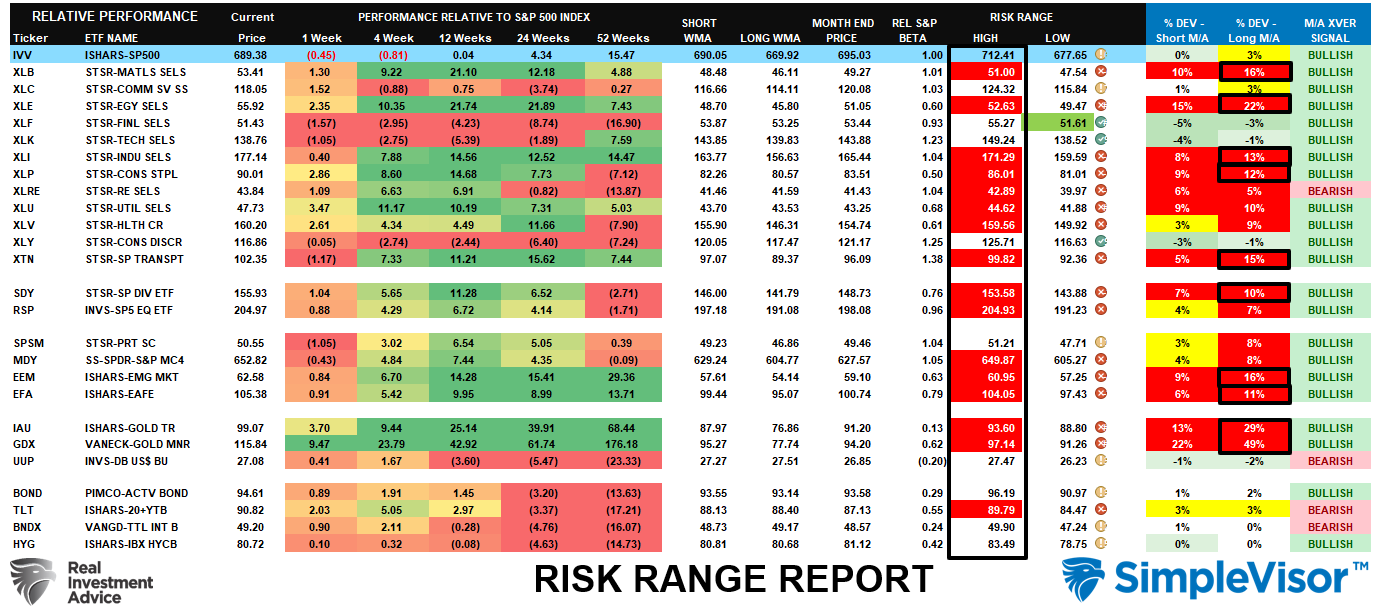
📊 Sector Model & Risk Ranges
As noted last week, Basic Materials, Industrials, Energy, Transportation, Small-cap, and Gold and Gold Miners are at extreme deviations from their longer-term means. Of course, these extremes can persist for a while; therefore, it is important to maintain exposure while managing risk along the way. These more extreme deviations will eventually correct themselves, so continue to manage risk accordingly.
Have a great week.
Lance Roberts, CIO, RIA Advisors
The post Market Topping Process? appeared first on RIA.
Full story here Are you the author?You Might Also Like
 Calm Market Waters Hide Fierce Undercurrents
2026-02-18
The price movement in the broad S&P 500 index is relatively calm. Yet the market’s undercurrent, as measured by sharply diverging returns across stock sectors and factors, is anything but calm. The current market picture we paint is well embodied by a quote from Jules Verne in 20,000 Leagues Under the Sea. “The sea was …
 The Weak Dollar Narrative
2026-02-14
🔎 At a Glance 🏛️ Market Brief – February Lives Up To Its Name We noted last week that February tends to be a weaker month for returns. So far, it has certainly lived up to its name. This past week opened with investors selling technology, and particularly software stocks, to buy value sectors. Energy, …
 The Market Risk In 2026 If Growth Projections Fail
2025-12-29
There is a rising market risk in 2026 that is largely overlooked as we wrap up this year. As discussed in the “Fed’s Soft Landing Narrative,” optimism about 2026 is running high. Currently, investors are pricing in strong economic growth, robust earnings, and a smooth path of disinflation. Notably, Wall Street estimates suggest a significant …
 The Santa Claus Rally Begins
2025-12-27
🔎 At a Glance 💬 Editor Note I am traveling this weekend for the Christmas holidays with the family. Therefore, I don’t have access to all of my usual data and analysis. However, I did not want to miss the opportunity to send you at least a short note. The following Market Brief and Technical …
 Forward Return And The Importance Of Math
2025-11-10
During strongly trending bull markets, investors often overlook the importance of math in predicting forward returns. Such is easy to do when the market just seemingly continues to rise without regard to fundamentals. The current environment is also heavily influenced by the impact of “passive indexing,” which has distorted market dynamics as well. However, none …
 Bitcoin Is Off The Leaderboard: Whats Next?
2025-11-06
On many recent occasions, we have noted that the market breadth is poor and appears to be worsening. By worsening, we mean that the number of market leaders is declining, and a growing number of stocks, stock factors, sectors, and asset classes are lagging. Currently, the small list of stock factors showing up in SimpleVisor’s …
Tags: Featured,newsletter