Lance Roberts
My articles My offerMy siteAbout meMy videosMy books
Follow on:TwitterSeeking AlphaFacebookAmazon
Sector rotation is this weekend's 2026 Investment Summit. I am presenting at the conference as you are reading this. However, I would be remiss not to share a brief market update as we head into next week. The full newsletter will return next week.
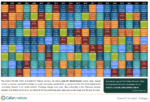
That said, U.S. equity markets delivered mixed performance last week. Major indices generally held near record levels even as volatility increased and macro and policy risks surfaced. Notably, breadth has expanded as the rotation from technology to other sectors continued. Such was particularly notable in materials, industrials, and transportation. We noted on January 8th that a rotation into defensive areas was likely. Since then, staples and energy have significantly outperformed.
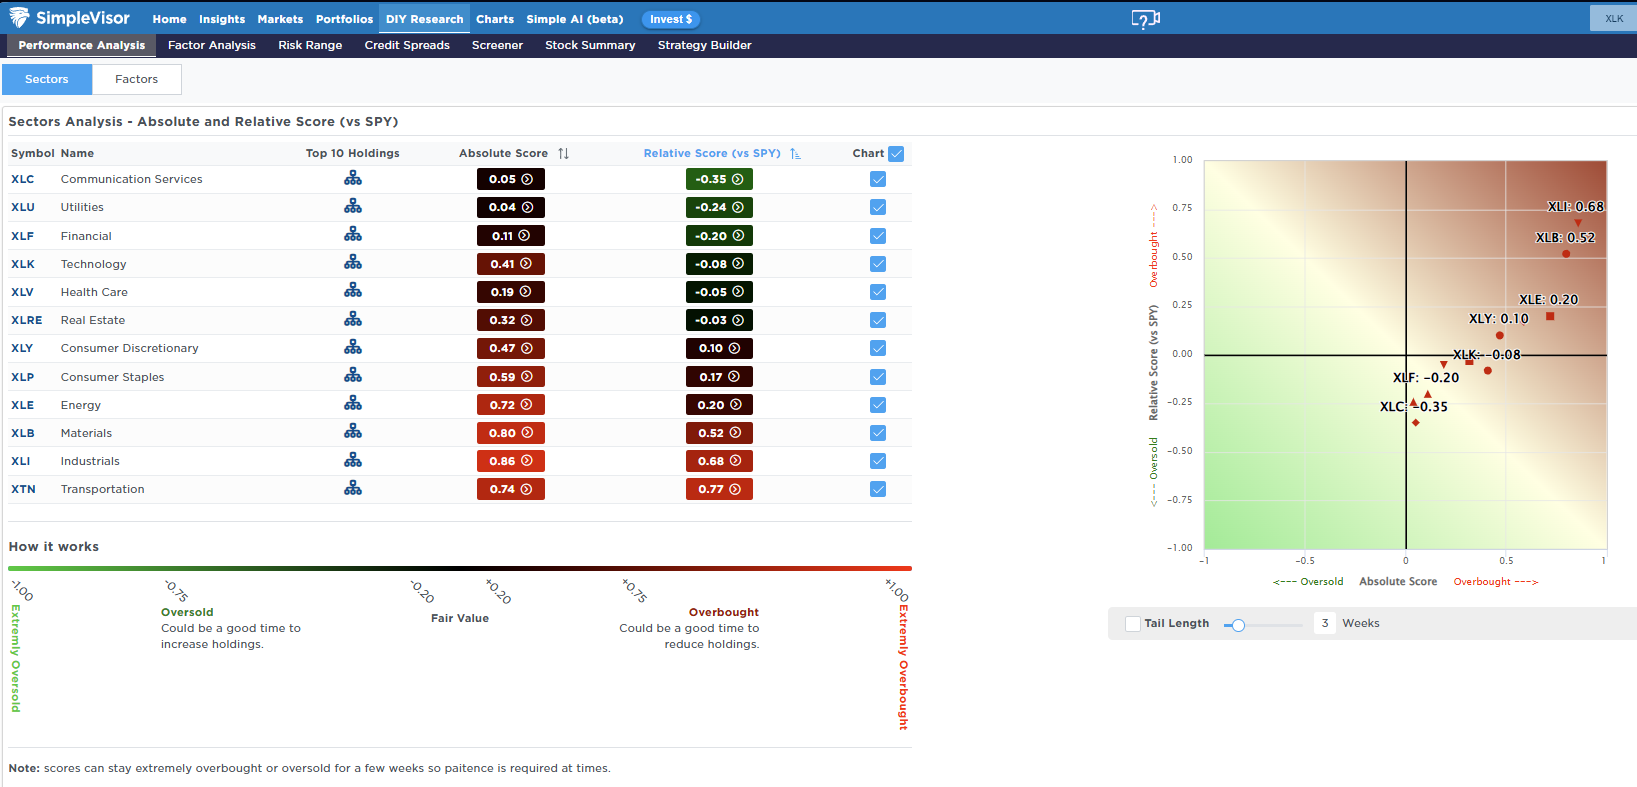
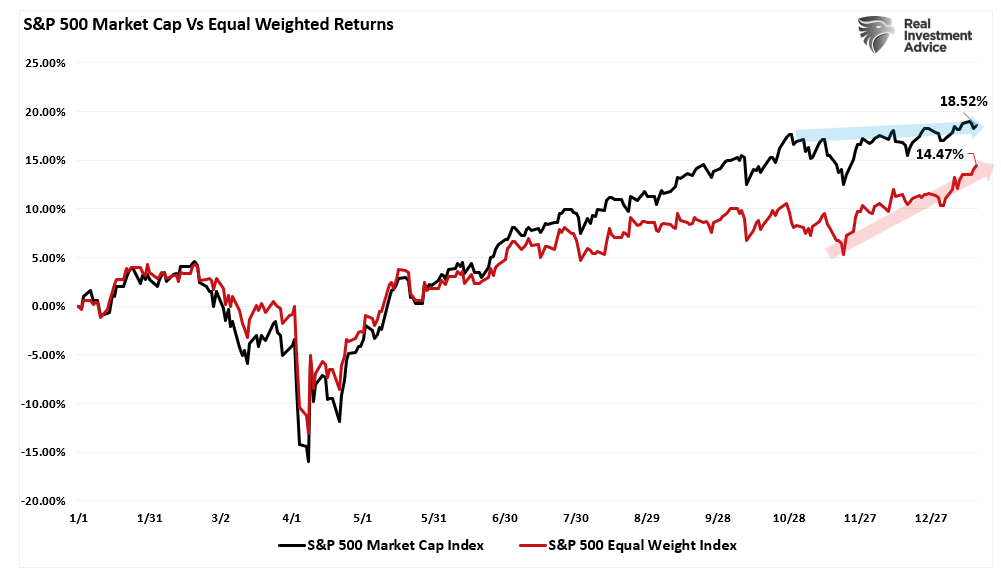
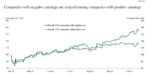
Notably, that sector rotation has pushed the equal-weighted index to new all-time highs. That surge continues to close the performance gap with the market-cap-weighted index as technology has lagged. However, technology, financials, and communications are now becoming more oversold. Such sets up a potential counter rotation as we move into the heart of earnings season starting this coming week.
Despite geopolitical concerns, questions about the Federal Reserve's independence, and policy uncertainty, the US Dollar remained firm, trading near equilibrium since 1976. Furthermore, the dollar remains in a strong bullish uptrend from its 2008 lows, underscoring that narratives of dollar debasement and dedollarization remain false.
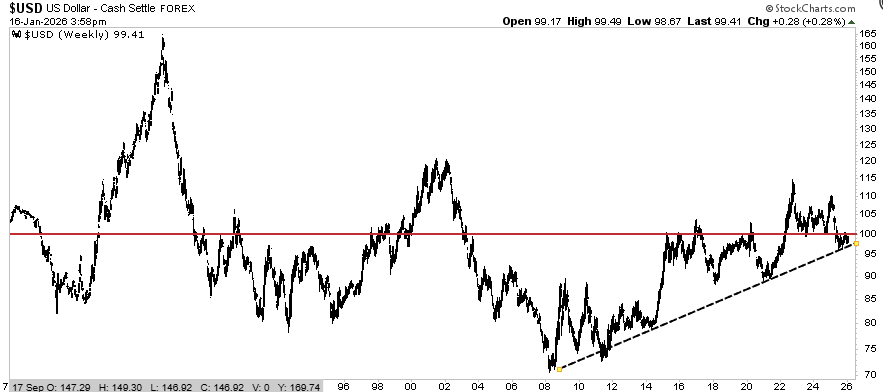
The falseness of those narratives is underscored by the rising and record levels of US Treasury bond purchases by foreigners. (If they were de-dollarizing or were worried about debasement, they would not be buying Treasuries, which are dollar-denominated.)

As the week progressed, economic data and corporate earnings began to exert greater influence on market direction. Retail, consumer, and producer price data alongside early labor market indicators painted a picture of a still‑stable economy with signs of cooling momentum. Markets interpreted this data as supportive of sustained growth with a cautiously optimistic Fed posture.
The big news, of course, is that the Q4 earnings season commenced with significant implications for sector leadership. Financial sectors took center stage as mixed bank results from major lenders such as Wells Fargo, JPMorgan, and Goldman Sachs led to sector underperformance midweek, while robust forecasts and expansion plans from Taiwanese semiconductor giant TSMC sparked a rally in chip stocks. Nvidia, Broadcom, Micron, and chip‑equipment suppliers outperformed substantially on Thursday, lifting broader market sentiment and contributing to a two‑day recovery from earlier declines. As noted above, mid‑cap and small‑cap stocks also outperformed, suggesting expanding market breadth beyond mega‑cap technology names.
The importance of sector rotation and fund flows should not be overlooked. According to Lipper data, U.S. equity funds experienced the largest weekly inflows in over three months, with large‑cap exposure leading and tech, industrials, and consumer staples attracting notable capital. Bond funds also saw strong inflows, indicating a balanced approach to risk assets amid mixed signals on growth and inflation. Money market fund outflows reflected renewed risk appetite despite policy noise.
Next week, earnings will take center stage as the primary market drivers. Therefore, let's review the technical backdrop for near-term support and resistance levels.
📈Technical Backdrop - Bulls Remain In Control
With the S&P 500 closing at 6940 on Friday, the technical conditions reveal a market in a controlled but consolidative state as key milestones approach. The index maintained its uptrend established late last year and into early January, signaling continued bullish momentum as higher highs and higher lows remain intact. This trend is supported by the S&P 500's recent successful test of the 20-day moving average, with breadth indicators such as advancing stocks and total market participation expanding beyond just mega-cap technology names.

Price action through the week saw the S&P 500 navigate around near‑record levels while consolidating within a tight range just below the psychologically significant 7000 level, which acts as immediate resistance. Both the technical selling and options market dynamics ahead of earnings could just be prepositioning against potential disappointment risk. However, if earnings are better than feared, this could lead to a rather explosive move higher if the rising wedge pattern resolves bullishly. Short‑term momentum indicators on the daily chart suggest neutral to slightly bullish conditions, with the trend slowing but without reversing. The market’s current structure shows typical consolidation behavior after a strong advance, often preceding a continuation rather than an abrupt reversal when broader breadth remains supportive.
On the downside, the index remains supported by key levels that traders and investors should monitor. These include the prior breakout zones and the 50‑day moving average, which has acted as a dynamic support floor through recent pullbacks. A decisive break below these supports could signal a loss of short‑term trend conviction, though weekend risk events, such as geopolitical developments or policy news, could still influence price action once markets reopen after the Martin Luther King Jr. holiday.
From a volatility perspective, U.S. equity volatility metrics remain subdued, although volatility has risen mildly. We could see a further pickup in volatility with earnings season and macroeconomic data releases, which are known to act as catalysts for directional breaks.
In sum, the S&P 500’s technical profile remains constructive but range‑bound near resistance. Support levels are holding for now, and trend measures remain bullish above the key breakout levels. The next directional move will likely hinge on the market’s ability to clear resistance above 7000 or to test deeper support levels that define the current trend structure.
KEY TECHNICAL LEVELS – S&P 500 Index (SPX)
| Level | Role | Comment |
|---|---|---|
| 7100 | Next resistance | Next upside extension above a 7000 breakout |
| 7000 | Immediate resistance | Psychological barrier near all‑time high |
| 6940 | Friday close level | Current trading pivot |
| 6909 | Near‑term support | 20-day moving average |
| 6829 | Secondary support | 50-day moving average |
| 6742 | Deeper support | 100-day moving average |
🔑 Key Catalysts Next Week
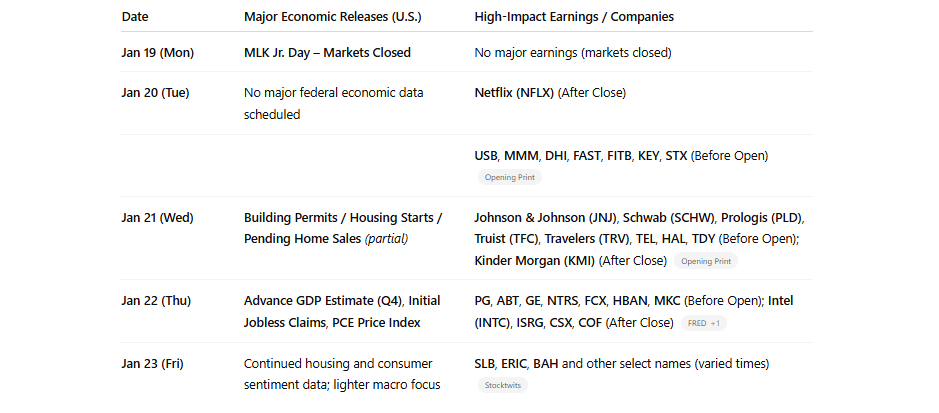
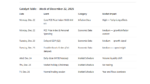
Market activity in the week ahead will be defined by a holiday‑shortened start, a slate of major economic releases, and a broad set of corporate earnings from S&P 500 names and key sectors. Monday, January 19, markets will be closed in observance of Martin Luther King Jr. Day, resulting in light trading and reduced volume once markets reopen on Tuesday. After an active first full week of earnings and macro data, investors will turn next to fresh corporate reports and several high‑impact economic releases, including advance GDP, jobless claims, and core inflation proxies. Given recent market resilience amid mixed macro signals, these catalysts will affect sentiment and positioning as Q4 earnings continue and markets digest inflation trends and labor market dynamics.
The schedule below highlights major U.S. economic releases alongside notable S&P 500 and large‑market company earnings that could move markets.
Need Help With Your Investing Strategy?
Are you looking for comprehensive financial, insurance, and estate planning services? Need a risk-managed portfolio management strategy to grow and protect your savings? Whatever your needs are, we are here to help.

Have a great trading week.
Lance Roberts, CIO, RIA Advisors
The post Rotation Continues As Markets Remain Bullish appeared first on RIA.
Full story here Are you the author?You Might Also Like
 The ECB Changes Tone: Will The Fed Follow?
2025-12-23
Inflation in the European Union is nearing 2%, expected to dip below it in 2026 and 2027 and then settle at its 2% target thereafter. The ECB’s President Lagarde and other ECB members have recently stated that they are comfortable with the central bank’s current interest rate level. The markets are taking the ECB’s public …
 2026 Market Outlook Based On Valuations
2025-12-22
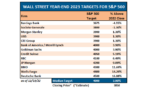
It’s that time of year when Wall Street polishes up its crystal balls and begins predicting returns for 2026. Since Wall Street never predicts a down year, which would be unwise for fee-based product revenues, these forecasts are often inaccurate and sometimes significantly wrong. Let’s review some previous years. For example, on December 7th, 2021, …
 Fed’s Soft Landing Narrative Meets Economic Data
2025-12-20
🔎 At a Glance 💬 Ask a Question Have a question about the markets, your portfolio, or a topic you’d like us to cover in a future newsletter? 📩 Email: [email protected]🐦 Follow & DM on X: @LanceRoberts📰 Subscribe on Substack: @LanceRoberts We read every message and may feature your question in next week’s issue! 🏛️ …
 Investor Dilemma: Pavlov Rings The Bell – Draft
2025-11-03
Classical conditioning teaches us a valuable lesson regarding the current investor dilemma. Pavlov’s research discovered a basic psychological rule: when a neutral stimulus is repeatedly paired with a reward‑stimulus, eventually it will trigger the same response even when the reward is absent. The famed experiment by Ivan Pavlov illustrated that dogs would salivate at the …
 Dow Theory: A Concerning Divergence Or Artifact?
2025-10-31
Dow Theory is a market tool developed by Charles Dow in the very early 1900s. Dow also created the Dow Jones Industrial Average. The basic gist of Dow theory is that market trends are confirmed when gains or record highs are established in the broader market indexes, and then confirmed by similar trends and/or record …
Tags: Featured,newsletter