Lance Roberts
My articles My offerMy siteAbout meMy videosMy books
Follow on:TwitterSeeking AlphaFacebookAmazon
🔎 At a Glance
- Bullish Case Begins As Market Rallies
- Beginning of our 2026 Outlook
- Portfolio Tactics For Next Week
- From Lance's Desk: Jobs Data From Alternative Sources May Drive Fed's Next Move - RIA
- Portfolio updates & sector strategy shifts
- Market stats, screens, and risk indicators
💬 Ask a Question
Have a question about the markets, your portfolio, or a topic you'd like us to cover in a future newsletter?
📩 Email: [email protected]
🐦 Follow & DM on X: @LanceRoberts
📰 Subscribe on Substack: @LanceRoberts
We read every message and may feature your question in next week’s issue!
🏛️ Market Brief - Rally Begins As Dip Buyers Emerge
Markets opened in December with a surge in optimism as retail investors regained their "bullish spirit." That improvement continues to build on the bullish case we discussed last week:
"Seasonality, positioning, and trend still lean in favor of the bulls. December is historically one of the stronger months for equities, particularly when the market is already up by double digits year-to-date. Expectations for a December Fed rate cut, and a gradual cooling of inflation, support the “soft-landing” narrative, while corporate buybacks and under-invested managers create fuel for a “chase into year-end” if resistance gives way. With volatility easing and breadth improving, the path of least resistance near term remains higher if key support zones are maintained."

The increase in optimism is also attributable to the significant policy pivot from the Federal Reserve. On December 1, the Fed officially ended its quantitative tightening (QT) program. The halting of the runoff of its balance sheet and the injection of fresh liquidity into financial markets are essential. We will discuss this more momentarily. But for investors, this change removed a persistent headwind and reignited expectations for a more accommodative stance in 2026.
Speaking of Fed policy, the next FOMC rate decision is this coming week. The CME futures markets now reflect a very high probability of a 0.25% rate cut. Furthermore, expectations for further rate cuts in March of next year have risen. However, as discussed in last week’s brief, seasonality, dip-buying, and institutional positioning are already in play, and the removal of QT adds fuel to that narrative, helping to lift asset prices.
Notably, there has been a shift away from stretched growth names toward lagging sectors, such as energy, financials, and healthcare, which has improved market breadth. That improvement is a necessary component of a more sustainable rally. However, much of the action still appears technical and remains inconsistent with bullish markets.

Next week, the focus will shift toward confirmation as the markets closely scrutinize the Fed's commentary for clues on the timing and scope of further rate cuts. Liquidity indicators in repo markets and short-term funding will also be critical. If those stay stable, the rally could continue. Lastly, economic data, particularly inflation and employment figures, the first since the Government shutdown, will also play a role in shaping expectations.
For now, the rally has legs, but once we enter 2026, the fundamentals will need to improve to sustain it.
Let's review the technical backdrop.
📈Technical Backdrop - Market Rallies As Expected
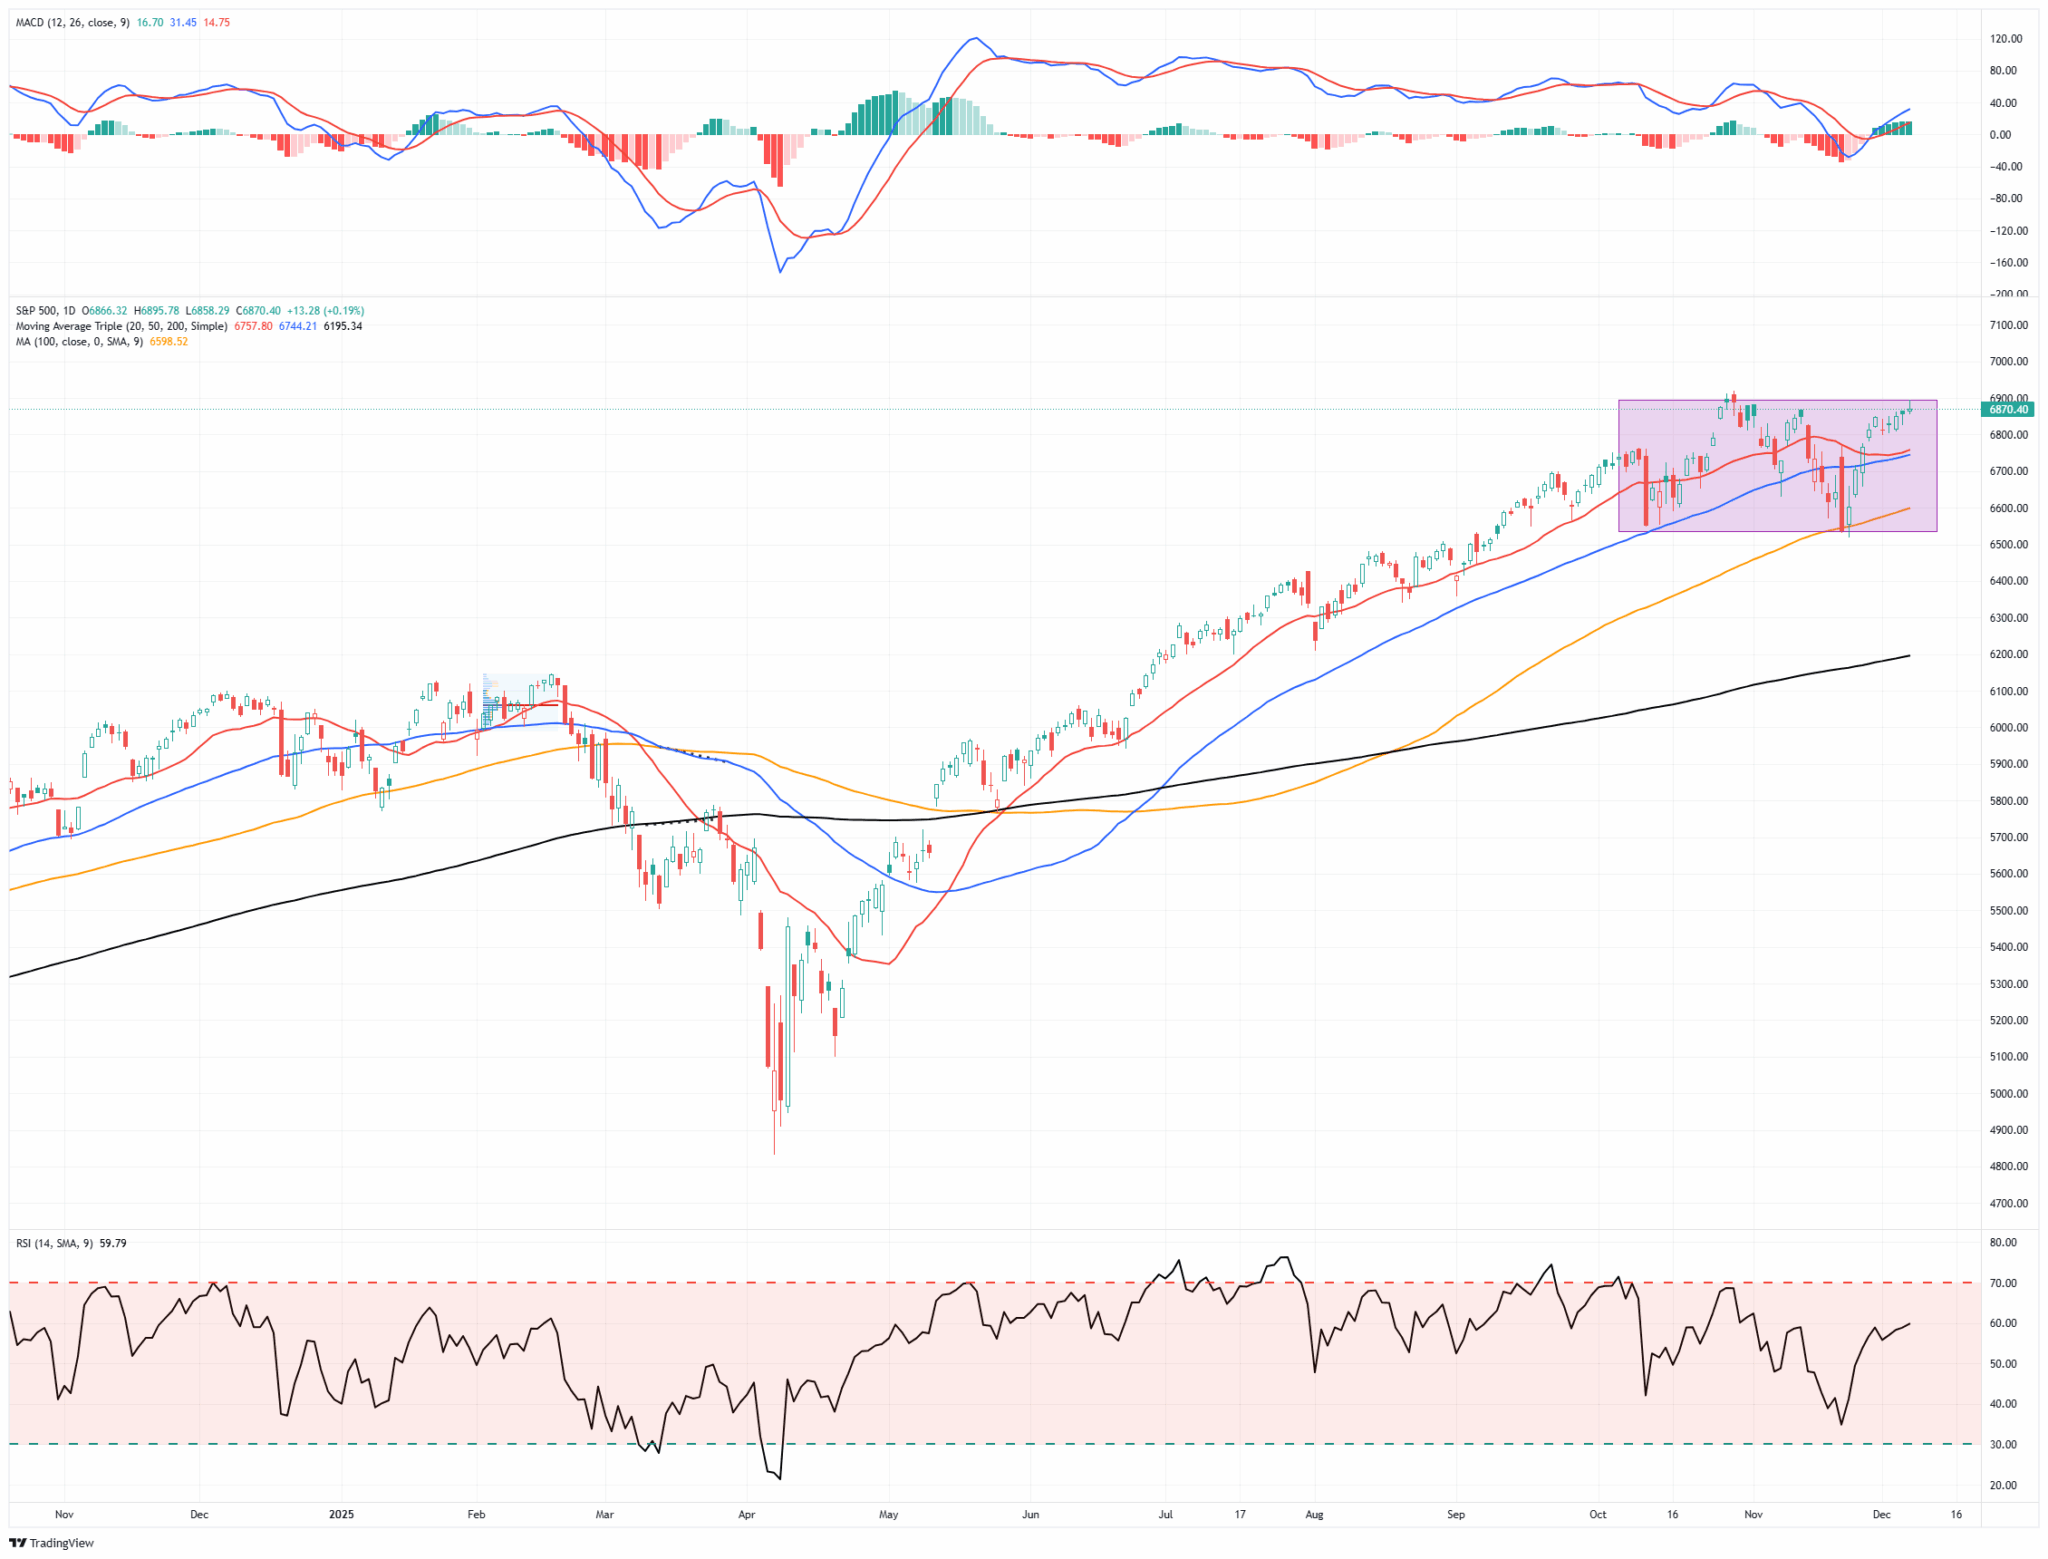
The technical foundation for the S&P 500 looks bullish following this week’s rally. With a Friday close at 6,870, the price remains above key moving averages and just under near‑term resistance. This is a bullish setup but suggests careful attention to support/resistance zones.
As shown in the daily chart below, the technical indicators remain favorable. The 50-day moving average is currently positioned near 6,744, and the 200-day moving average is approximately 6,195. Both levels are below the current price, providing support in the event of a pullback. Furthermore, the market is on a momentum "buy signal," and relative strength is improving along with breadth as noted above. All of this suggests that the current uptrend remains intact, with buyers still in control. Despite the "angst" of the first two weeks of November, the market has been digesting the rather massive gains from the April lows.
Support and Resistance Zones
Based on the 6,878 close and the latest available pivot‑point and technical data, key zones to watch in the coming sessions:
- Immediate support: ~ 6,744 - 6,757 (20- and 50-day moving average cluster)
- Secondary support: ~ 6,598 (100‑day moving average) — a zone that, if broken, would signal weakening of the broader uptrend.
- Critical Support ~6,195 (200-day moving average) - if this level fails, the market will be facing a larger corrective action.
- Near‑term resistance: ~ 6,885 – 6,900 as markets approach previous rally peaks and all-time highs
- Major resistance/breakout zone: ~ 6,920–6,940 would clear previous all-time highs moving next resistance to top of current trend line near ~7,000
The rally this past week showed signs of expanding beyond just the most significant growth and AI‑related names. As discussed last week, some underappreciated sectors, such as value and cyclical-linked areas, registered relative gains. That diversification in participation tends to support the durability of a bullish uptrend.
Caution flags also emerged and are worth paying attention to. While the market gained ground, volume was modest, suggesting many investors remain hesitant and are not fully committing. If this remains the case, the risk of a rally built primarily on liquidity and short-term positioning, rather than broad conviction, is susceptible to swift reversals in investor sentiment. Additionally, with prices exceeding the 200-day averages, the risk of a correction also increases.
Overall, the technical backdrop is bullish but is not devoid of risk. Continue to maintain a disciplined approach, respect support and resistance levels, and manage risk exposures accordingly.
🔑 Key Catalysts Next Week
Markets enter this week with elevated expectations. With the recent end of quantitative tightening, investors are now watching a cluster of important events that could define whether the year-end rally broadens or stalls. The most significant driver will be the upcoming meeting of the Federal Reserve (Fed). But a series of economic data releases and significant corporate earnings will also test optimism.
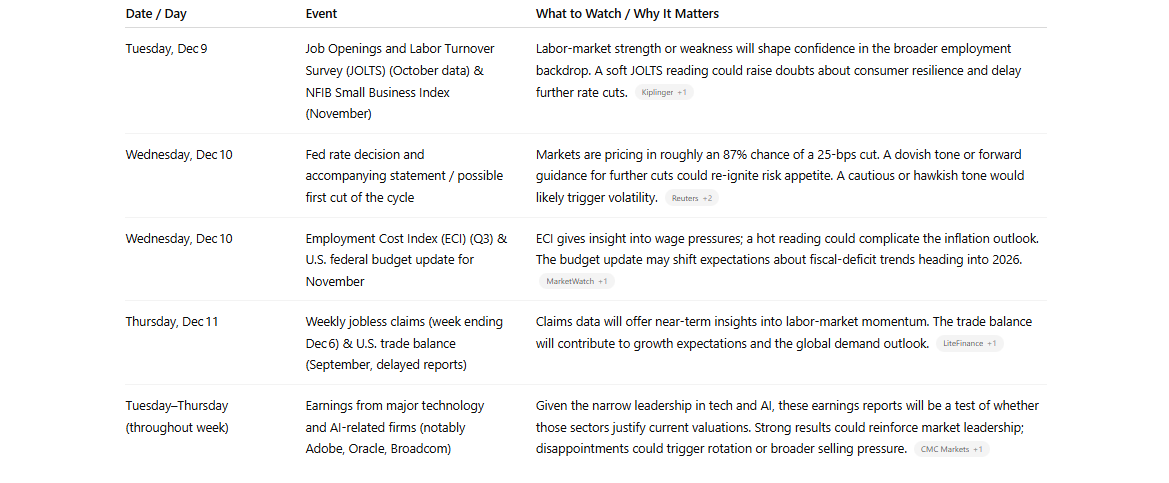
What Investors Should Focus On
- The Fed meeting on December 10 looms as the central anchor. A well‑telegraphed 25‑bps cut, or even the possibility of a path of cuts, could reopen risk‑asset flows. If the Fed soft‑pedals, expect volatility and potential rotation out of overvalued sectors.
- Labor market data from JOLTS and weekly jobless claims will indicate whether employment remains resilient or is starting to exhibit cracks, which has direct implications for consumer spending and credit risk.
- Earnings from big tech and AI firms (ORCL, ADBE, and AVGO) will continue to test whether growth expectations baked into valuations are realistic or overly optimistic.
- The mix of budget, trade, and cost data will inform broader macro narratives, including growth, inflation, and fiscal/credit conditions.
This week offers a high‑stakes test of sentiment. If liquidity (through the Fed’s policy) aligns with solid economic and earnings data, the rally could broaden beyond mega‑caps and extend into 2026. If not, this “year‑end bounce” risks fading or turning into a broader reassessment.
Need Help With Your Investing Strategy?
Are you looking for comprehensive financial, insurance, and estate planning services? Need a risk-managed portfolio management strategy to grow and protect your savings? Whatever your needs are, we are here to help.

💰 As The Year Ends, What Does 2026 Hold
Markets have reached a crossroads. Investors are staring down two sharply opposing narratives as 2025 comes to a close. On one side, there’s optimism: the Federal Reserve has ended quantitative tightening, liquidity is rising, and key sectors are flush with capital. On the other hand, significant risks remain unresolved: narrow market leadership, elevated valuations, growing household stress, and deepening concerns in the credit market.
These are all things we have discussed previously, but the split reflects more than market noise. It’s a clash between structural bullish support and underlying economic fragility. While both cases are grounded in data and each carries significant implications for asset allocation, risk management, and long-term investment outcomes, they are equally essential to consider.
As we will discuss, the bull case leans heavily on liquidity, fiscal support, and renewed investment. The return of easy monetary conditions, a shift in political leadership favoring tax cuts and increased spending, and massive capital expenditure commitments by the largest U.S. companies paint a picture of continued upside. If those forces hold, equities could continue to grind higher, lifting all sectors or at least sustaining current valuations.
Conversely, the bear case warns that the fundamentals are fraying beneath the surface. Household debt is rising, delinquencies are increasing across income brackets, and private credit markets are displaying early warning signs. Meanwhile, the rally remains narrowly focused on a few mega-cap stocks tied to artificial intelligence. If those names falter, the broader market could quickly give up its gains.
In today's analysis, we will examine both arguments and outline the most likely path for markets in 2026. Whether the market skews bullish or breaks bearish, investors need a plan. What matters now isn’t conviction in one narrative. What matters is readiness for either outcome.
Let's get into it.
Bull Case: Why the Market Could Push Higher
Liquidity has shifted significantly more favorably for risk assets and equities. On December 1, 2025, the Federal Reserve (Fed) officially ended its quantitative tightening (QT) program and is scheduled to cut overnight lending rates by another 0.25% next week. The Fed has simultaneously conducted a large overnight repurchase agreement injection of approximately $13.5 billion into the banking system, which is the second-largest liquidity injection since the COVID-19 era began.

That signals the Fed is done draining cash from the system and may even be ready to begin loosening again. Furthermore, that shift removes a significant structural drag on equities. Furthermore, as noted, adding to that backdrop are further expected rate cuts, as early as next week. As shown, the market performs well during periods of a Federal Reserve rate-cutting cycle when the economy is not in a recession. Currently, although economic data remains weak, recession risks are muted.

With easier liquidity, investors are likely to return to riskier assets. Historically, when QT ends and liquidity returns, equities have tended to rally, and the renewed cash flow may support not only large-cap stocks but also corporate cap-ex, buybacks, and broader credit-based investments. The return of liquidity breathes new life into the structural bull arguments of a fresh technology cycle, substantial capital expenditure by major firms, corporate buybacks, and deregulation or capital easing.
Furthermore, on the consumer side, while household debt rose modestly in Q3, overall borrowing increased in a controlled way. Total U.S. household debt reached about $18.59 trillion as of Q3 2025, a 1 percent increase over the prior quarter and up about $642 billion year‑over‑year. That rise was reflected in mortgages, credit cards, student loans, HELOCs, and auto loans. Notably, mortgage balances alone rose by $137 billion, bringing the total mortgages to $13.07 trillion.

Despite this, delinquency rates for mortgages remain relatively stable, while student-loan and unsecured debt are showing increased levels of strain. This suggests that households are still serviceable on their debt, which in turn could provide further support to corporate earnings in the near term. Again, I am not dismissing the rise in credit card and student loan delinquencies, but these have not yet morphed into broader economic stress...yet.

Given liquidity, consumer balance‑sheet resilience (at least in aggregate), and the potential for renewed capital expenditures and buybacks, the environment favors further upside. Stocks that had lagged or sectors outside of narrow, “hot” themes may attract renewed interest as investors seek value and diversified exposure.
Statistically, there is also a bullish case to be made. As shown in the table below, many have forgotten about the ~20% decline we saw in March and April this year. That "reset" was necessary as 20% corrections, while they happen, are more "severe" events that reverse overly bullish sentiment and positioning. However, more notable was the sharp reversal from the April lows. Such a selloff and reversal has only occurred four times since 1950. While there is still roughly one month left in 2025, if returns hold at their current levels, it suggests that 2026 could have a positive year as bullish momentum continues.

But not everything is "bullish" heading into 2026.
Bear Case: Why the Rally Could Falter
While a bullish outlook for 2026 is present, numerous and growing risks are also present. Many of the powerful catalysts that drove the post‑pandemic rally now show signs of fatigue or overhang. However, before we delve into those, let's begin with overall performance. Over the last three years, the market has delivered extraordinarily high returns of 20% or more consecutively. That is not unprecedented, but it does lean to the more unusual side of the statistical ledger. As we noted yesterday in our #DailyMarket Commentary:
"The S&P 500 has posted a strong three-year price return of approximately 76.7 percent, excluding dividends. That translates to an annualized return of 20% to 22%. This is well above the long-term average annual return of roughly 10% to 11% with dividends reinvested. Such elevated returns over a short period suggest that the market is trading well above its historical trend. Historically, when the S&P 500 rolling 3-year return is two standard deviations above its three-year moving average, the market is statistically extended. This deviation typically precedes a shift in volatility and return outcomes. In other words, when markets reach this level of extension, two patterns emerge: increased volatility and weaker forward returns."
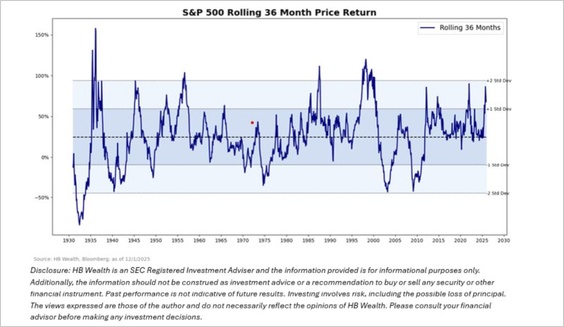
While many expect 2026 to be a continuation of 2025, we should always respect the most powerful force in investing: the principle of "reversion to the mean."
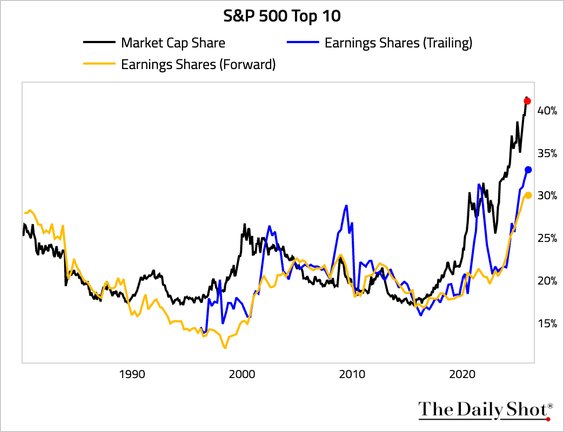
However, adding to that concern is the continued fact that the market remains extremely narrow. Gains have concentrated heavily among a small group of high-growth companies with strong ties to AI and technology. If optimism around AI, tech investment, or “transformational technology” cracks, even slightly, whether due to earnings disappointments, regulatory headwinds, or shifting investor sentiment, the broader market could struggle. The narrow leadership leaves little margin for broader weakness, and given that the vast majority of earnings growth has come from a handful of companies, it suggests that "disappointment risk" could be a significant factor next year.
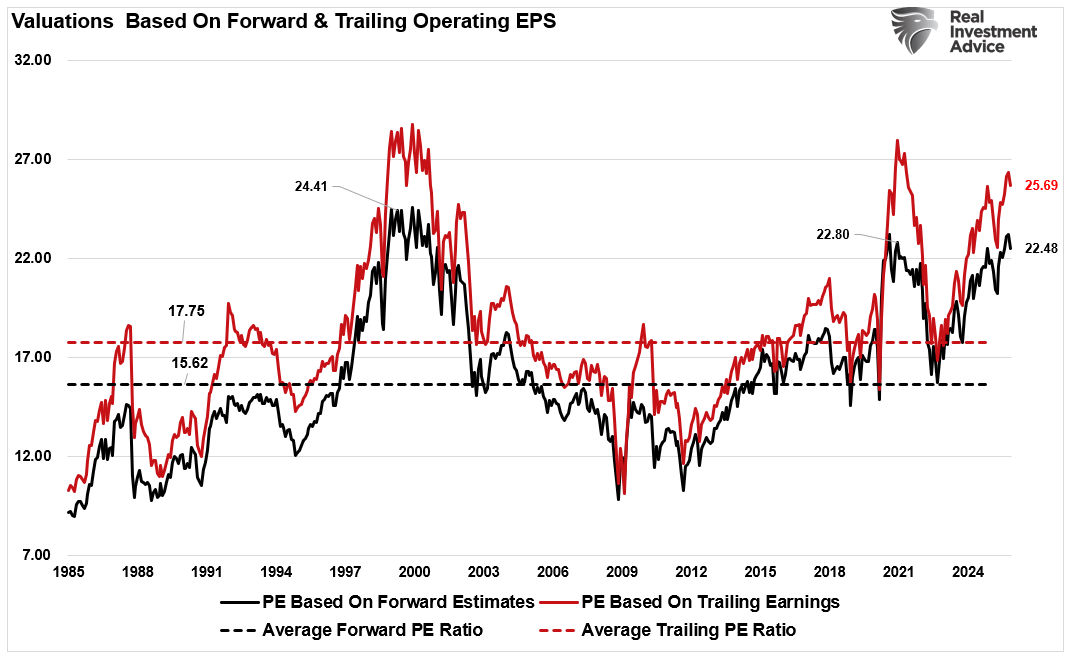
Valuations remain elevated. With forward price‑to-earnings (P/E) multiples for the broad market stretched, there is little buffer for disappointments in earnings growth, macroeconomic slowdown, or credit stress. Overpaid valuations amplify the downside if growth or liquidity fails to meet expectations.
Credit‑market vulnerabilities are rising. The rapid growth of non-bank “private credit” as an alternative to traditional lending is now drawing scrutiny. Investors are increasingly withdrawing from publicly listed funds that hold such private credit instruments. That suggests waning confidence and potential repricing of private debt risk. If borrowers across corporate or household sectors struggle, losses could reverberate through credit markets and spill into equities.

One caveat to the bear case is that while these are all very valid factors that could negatively impact stocks, they are also dependent on a more macro-type shock to "ignite the fuse." Yes, valuations are high, but there must be an "event" to cause a rapid repricing of forward earnings estimates. Yes, debt is problematic, but only when a recession triggers job losses, leading to sharp increases in defaults across all categories.
So, yes, while these factors are essential, I do not expect them to occur over the span of the next week, month, or even quarter.
However, with that being said, what should investors expect heading into next year?
📒 What Investors Should Expect Heading Into 2026
In 2026, there is a growing possibility that investors may experience both bull and bear markets. As noted, the "bear case" is predicated on longer-term, macro events that will take some time to mature. However, the "bull case" is more focused on short-term factors, such as liquidity, which, although plentiful today, can evaporate tomorrow. Given the data and dynamics, the most likely near-term outcome is a continued bull market, which may lead to increased volatility and potentially bearish outcomes later in the year.
To navigate such an environment, investors should consider constructing their portfolio to hedge against both outcomes.
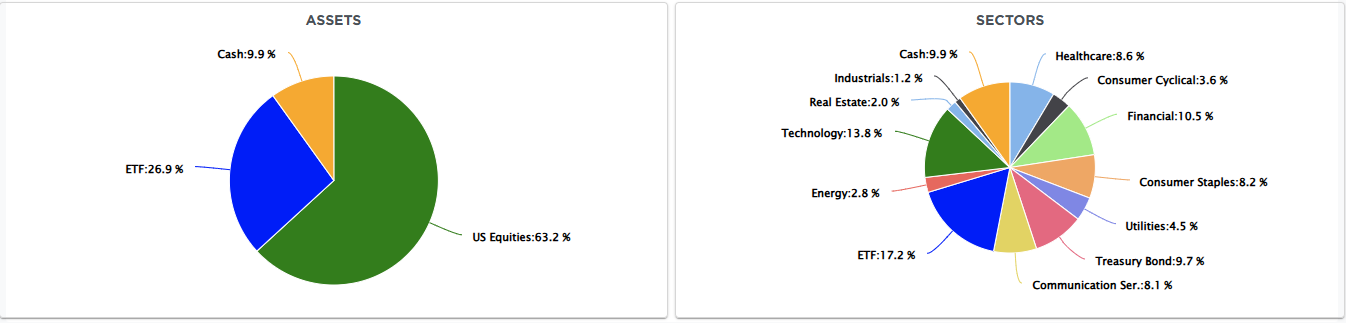
- Maintain diversified equity exposure. Favor broad‑based funds or ETFs rather than concentrated high‑growth, high‑valuation stocks.
- Keep some cash or cash equivalents (5–10% of the portfolio). That dry powder allows disciplined dip buying.
- Focus on companies with strong free cash flow, low leverage, and stable earnings. Favor firms able to sustain operations even if consumer demand softens or credit tightens.
- Monitor credit markets. Watch spreads in private credit, high‑yield bonds, and consumer credit delinquencies. Signals here may presage broader economic stress.
- Consider hedges or ballast. A modest allocation to stable dividend-paying stocks, short-term bonds, or hedging via options could help cushion a downside drawdown.
Overall, liquidity favors the bulls in the near term. But structural weaknesses warn against complacency. A diversified, disciplined, cautious approach offers a prudent path forward as markets digest mixed signals.
Trade accordingly.
🖊️ From Lance’s Desk
This week's #MacroView blog examines the employment backdrop through the lens of alternative data and why the Fed does need to cut rates.

Also Posted This Week:
- Fed Regime Change: Groupthink May Be Ending - by Michael Lebowitz
- A Bear Market Is A Good Thing. - by Lance Roberts
📹 Watch & Listen
Is the market setting up for "Santa Claus to visit Broad and Wall?"
Subscribe To Our YouTube Channel To Get Notified Of All Our Videos
📊 Market Statistics & Analysis
Weekly technical overview across key sectors, risk indicators, and market internals

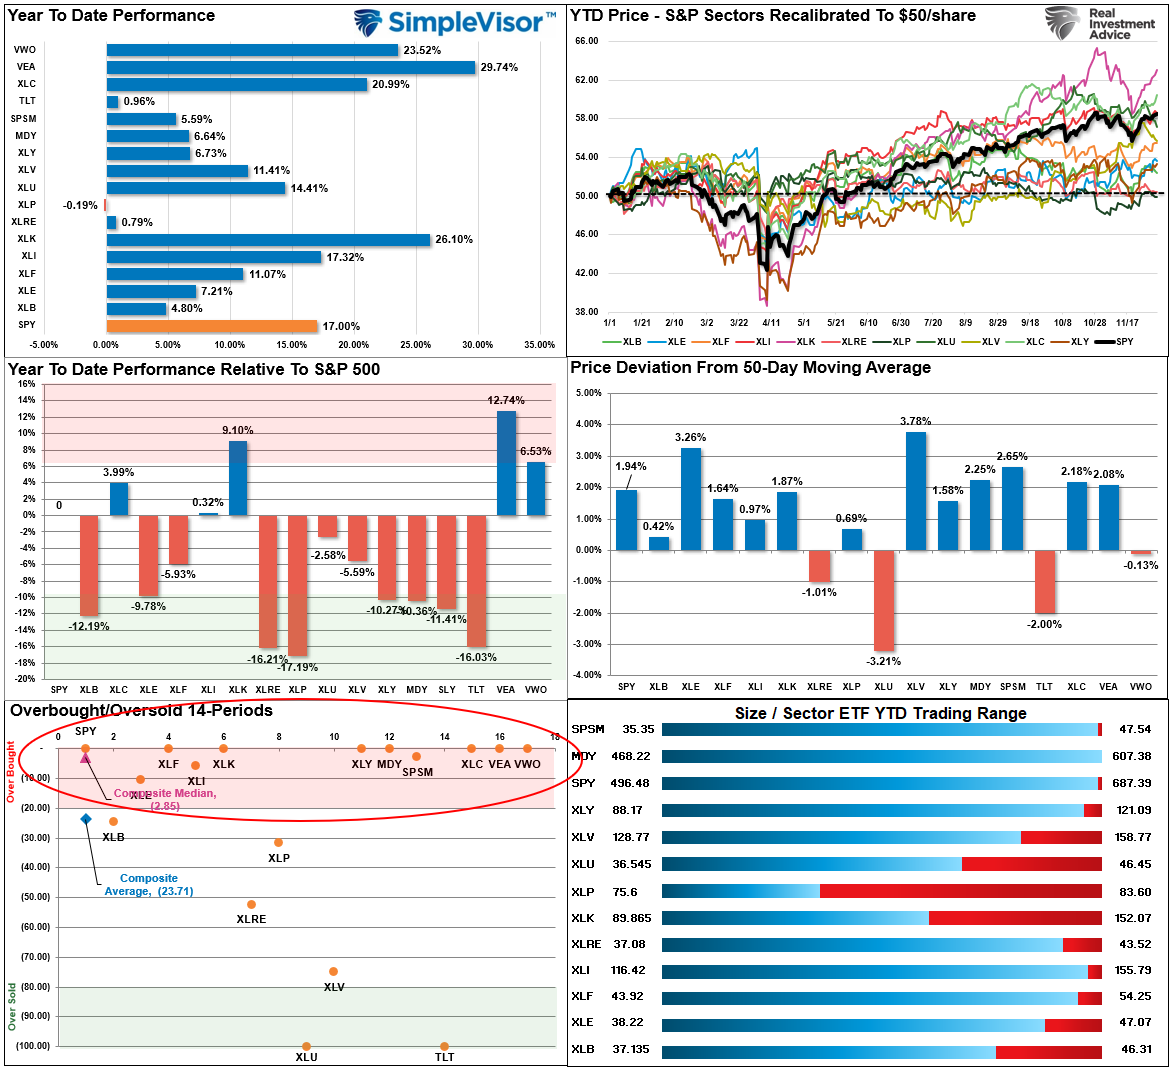
💸 Market & Sector X-Ray: Pullback To Support
Last week, we discussed that "the rally began this past week with Technology leading the charge and triggering a fresh momentum buy signal." As shown below, most markets and sectors are now back to very short-term overbought, while Bonds, Utilities, and Healthcare are oversold. We are likely setting up for a short-term rotation over the next week or so, which should reset the market for a rally to close out the year.
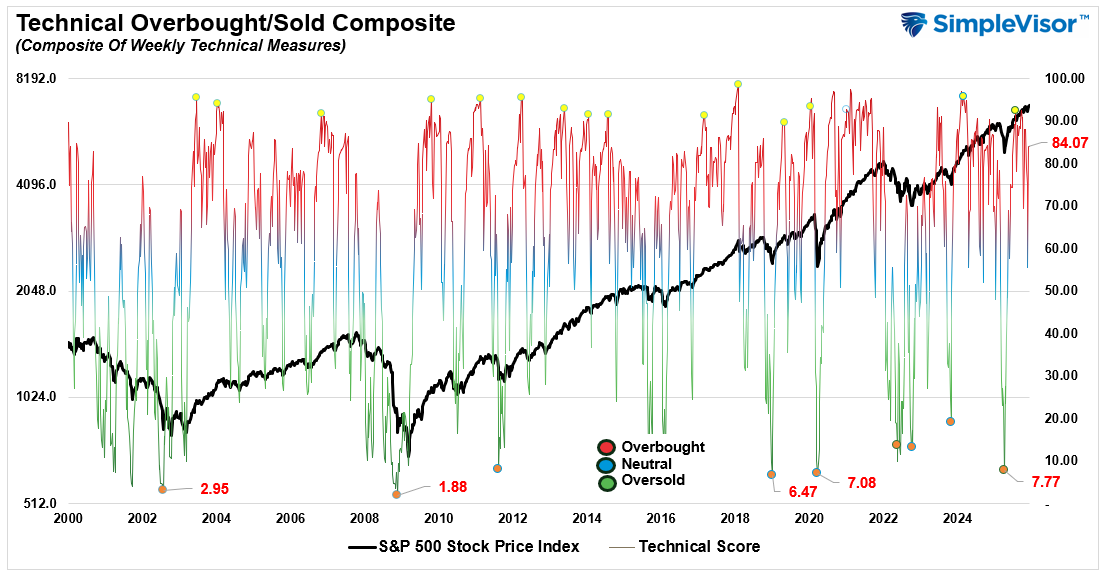
📐 Technical Composite: 84.07 – Rally Sends Technicals Back To Overbought
The overall technical condition continued trending higher as the market rallied following the November correction. As we noted two weeks ago, "If this is just a pullback, markets are oversold enough for a decent bounce into the end of the month." That has been the case so far, and while some weakness should be expected before Christmas, the setup for a year-end rally remains intact.
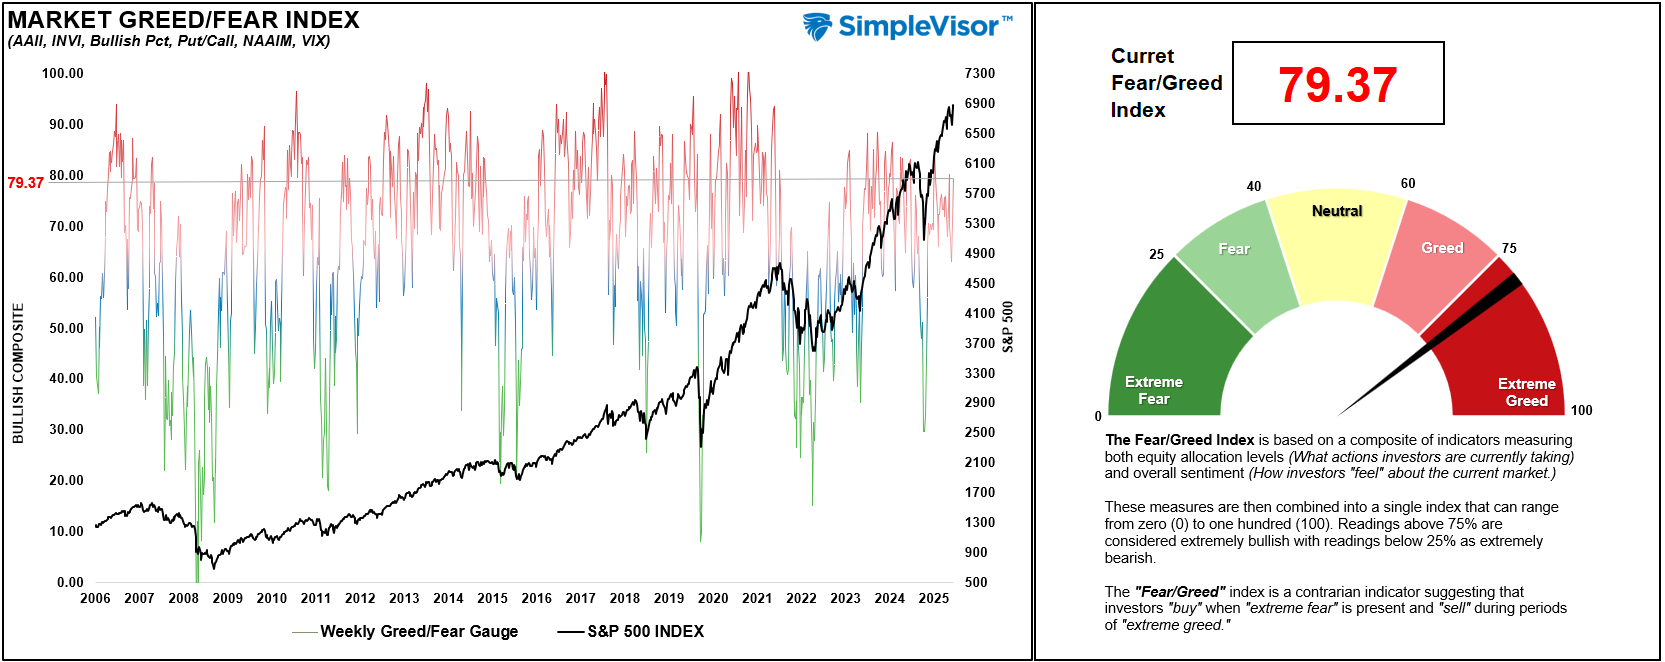
🤑 Fear/Greed Index: 79.37 – Extreme Greed Returns As Rally Continues
As we noted last week, "...with some of the previous exuberance reversed, it was unsurprising to see 'dip buyers' step in this past week and potentially continue into the coming week." They have done just that, and with the market trading higher, their sentiment has reversed from near "neutral" back to "extreme greed" in just two weeks.
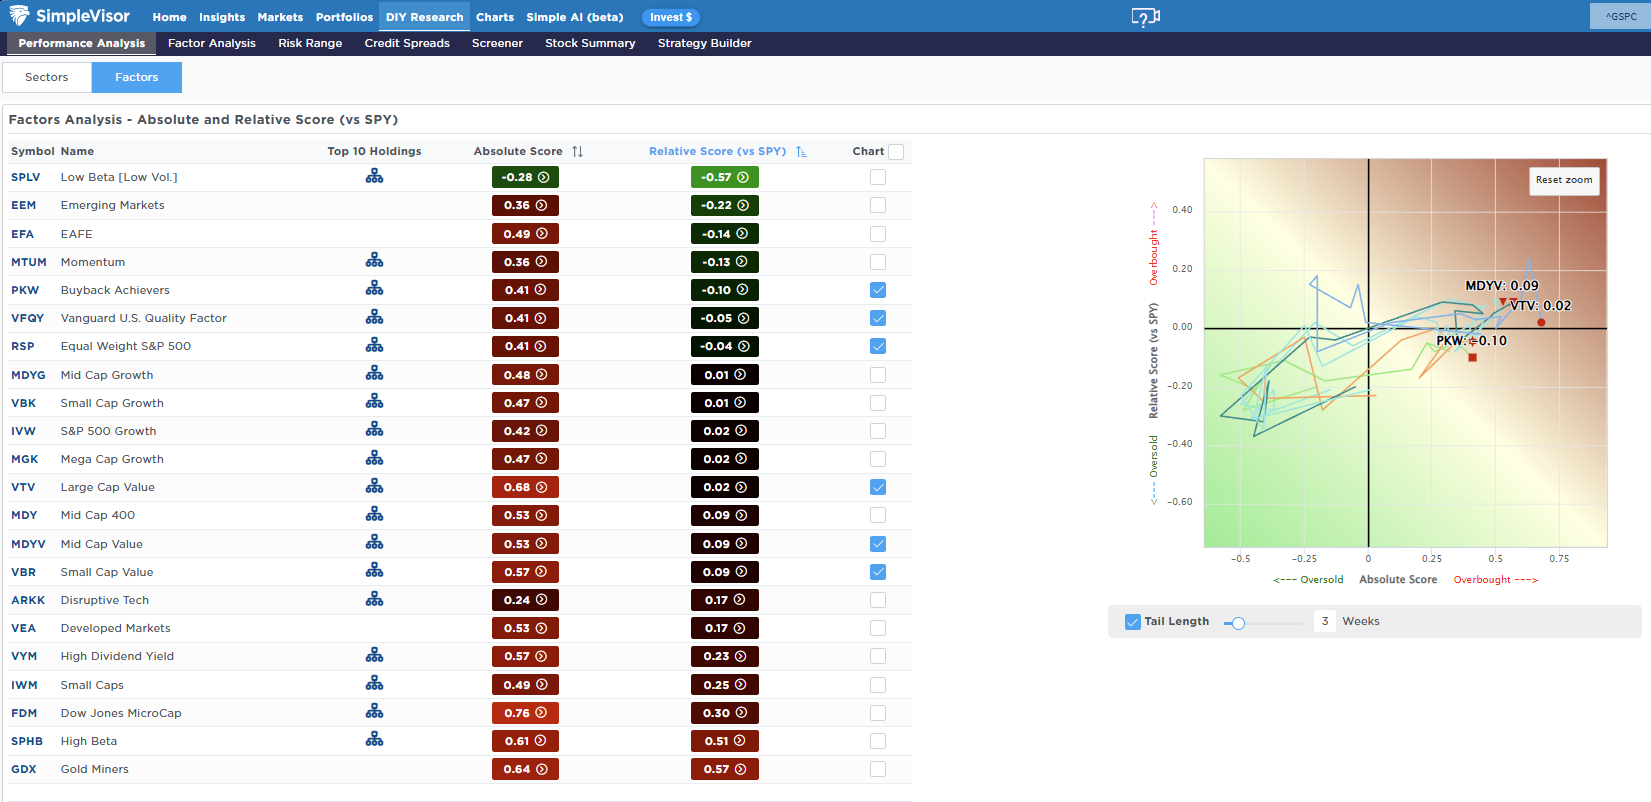
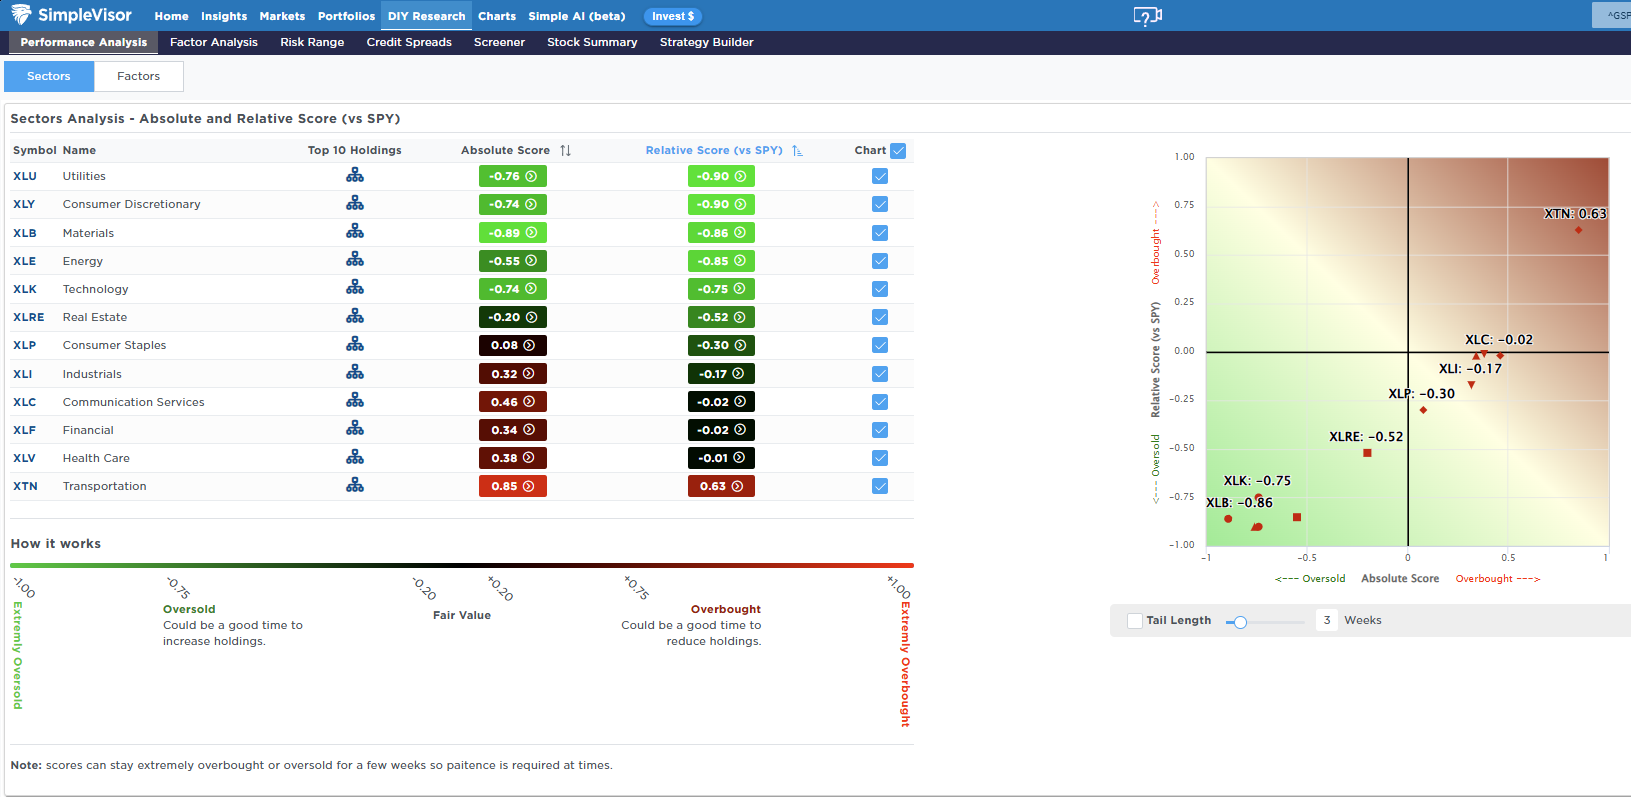
🔁 Relative Sector Performance
Last week, we noted that Technology had reversed a bulk of its previously overbought condition, paving the way for a reflexive rally. While technology performance has started to improve, Utilities are now the most oversold and out of sector favor, along with Discretionary and Basic Materials.
📊 Most Oversold Sector Holdings
In the Utilities sector, DUK, SO, and EXC are the most oversold, although the entire sector is oversold, providing investors with an opportunity to evaluate holdings in the space selectively.

📊 Sector Model & Risk Ranges
While the market continues its bullish push higher, as investor sentiment improves, there are still significant deviations in some sectors from their longer-term means, including Technology, Healthcare (although reduced from previous levels), Emerging Markets, Gold, and Gold Miners. These sectors are the most at risk of a reversal, but as always, bullish momentum can keep these markets elevated longer than logic would predict. Nonetheless, investors should consider taking profits and rebalancing their portfolios to mitigate risk for a short-term market rotation ahead of a year-end rally.

Have a great week.
Lance Roberts, CIO, RIA Advisors
The post Bullish Case Or Bearish Backdrop appeared first on RIA.
Full story here Are you the author?You Might Also Like
 The Bearish Bond Narrative Fades
2025-11-14
Not that long ago, bond yields were rising as concerns over deficits, inflation, and a series of bad Treasury auctions were paraded through the media. We bring this to your attention as the Ten-year Treasury auction on Wednesday was on the weaker side, yet the bond market reaction was minimal. Additionally, government deficits are just …
Tags: Featured,newsletter