Michael Green, Chief Strategist and Portfolio Manager at Simplify Asset Management, wrote a provocative Substack essay, Part 1: My Life Is A Lie, that is sparking a debate among economists and raising awareness of the affordability crisis. It's not just the wonky economists debating the merits of his article; The Washington Post, CNN (News Central), FOX Business (Charles Payne), and social media are also critiquing it.
Michael uses the official poverty line calculation and what he deems the “Mathematical Valley” to help his readers better appreciate why affordability is becoming a hot topic.
The Poverty Line
Per Michael Green:
But there was one number I had somehow never interrogated. One number that I simply accepted, the way a child accepts gravity.
The poverty line.
I don’t know why. It seemed apolitical, an actuarial fact calculated by serious people in government offices. A line someone else drew decades ago that we use to define who is “poor,” who is “middle class,” and who deserves help. It was infrastructure—invisible, unquestioned, foundational.
This week, while trying to understand why the American middle class feels poorer each year despite healthy GDP growth and low unemployment, I came across a sentence buried in a research paper:
“The U.S. poverty line is calculated as three times the cost of a minimum food diet in 1963, adjusted for inflation.”
I read it again. Three times the minimum food budget.
I felt sick.
This article summarizes Michael Green’s perspective and opposing arguments regarding the poverty line. Bear in mind, as you read on, that there is no “right” poverty line. However, what Michael Green has successfully done is ignite a conversation about the large number of Americans who feel left behind economically and repeatedly raise affordability as a key political issue.

The 1963 Poverty Line Benchmark
Green’s analysis centers on the poverty line, which was established in the early 1960s by Mollie Orshansky. The original formula she developed was simple: take the cost of a basic basket of food for a family, multiply it by three (on the assumption that food accounted for about one-third of a household’s budget), and use that as the poverty threshold.
Her benchmark was then adjusted for inflation each year, but the underlying assumptions about household spending and needs haven’t been updated since. Per Green:
Orshansky’s food-times-three formula was crude, but as a crisis threshold—a measure of “too little”—it roughly corresponded to reality. A family spending one-third of its income on food would spend the other two-thirds on everything else, and those proportions more or less worked. Below that line, you were in genuine crisis. Above it, you had a fighting chance.
Notably, Green emphasizes that Orshansky’s poverty line served as a threshold. Those with incomes beneath this threshold were in crisis.
Orshanky’s Poverty Line Is Outdated
Green emphasizes the items we spend money on, and their costs compared to food prices have changed significantly since then. For example, he points out:
- Housing costs as a percentage of income rose significantly.
- Cell phones didn’t exist.
- Healthcare costs have become the most significant expense for most families.
- A second income became a necessity for many families after the formula was devised, leading to increased childcare expenses.
- He also notes rising college and transportation costs.
Simply, feeding a family no longer constitutes a third of total family budgets. To wit, he states:
Housing now consumes 35 to 45 percent. Healthcare takes 15 to 25 percent. Childcare, for families with young children, can eat 20 to 40 percent.
Michael Green’s punchline:
Which means if you measured income inadequacy today the way Orshansky measured it in 1963, the threshold for a family of four wouldn’t be $31,200.
It would be somewhere between $130,000 and $150,000.
What does that tell you about the $31,200 line we still use?
It tells you we are measuring starvation.
Green’s Data Analysis
Green supports his theory with a basic family budget based on national averages. He applies it to a family earning the median household income of $80,000. The results, as we share below, cast significant doubt on the value of the current $31,200 poverty line. Furthermore, they argue that at least half of the nation is “living in deep poverty.” Per Green:
I wanted to see what would happen if I ignored the official stats and simply calculated the cost of existing. I built a Basic Needs budget for a family of four (two earners, two kids). No vacations, no Netflix, no luxury. Just the “Participation Tickets” required to hold a job and raise kids in 2024.
Using conservative, national-average data:
Childcare: $32,773
Housing: $23,267
Food: $14,717
Transportation: $14,828
Healthcare: $10,567
Other essentials: $21,857
Required net income: $118,009
Add federal, state, and FICA taxes of roughly $18,500, and you arrive at a required gross income of $136,500.
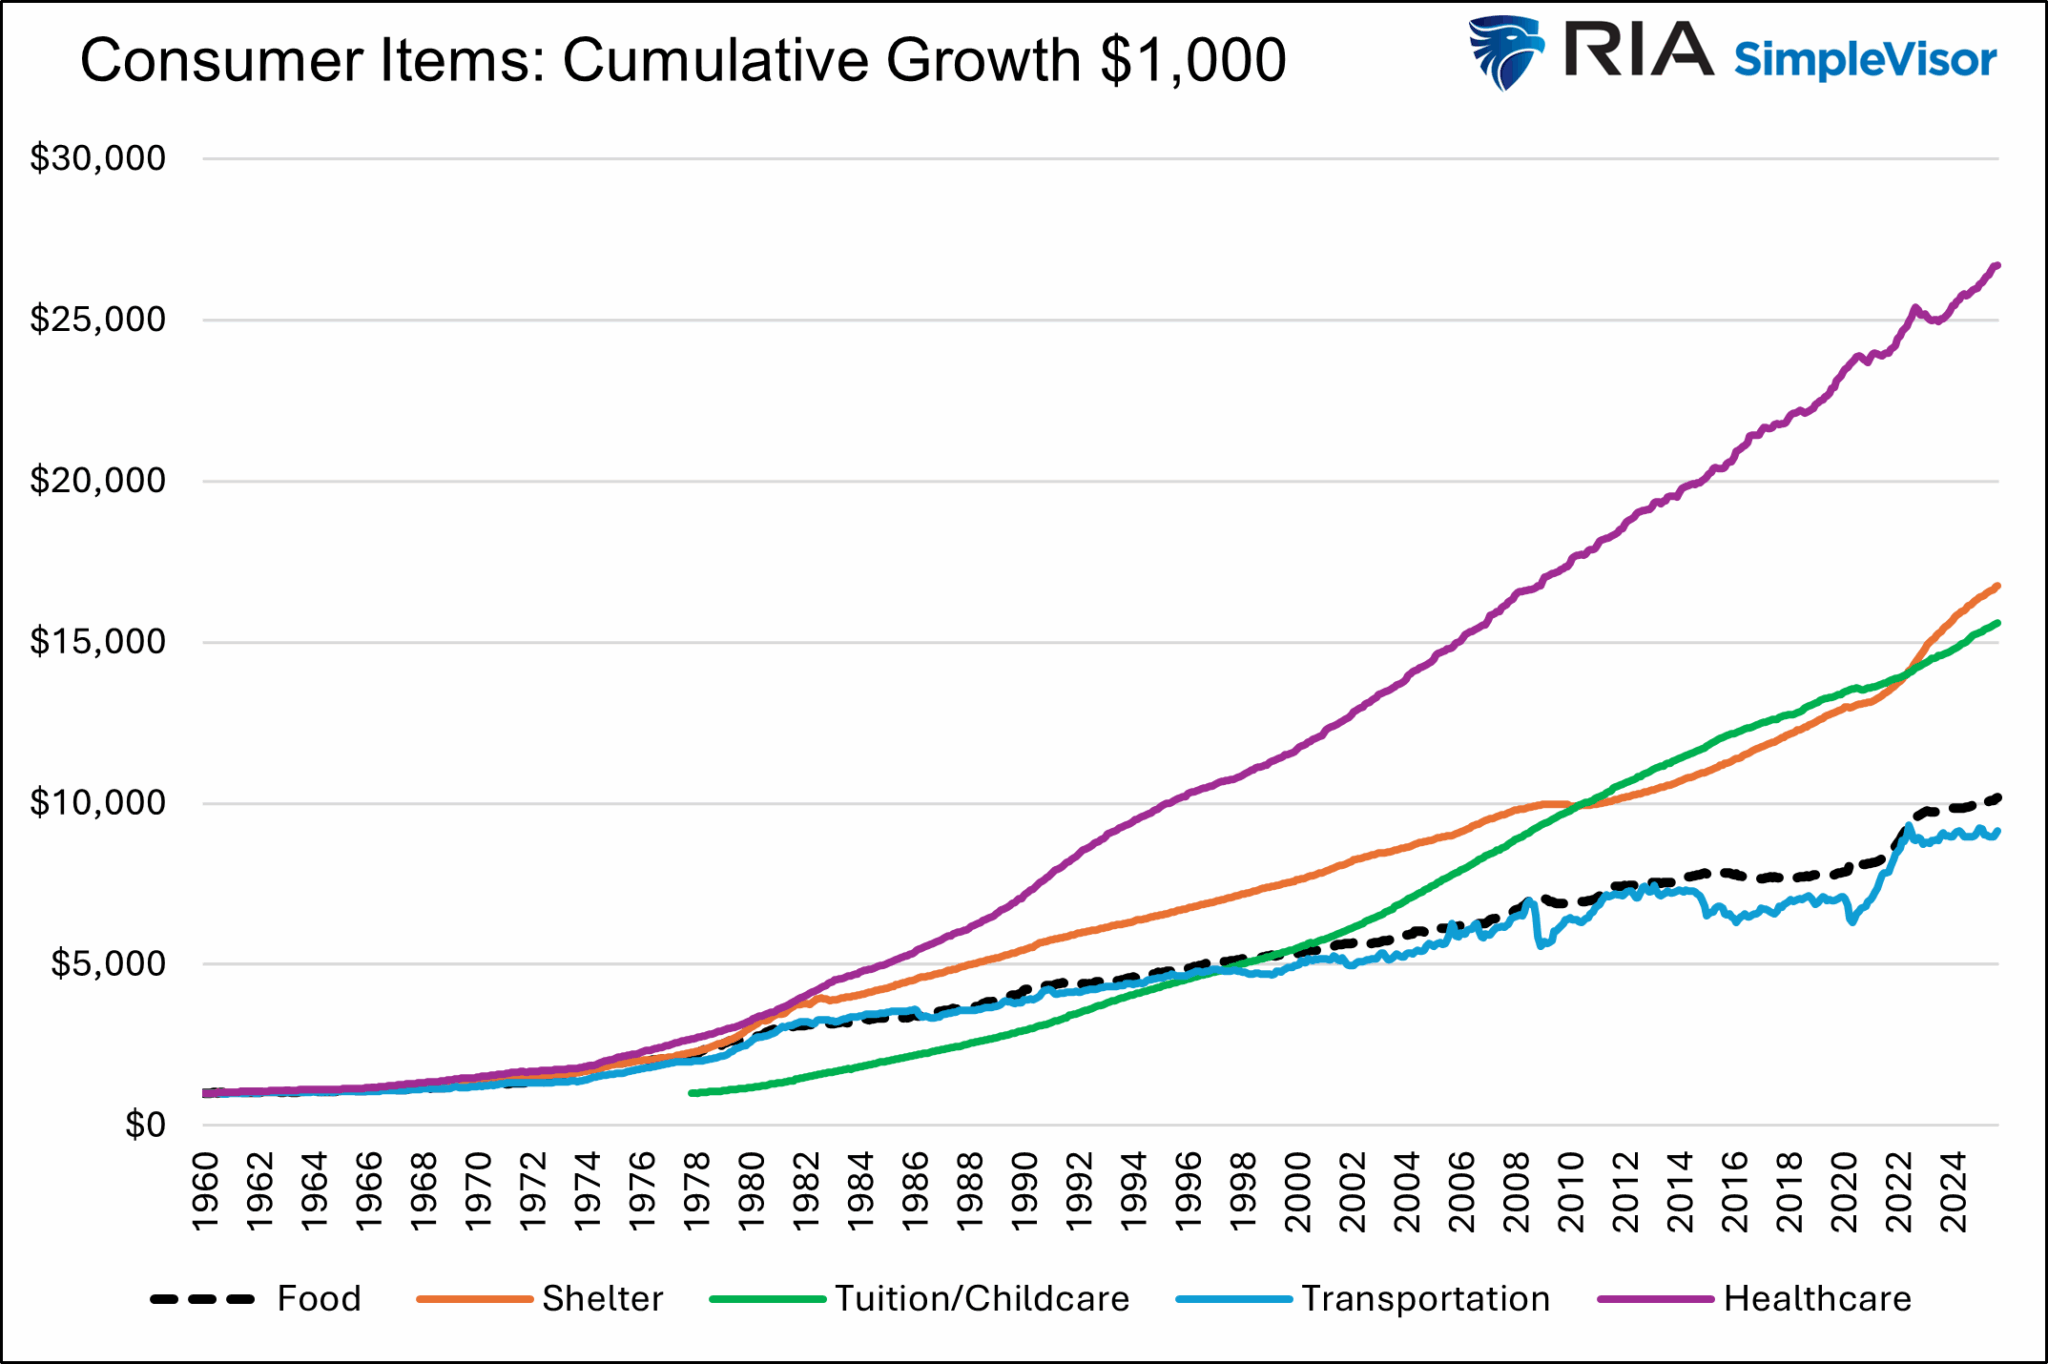
The graph below shows the cumulative price growth for $1,000 across many of the spending items Michael Green identifies above. As shown, except for transportation prices, all the others have significantly outpaced food prices. Thus, to Green’s point, a poverty line based on a steady price-consumption relationship for these goods and others in relation to food prices has become grossly ineffective.

Hedonics
Hedonics is a statistical method used by the BLS in the CPI report to distinguish pure price changes from changes in product quality and how those changes impact value.
For example, if a new laptop offers twice the performance at the same sticker price as an old one, hedonics treats that as a quality improvement and will record an effective price decline. Supporters say it prevents overstating inflation as products improve. In contrast, critics argue that it can understate inflation and relies on modeling choices that are impossible to validate.
Green is a critic. As we share below, he uses landline telephones and smartphones to make his point:
To function in 1955 society—to have a job, call a doctor, and be a citizen—you needed a telephone line. That “Participation Ticket” cost $5 a month.
Adjusted for standard inflation, that $5 should be $58 today.
But you cannot run a household in 2024 on a $58 landline. To function today—to factor authenticate your bank account, to answer work emails, to check your child’s school portal (which is now digital-only)—you need a smartphone plan and home broadband.
The cost of that “Participation Ticket” for a family of four is not $58. It’s $200 a month.
Green states that food prices, not hedonics, are the only primary factors used to compute the CPI for food. In his calculations, the rate of inflation across many other CPI items greatly exceeded the CPI's reported rate, in part due to faulty hedonics.
Mathematical Valley
Michael Green introduces what he calls a “mathematical valley.” This idea illustrates a trap within the American economic system. The valley symbolizes the area where working families earn enough to lose government benefits but not enough to cover the actual cost of middle-class economic stability.
As families move from poverty into the lower middle class—usually earning between about $40,000 and $100,000—they lose access to safety net programs like food stamps, housing subsidies, or Medicaid. Still, their wages don't keep up with the rising costs of housing, healthcare, childcare, and transportation. As a result, climbing the economic ladder can actually make families worse off financially because the loss of benefits outweighs the income gains.
This Valley creates a perverse incentive to stay poor or near-poor, traps millions in financial insecurity, and fuels widespread cynicism among the working poor who feel punished for trying to get ahead.
Green’s Summary
The Orshansky poverty line is based on the amount required to cover a minimum food budget times three. Since she developed her formula in 1963, the price of food has tracked below the broad CPI inflation rate. At the same time, many essential items have grown faster than food prices. To wit, food-at-home expenditures currently account for only 5 to 7 percent of spending, not the 33% assumed by Orshansky.
Therefore, because food prices are used as the basis for calculating the poverty line instead of a broader range of essential expenses, which have increased much more than food prices, the $31,200 poverty line is significantly understated. Additionally, the Mathematical Valley diminishes some incentives to earn more, thus resulting in affordability issues.

Arguing Against Green
While Michael Green makes a strong case that the poverty rate in this country is much higher than we think, and that affordability is becoming a hot topic, other opinions on Green’s article are worth considering. We summarize a few of them below.
- Child Care Costs Exaggerated: While childcare is costly, it isn’t part of most budgets once their children are past the age of four or five.
- Stuff is also cheaper: Green harps on things we buy that are more expensive, but some necessities, like clothing and electronics, are more affordable.
- Real incomes are rising. While a good argument, it raises questions about whether CPI is a good indicator of actual costs.
- What is the poverty line? To quote Alex Tabarrok of George Mason via the Washington Post: “He takes the poverty measure — and then turns it around and turns it into a middle-class measure,” Tabarrok said. “What do you need to be comfortable or thriving or middle class? Then, of course, you get a much bigger number. But to think that we today are living in some hellish landscape compared to our parents and even our grandparents is just a complete distortion of reality.”
Our Take- Summary
There isn't a single inflation rate or poverty line. We live in a diverse country with many different regional economies. Also, families have unique needs and desires that can’t be summarized in one number. That said, no matter the poverty line, many American households are struggling.
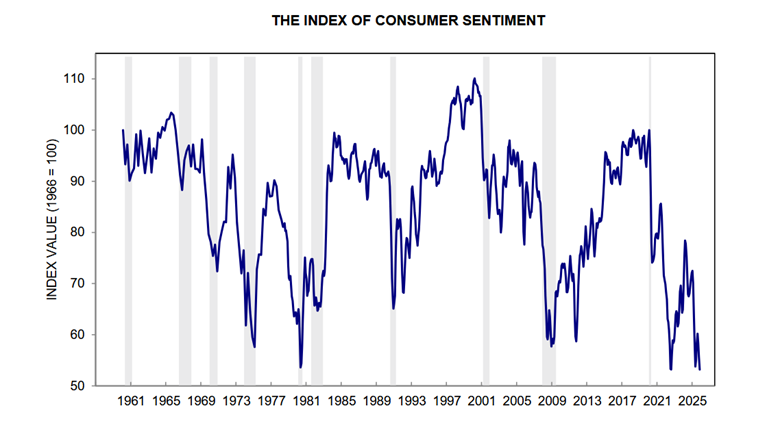
Remember when Obama ran on “Change”? He was followed by Trump, who ran twice on a similar message. The economic system remains broken for many Americans, and they are voicing concerns about affordability in election polls and sentiment surveys. Look at the graph below. According to the University of Michigan, consumer sentiment is at its lowest point since at least 1960!
Of course, diagnosing the affordability problem and fixing it are two different things. But it's hard to fix the problem without being aware of it. Hopefully, Michael Green’s article is raising enough debate and awareness on affordability to inspire action.
The post Affordability Crisis: Michael Green Challenges The Poverty Line appeared first on RIA.
Full story here Are you the author?You Might Also Like
 Leveraged ETFs: Yet Another Sign Of Rampant Speculation
2025-10-22
Not only is the market chasing the most speculative of assets, but it is employing record amounts of leverage to do so. Traditionally, investors use margin loans to gain leverage. More recently, however, leveraged ETFs allow investors to get leverage in one package. To wit, the graph below, courtesy of BofA, shows that there are …
 SRF: The Fed’s Newest Liquidity Backstop In Action
2025-10-20
In July of 2021, after the pandemic and the liquidity issues that arose in 2019, the Fed established a new liquidity backstop. This program, the Standing Repo Facility (SRF), allows financial institutions to borrow on a collateralized basis from the Fed. Unlike the Overnight Reverse Repurchase facility (ON RRP), which allows financial institutions to park …
Tags: Featured,newsletter