Nearly $3 trillion of notional stock options expire on Friday's open expiration (OPEX day). Over half of the OPEX volume is in S&P 500 options, with the remainder in single stock options. The graph below provides details on the split between puts and calls, and the strike prices and open interest of the options. Almost all of the puts are out of the money (strikes are below the S&P 500 price), while many calls are in the money. So, how might this record OPEX for August impact the market?
To answer, it's essential to understand that banks and brokers are often on the other end of these trades. These liquidity providers actively hedge positions to manage risk. One primary method is delta hedging.
Delta measures the change in the option value per change in the stock price. As the stock price increases toward the call options' strike price, the delta increases to 1.0. Therefore, given that many call option strike prices are below current prices, many have deltas at or near 1, and put deltas below 1. Thus, dealers will have limited hedging needs regarding the calls if the market rises. However, a decline could force dealers to reduce their hedges by effectively selling. Similarly, with many puts out of the money, selling to hedge the puts could add to the downside.
Consider the following OPEX scenarios:
- A steep decline forces dealers to reduce their call hedges and effectively sell. Furthermore, they will need to increase hedges on puts, which could further push the market lower.
- If the market exhibits low volatility, the impact will be minimal.
- A sharp increase will force some dealers to hedge more of the calls and add fuel to a rally. However, the amount of additional hedging is limited.

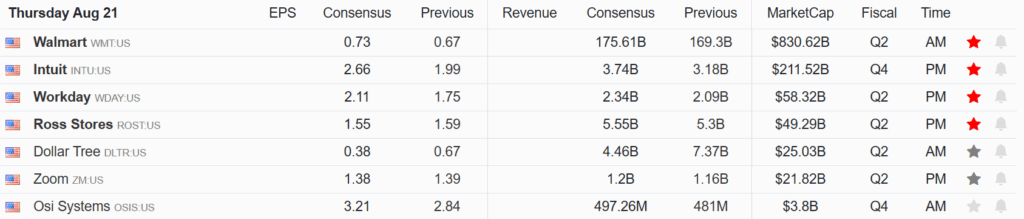
What To Watch Today
Earnings
Economy

Market Trading Update
Yesterday, we discussed the correlation between the Nasdaq and Bitcoin, with Bitcoin being a proxy for equity risk-taking. The reversal in the "momentum" trade on Tuesday was not unexpected, as over the last few weeks, we have noted the deviation between the chase for technology stocks at the expense of "everything else."
As we showed previously, areas like Healthcare, Staples, and Utilities were deeply oversold and out of favor as Technology stocks were pushed relentlessly higher. As we noted, the potential for a "rotation" trade had risen markedly, and we suggested it was just a function of time till that occurred. On Tuesday, the Nasdaq had its second-worst day since April 2025. While the S&P 500 fared well, momentum-chase names like $NVDA, $AVGO, $META, and $PLTR had sharp corrections.
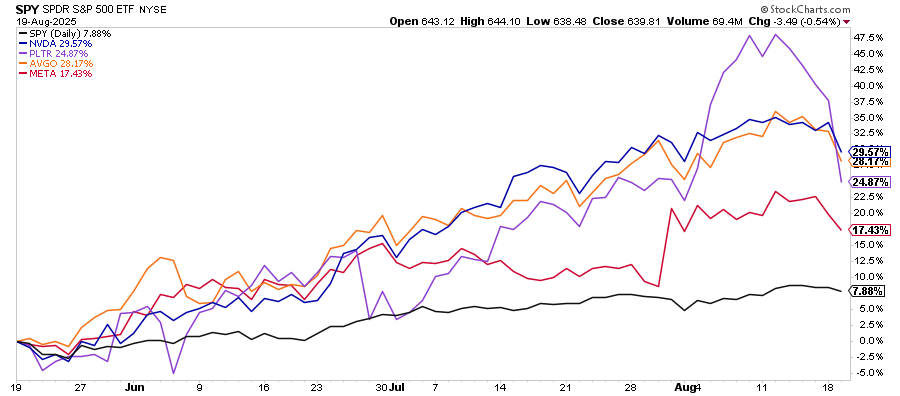
At the same time, while the "MoMo" leaders took a hit, healthcare stocks like $LLY, $ABBV, $UNH, and $JNJ saw gains.
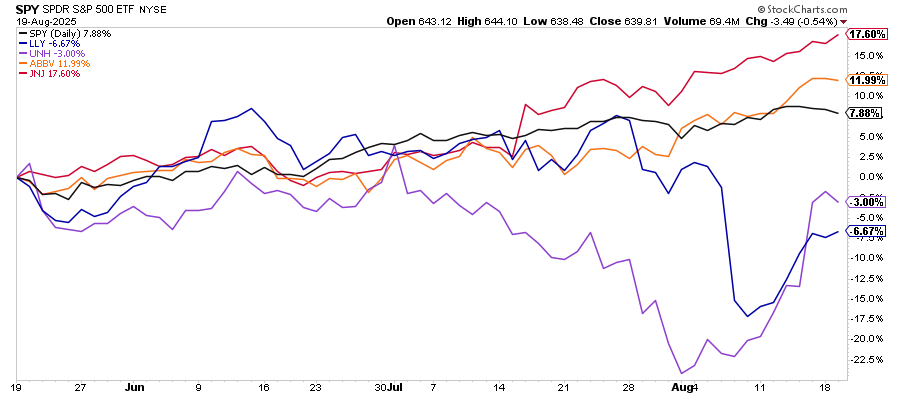
This rotation shows the value of monitoring both absolute and relative sector performance. In SimpleVisor, we provide this analysis daily, and the research we used when discussing the potential for this current market rotation. As shown, during the last two weeks, healthcare moved from the largest relative underperformer to more neutral, while technology, the largest relative outperformer, reversed course.

Does this rotation mean that the technology trade is over? No. But when things become too extended, in either direction, a reversal will always occur. These dislocations provide good opportunities for an astute investor to take profits to reduce risk when needed and allocate capital to those sectors that are now in a good position to catch rotational money flows. opportunities

Target Underwhelms: Blames Weak Consumer
The theme of retrenchment in personal consumption continued on Wednesday with Target's quarterly earnings report. Target reported its sales were $25.7 billion, a mere 1.1% increase year-over-year, but slightly short of Wall Street's $25.74 billion estimate. Comparable sales grew modestly by 0.3%, driven by a 4.7% rise in digital sales. Conversely, in-store comparable sales declined by 5.7%. EPS was $1.85, down 11.9% from the prior year and decently below the expected $2.30. The gross profit margin was 27.2%, lower than the previous year's 27.4% and analyst expectations of 28.7%. As judged by its guidance, Target executives remain concerned that recent consumer behaviors will continue. It revised its full-year EPS guidance downward to $8.30-$8.90 from $9.00-$9.70. Here are a few quotes from its executives:
We are taking a cautious approach to our outlook for the balance of the year, given the macro backdrop and ongoing investments to drive long-term growth.
The holiday shopping season is off to a really good start, but we are guiding for some conservatism.
In the first quarter, our team navigated a highly challenging environment
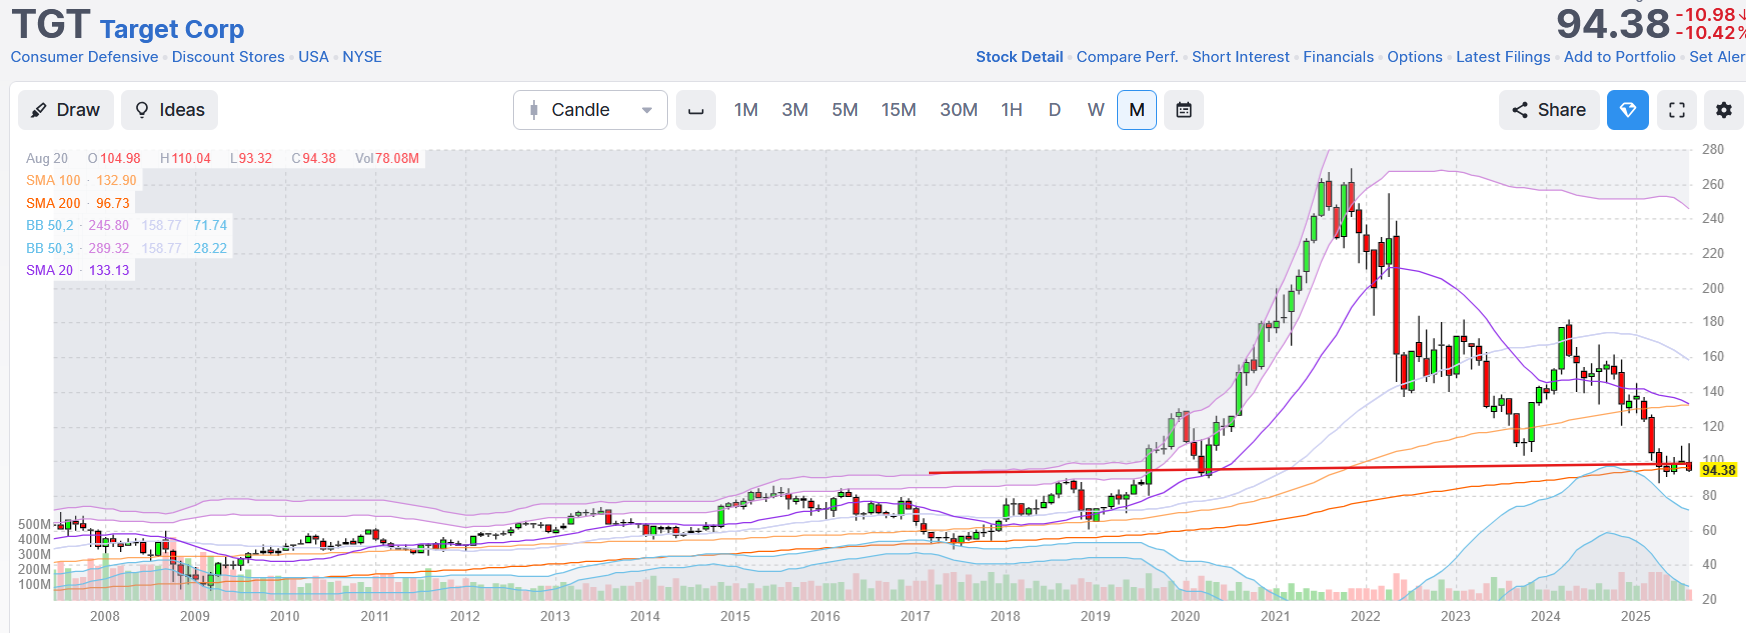
Target traded down over 10% on the earnings report and resignation of its CEO. It now sits at its Pandemic lows, as shown below. Check out our Commentary below on UPS, a stock also trading at its 2020 lows.
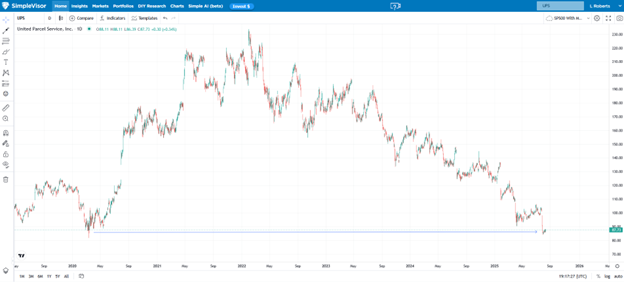
UPS Is At Pandemic Lows: Value Or Value Trap?
Shares of UPS are around the same price they were in March 2020, when the pandemic shut down economic activity. At the time, the global economy was decimated. In unprecedented fashion, the unemployment rate skyrocketed from 3.5% to 14.8% in one month. While the economic impact was tremendous, there was no relief in sight. The outlook for UPS was horrible, and its stock price reflected it.
After a couple of months, the market and economy began to rapidly recover with the help of excessive fiscal and monetary stimulus. Yet, despite the economic recovery since early 2020 and the stock market soaring by over 200% from the Covid lows, UPS shares are at the same price they had when the world was in an economic free fall.
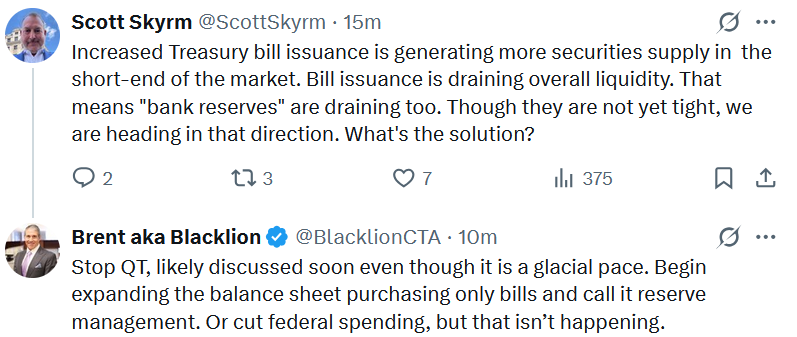
Tweet of the Day
“Want to achieve better long-term success in managing your portfolio? Here are our 15-trading rules for managing market risks.”
Please subscribe to the daily commentary to receive these updates every morning before the opening bell.
If you found this blog useful, please send it to someone else, share it on social media, or contact us to set up a meeting.
The post OPEX Overload: How 3 Trillion In Expirations Can Move Markets appeared first on RIA.
Full story here Are you the author?Tags: Featured,newsletter