Lance Roberts
My articles My offerMy siteAbout meMy videosMy books
Follow on:TwitterSeeking AlphaFacebookAmazon
Inside This Week's Bull Bear Report
- Sell Off Accelerates As Recession Fears Emerge
- How We Are Trading It
- Research Report - The Impact Of Stupidity
- Youtube - Before The Bell
- Market Statistics
- Stock Screens
- Portfolio Trades This Week
Market Volatility Spikes
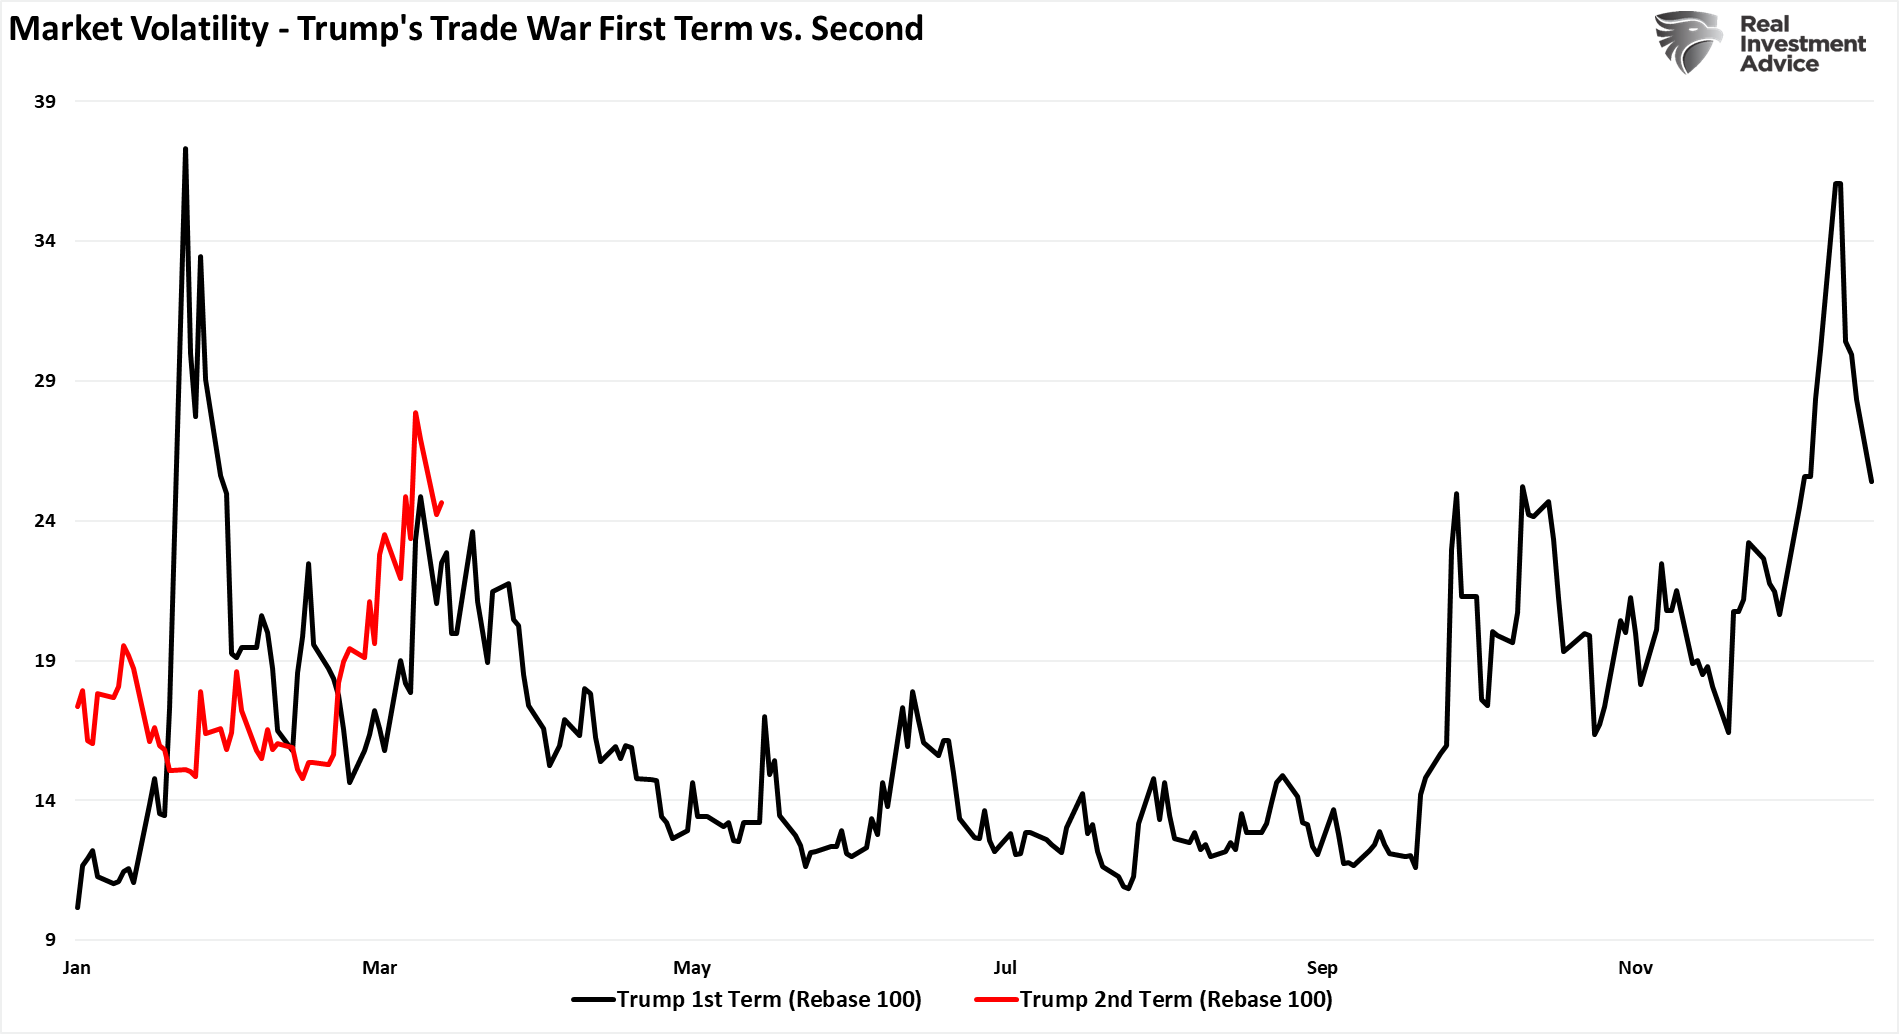
Last week, we discussed that the market continues to track Trump's first Presidential term as he launched a trade war with China.
"However, despite the deep levels of negativity, the current correction is well within the context of the volatility seen during Trump's first term as he engaged in a trade with China."
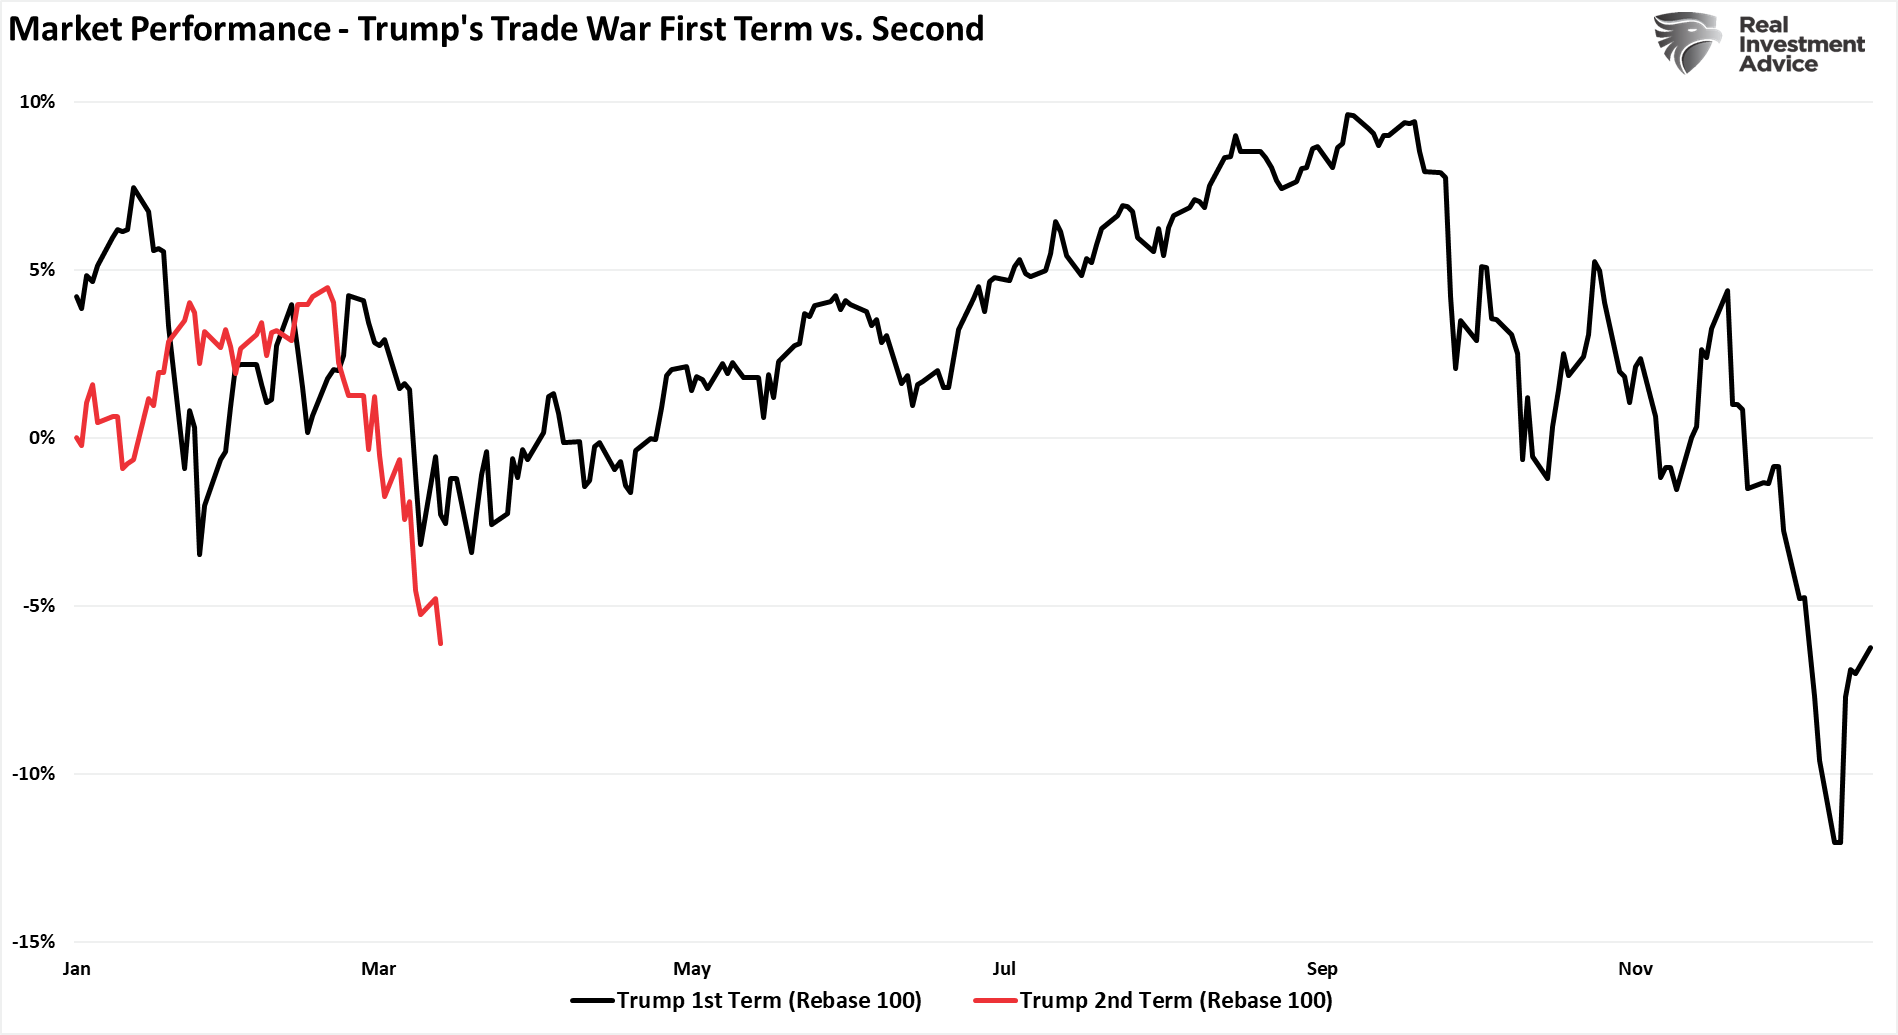
Overall market performance is also tracking closely to President Trump's first term as Wall Street tries to assess the impact of tariffs on earnings. The markets will complete that assessment soon, and they will rally once the outlook becomes firmer.
While Trump's tariffs and bearish headlines currently dominate investors' psychology, we must remember that corrections are a normal market function. Yes, the market is down roughly 9% from the peak, but we have seen these corrections repeatedly in the past. That does NOT mean a more extensive corrective process is not potentially in process. It only implies that markets are likely in a position for a technical rally to reverse the more extreme oversold conditions. As shown, the MACD and relative strength are currently at levels not seen since the October 2022 lows. Furthermore, the market has completed a 23.6% retracement of the rally from those lows, providing the support needed for a rally.
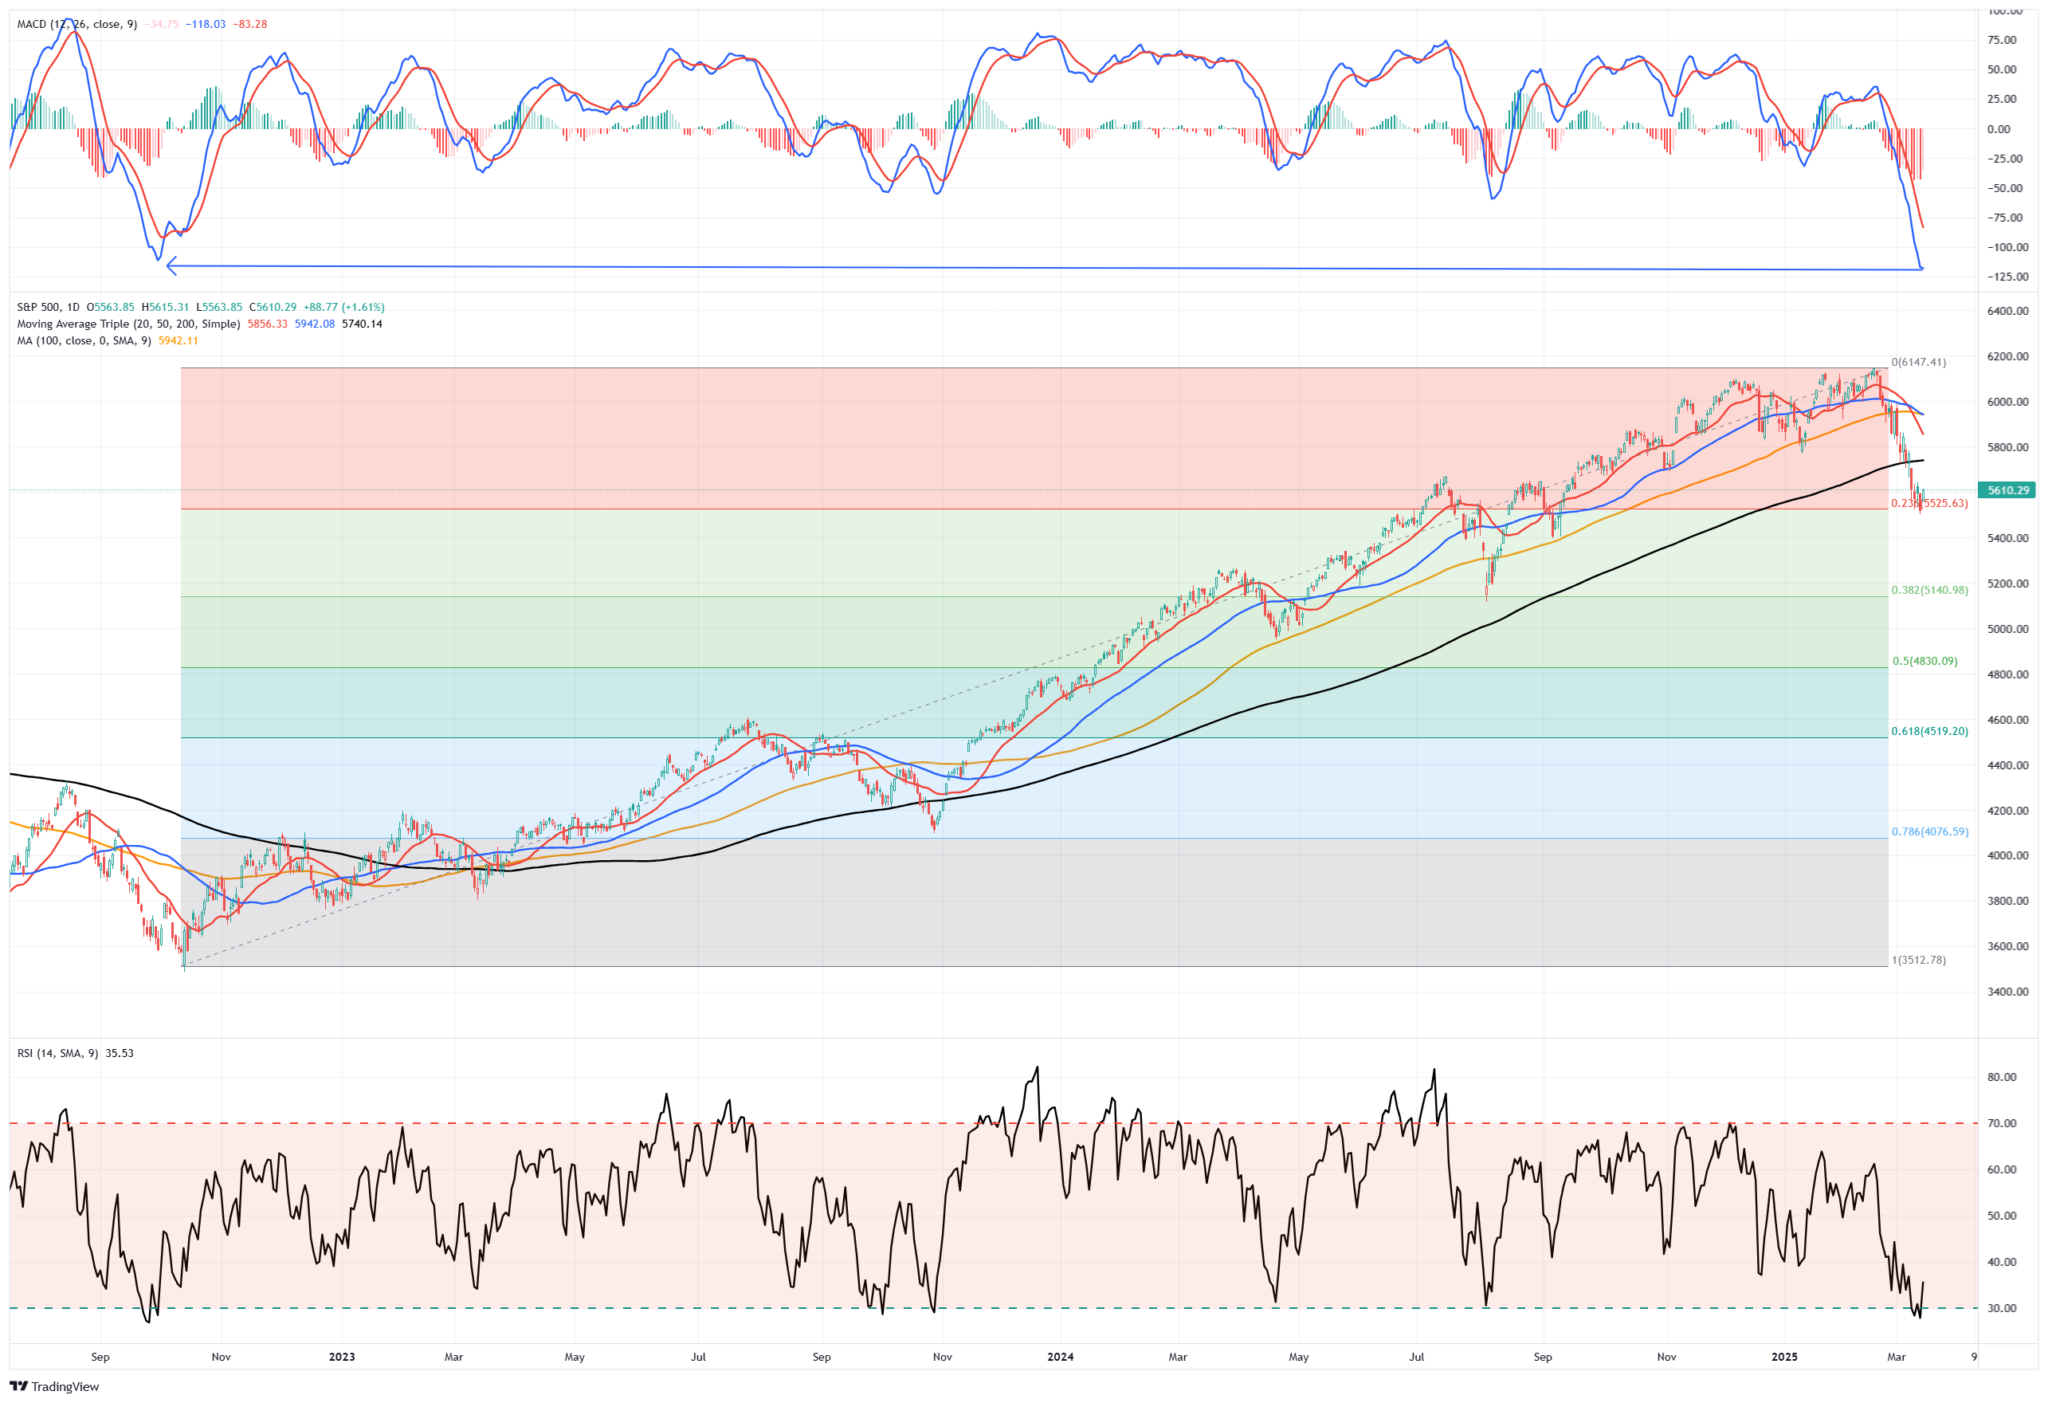
Let me be clear. I am not saying the markets have bottomed, and the next move is back to all-time highs. While that could be the case, other technical warnings suggest we could be in for a longer corrective/consolidative process. As such, we recommend using rallies to rebalance portfolios, reduce risk and leverage, and increase cash levels slightly until the markets confirm the bullish trend is re-established.
This correction process has been painful. However, it is crucial to remember how you felt during previous corrections and what actions you took. Were they the correct actions? If they weren't, then avoid potentially repeating past mistakes.
Volatility is the price we pay to invest. The hard part is avoiding volatility's behavioral impacts on our investing outcomes.
Need Help With Your Investing Strategy?
Are you looking for complete financial, insurance, and estate planning? Need a risk-managed portfolio management strategy to grow and protect your savings? Whatever your needs are, we are here to help.

Sell Off Accelerates As Recession Fears Emerge
Over the last couple of weeks, the market sell off eclipsed 9% on an intraday basis, sending investor sentiment plummeting to levels usually seen during more significant declines and previous bear markets. While the markets have had a phenomenal run over the past two years, investors seemed to have forgotten that markets tend to correct now and then.
The one thing you can always count on during the midst of a sell off is the media trying to formulate a headline to rationalize investor actions. During this particular decline, it was the return of a recession.
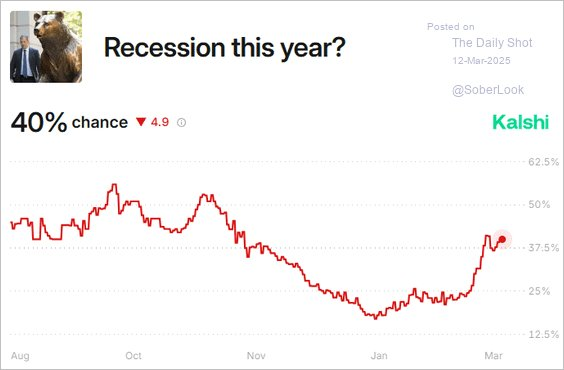
Of course, it is wise to remember that in 2022, we had the most anticipated recession ever, which failed to occur and preceded one of the strongest bull markets in recent history.
Is this time different? Maybe. However, few indicators suggest a recession is on the horizon. The Economic Composite Index (a comprehensive measure of economic activity comprised of more than 100 data points) is in expansionary territory. The EOCI index confirms the improvement in the 6-month rate of change in the Leading Economic Index (LEI), one of the best recession indicators, and current levels of economic growth. While economic growth will undoubtedly slow as all of the excess governmental spending under the previous Administration reverses, there is currently no recession warning in the data. That does not mean that such can not change in the future. However, for now, the risk of recession is extremely low.
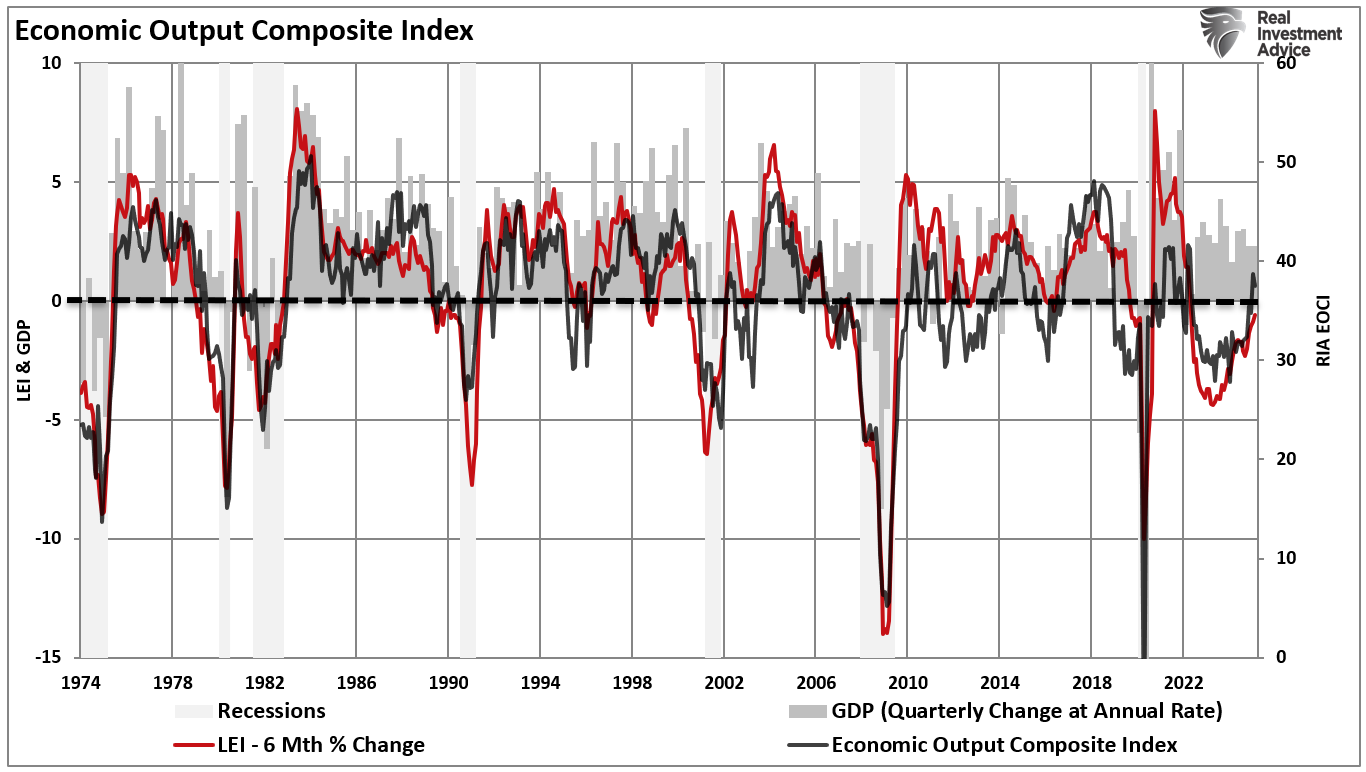
Adding to that analysis, the economically weighted ISM composite index is also in expansionary territory, suggesting a slower economic growth rate but no current risk of recession.

Yes, as we have discussed many times, there are reasons to expect the economy to continue to slow down. However, a slower growth environment is far different from a recession.
Does that mean we can not have a recession? No. I am only suggesting that the current weight of evidence suggests slower growth, not negative growth.
With that said, there are certainly implications for slower economic growth, primarily the change to the main driver of financial markets: earnings.
A better way to visualize this data is to look at the correlation between the annual change in earnings growth and inflation-adjusted GDP. There are periods when earnings deviate from underlying economic activity. However, those periods are due to pre- or post-recession earnings fluctuations. Economic and earnings growth are very close to the long-term correlation, but a slowdown will change that.

As such, given the high correlation between the market and the corporate profits to GDP ratio, as is currently the case, markets can detach from underlying economic realities due to momentum and psychology for brief periods. However, those deviations are unsustainable in the long term, and corporate profitability, as discussed, is derived from underlying economic activity.

Such is what has been happening over the past couple of weeks.
A Repricing Of Valuations
While media headlines were quick to jump on "recession" headlines, the reality, as shown below, was that the recent sell off was realigning overly bullish markets for future earnings growth. The deviation of the annual rate of change of the market from the rate of change of forward earnings was quite significant.
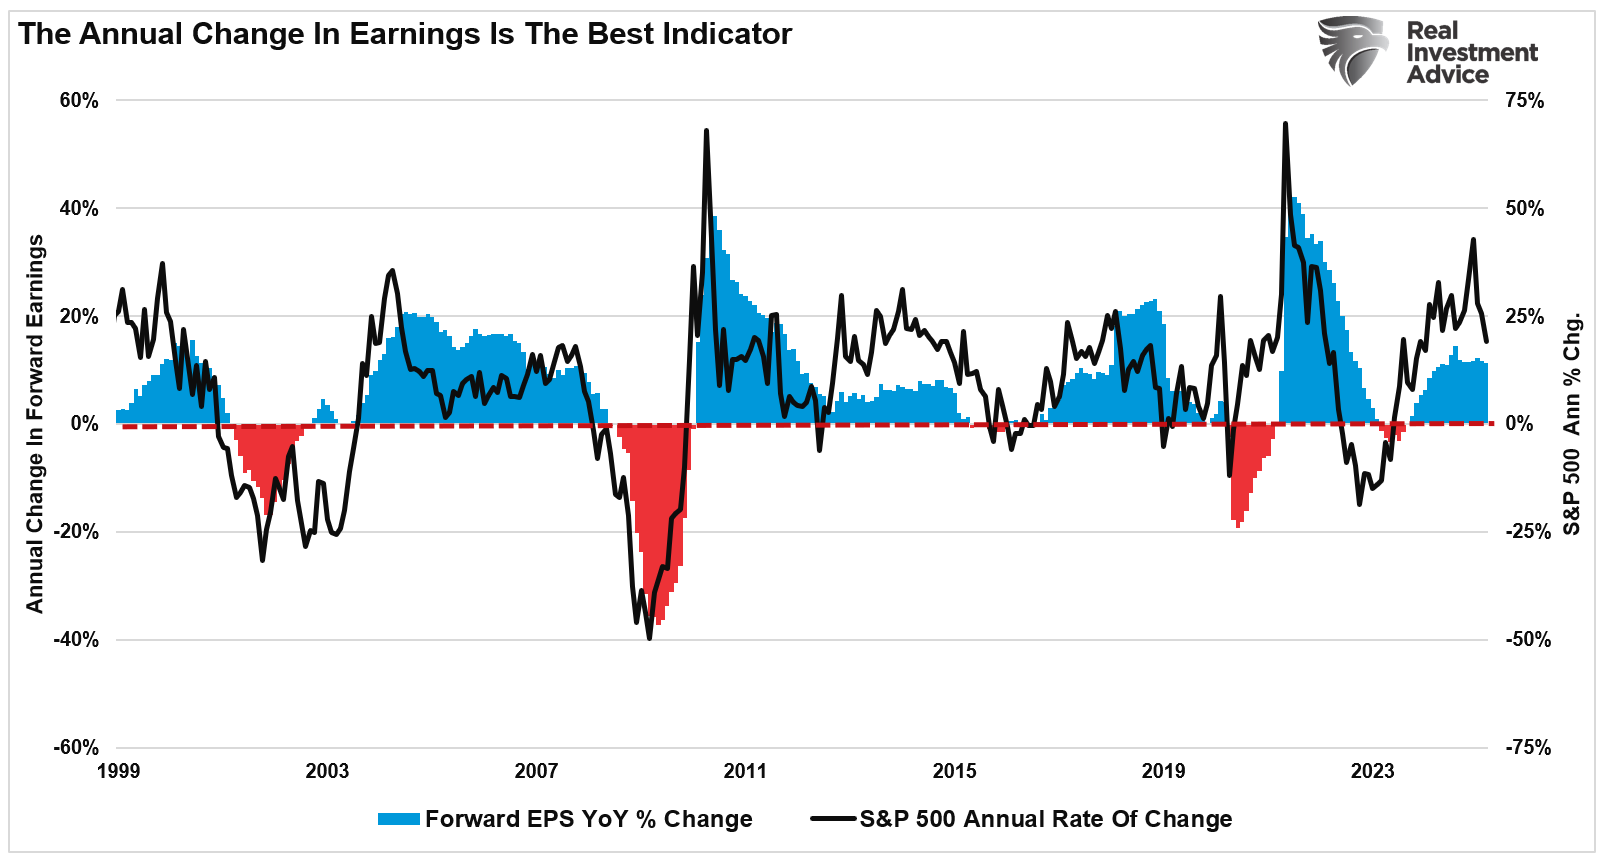
However, the sell-off has not resulted from a sharp decline in expected earnings growth, which would be a byproduct of a recession. Instead, it has been a reduction in valuations to align with expected earnings.
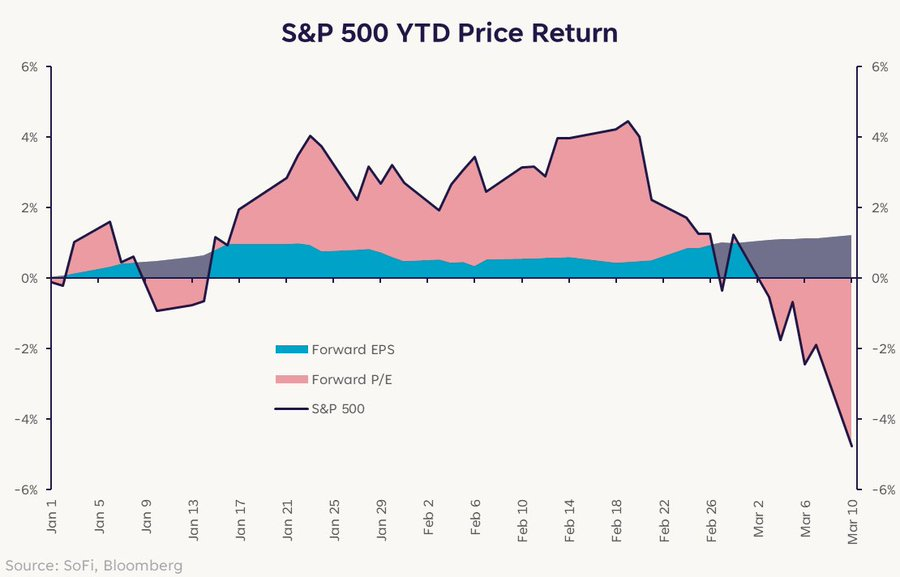
As noted just a few weeks ago, the recent sell off and the repricing of valuations were not unexpected.
"We see the same deviation between the annual rate of change of the S&P 500 versus actual reported earnings. As shown below, there was a sharp expansion in the market’s price without an equally substantial increase in underlying earnings per share. Such resulted in a dramatic rise in multiple expansions over the last two years. Analysts must increase their “manufactured” estimates to justify those elevated valuations and catch up with the market’s price. However, it is more likely that the growth rate of equity prices will slow substantially to allow earnings to catch up with valuations."

While the daily headlines of tariffs and spending cuts are certainly weighing on investor psychology, earnings expectations remain the biggest driver of the market. As noted above, given that previous valuations exceeded the economy's ability to generate the required earnings, the recent sell off is a healthy process. There is still more work to be done for the market to reach "fair" valuations in the current environment, but that does not mean the markets must decline sharply. An extended period of consolidation in the markets with little to no return would achieve the same revaluation process.

What To Expect Next
With the current Administration pushing hard on its agenda, on-again, off-again tariffs, spending cuts, and potential increases in unemployment make it difficult for Wall Street to estimate the future impact on earnings. As we have discussed since last year, forward estimates for the economy and earnings were far too optimistic, and now Wall Street has to pare those outlooks back. That process has been slowly in the works over the last two months.

In the future, investors must determine when valuations have re-aligned with economic realities. As such, we continue to expect further bouts of market volatility.
"If economic growth slows in 2025, it could dampen corporate revenue, reduce investment activity, and impact stock prices. Much like a “Curb Your Enthusiasm” episode where things take an unexpected turn, the risk of weaker growth looms large, potentially catching overconfident investors off guard."
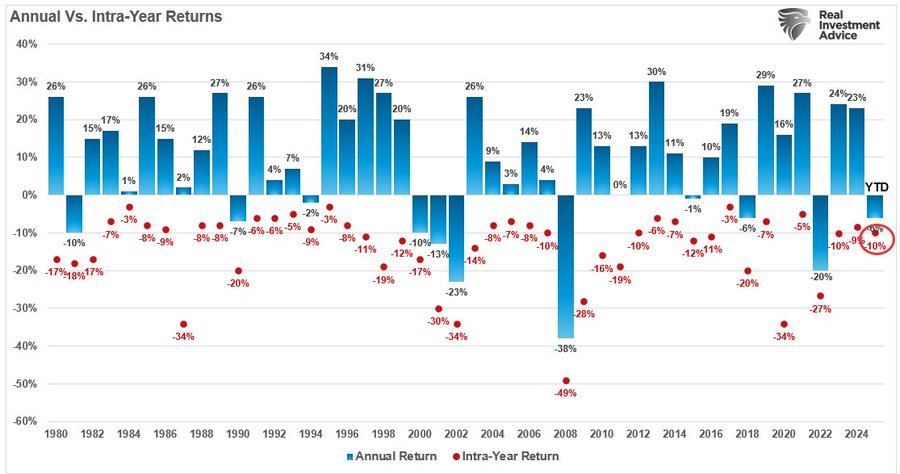
The current market sell off is part of that process of realigning valuations. While the correction has undoubtedly woken up more complacent investors, the decline is well within the confines of a regular annual market correction. We expect similar declines this summer and/or later in the year.
Since valuations have likely not been discounted enough for a slower-growth economic environment, investors need to be prepared for a more frustrating market as forward earnings growth is reassessed. Does that mean a bear market is inevitable? No. But it does not rule out the possibility. Such is why we must remain focused on managing risk and allocations accordingly.
However, the good news is that once that revaluation process is completed, the markets will rise again. The timing of the bull market's return remains uncertain, but one thing remains true: "This period will end."
What is critical for investors is not to extrapolate the current market environment into a never-ending cycle. Corrections and bear markets occur regularly, but they end. As investors, we must set aside the narratives and focus on the underlying fundamentals. Crucially, we must be willing to buy when it feels the worst.
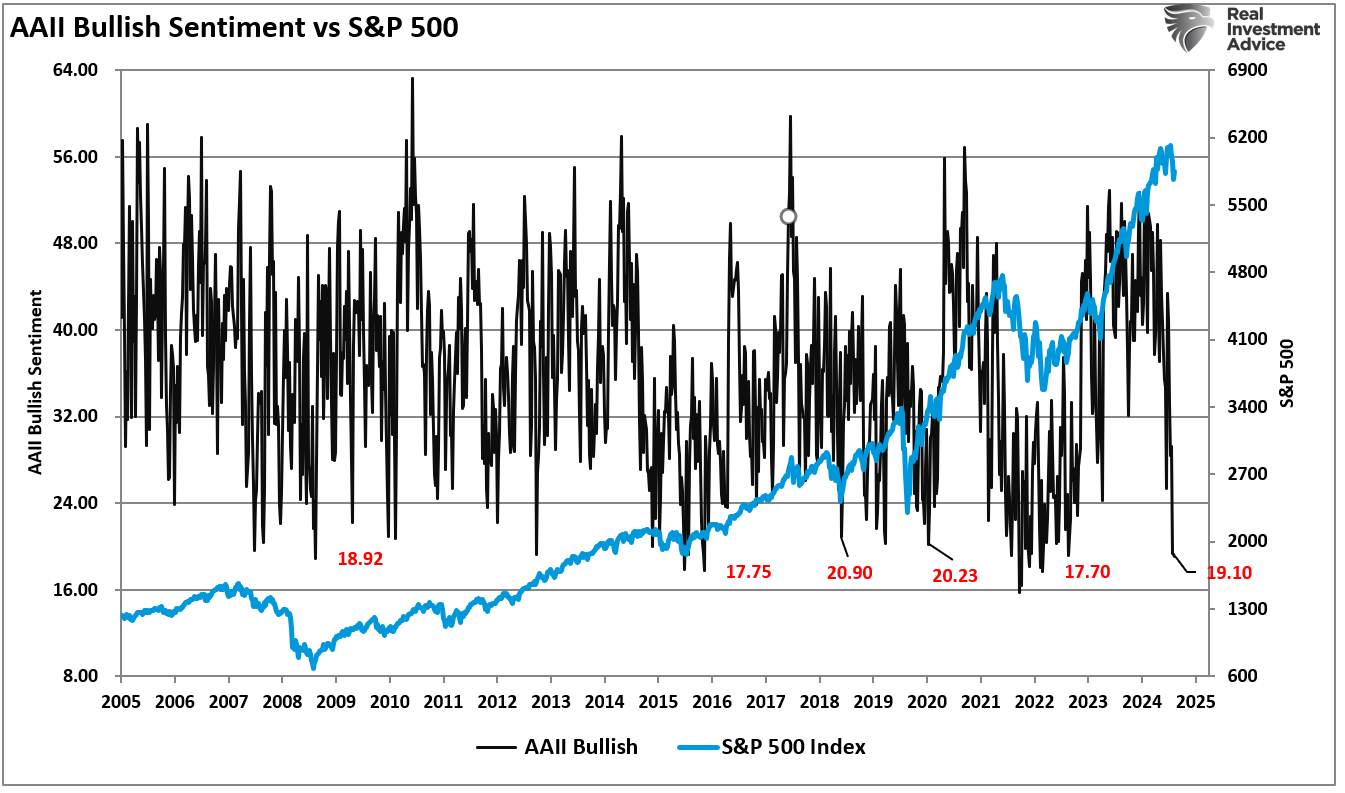
Currently, investors are certainly feeling about as negative as ever. From a contrarian investing viewpoint, such negativity has often provided the best money-making opportunities for those willing to turn against the herd.
Does that mean there is no risk of further downside? No.
This is why we do not suggest going "all in." A better approach is taking small bites of fundamentally compelling stocks. Look for companies with superior earnings growth that are trading at a discount to the market. Also, the recent correction provides an opportune time to add new capital to portfolios, rebalance current holdings that are underweight targets, and reduce overweights.
Most critical to long-term investing success is not letting market volatility derail you from following your investment strategy.
How We Are Trading It
Let me repeat what we wrote last week, as it remains even more compelling this week.
"We don’t have much history regarding tariffs and the stock market. However, it is likely best to avoid media-driven narratives and focus on managing your portfolio. As we warned previously, media headlines are often wrong."
“That does not mean that things won’t change in the future. However, using media headlines to make portfolio decisions has repeatedly turned out poorly. If the recent market volatility is weighing on you, and you “feel” you must “do something,” take very small steps.”
- Tighten up stop-loss levels to current support levels for each position.
- Hedge portfolios against significant market declines.
- Take profits in positions that have been big winners
- Sell laggards and losers
- Raise cash and rebalance portfolios to target weightings.
“Remembering that portfolio management is not an “all or none” process is crucial. It is about positioning yourself to minimize emotional decisions so you can find the “opportunity that exists in crisis.”
The markets are deeply oversold, sentiment is bearish, and sellers are exhausted. Such is historically a good setup for a rally to sell into, reduce risk, and prepare for what might be a more volatile market.
Feel free to reach out if you want to navigate these uncertain waters with expert guidance. Our team specializes in helping clients make informed decisions in today’s volatile markets.
Have a great week.
Research Report

Subscribe To “Before The Bell” For Daily Trading Updates
We have set up a separate channel JUST for our short daily market updates. Please subscribe to THIS CHANNEL to receive daily notifications before the market opens.
Click Here And Then Click The SUBSCRIBE Button
Subscribe To Our YouTube Channel To Get Notified Of All Our Videos
Bull Bear Report Market Statistics & Screens

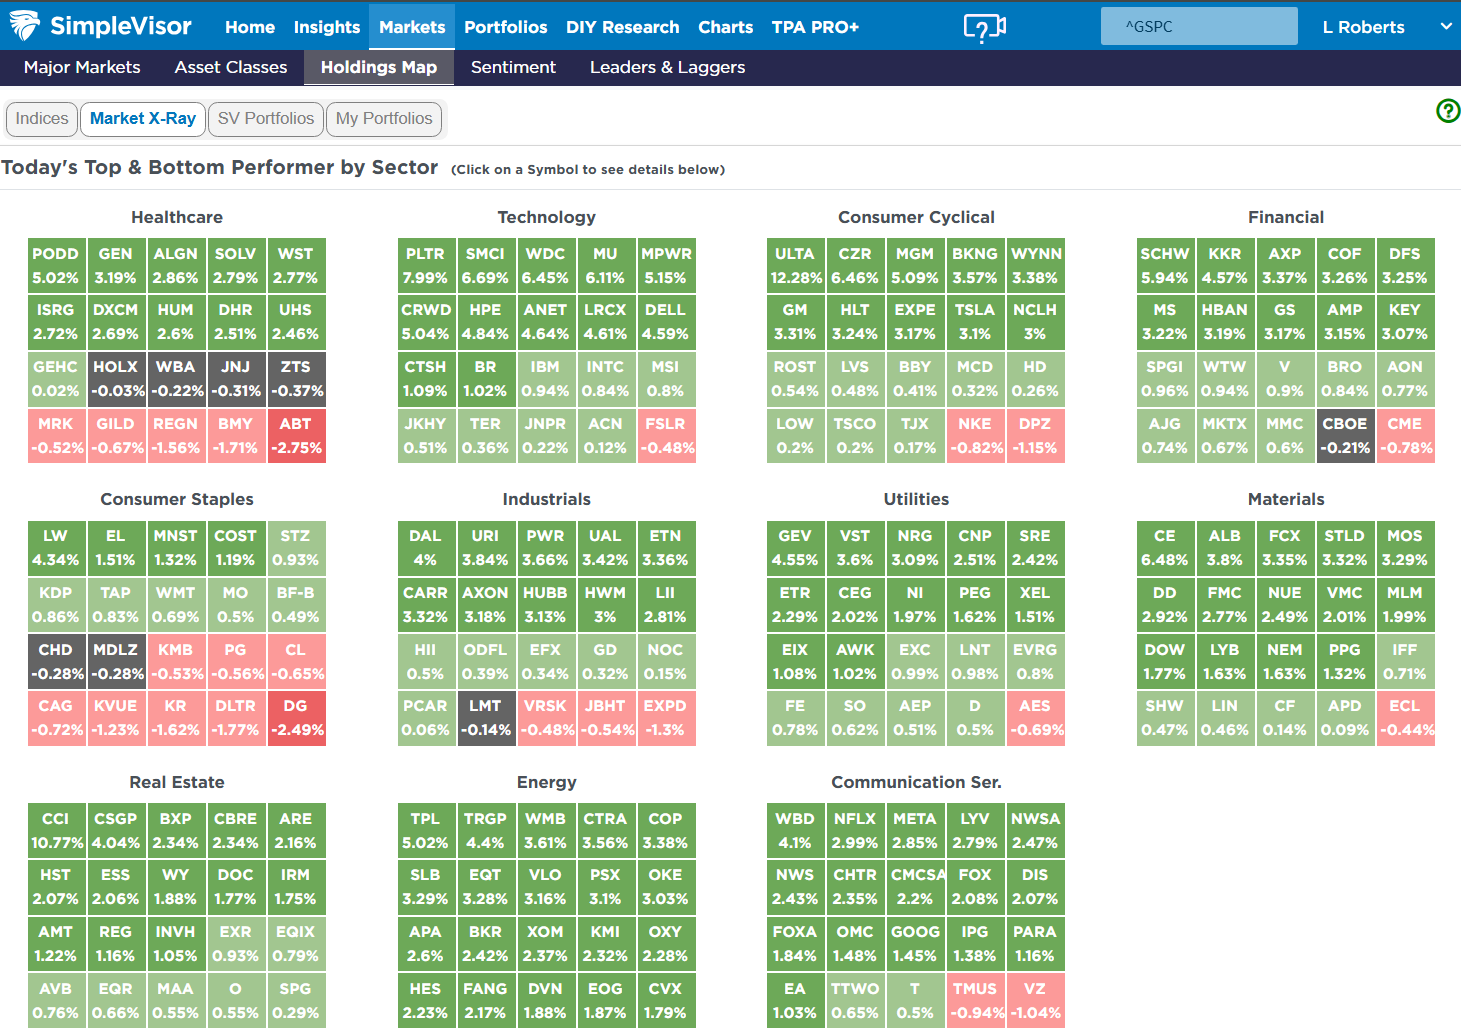
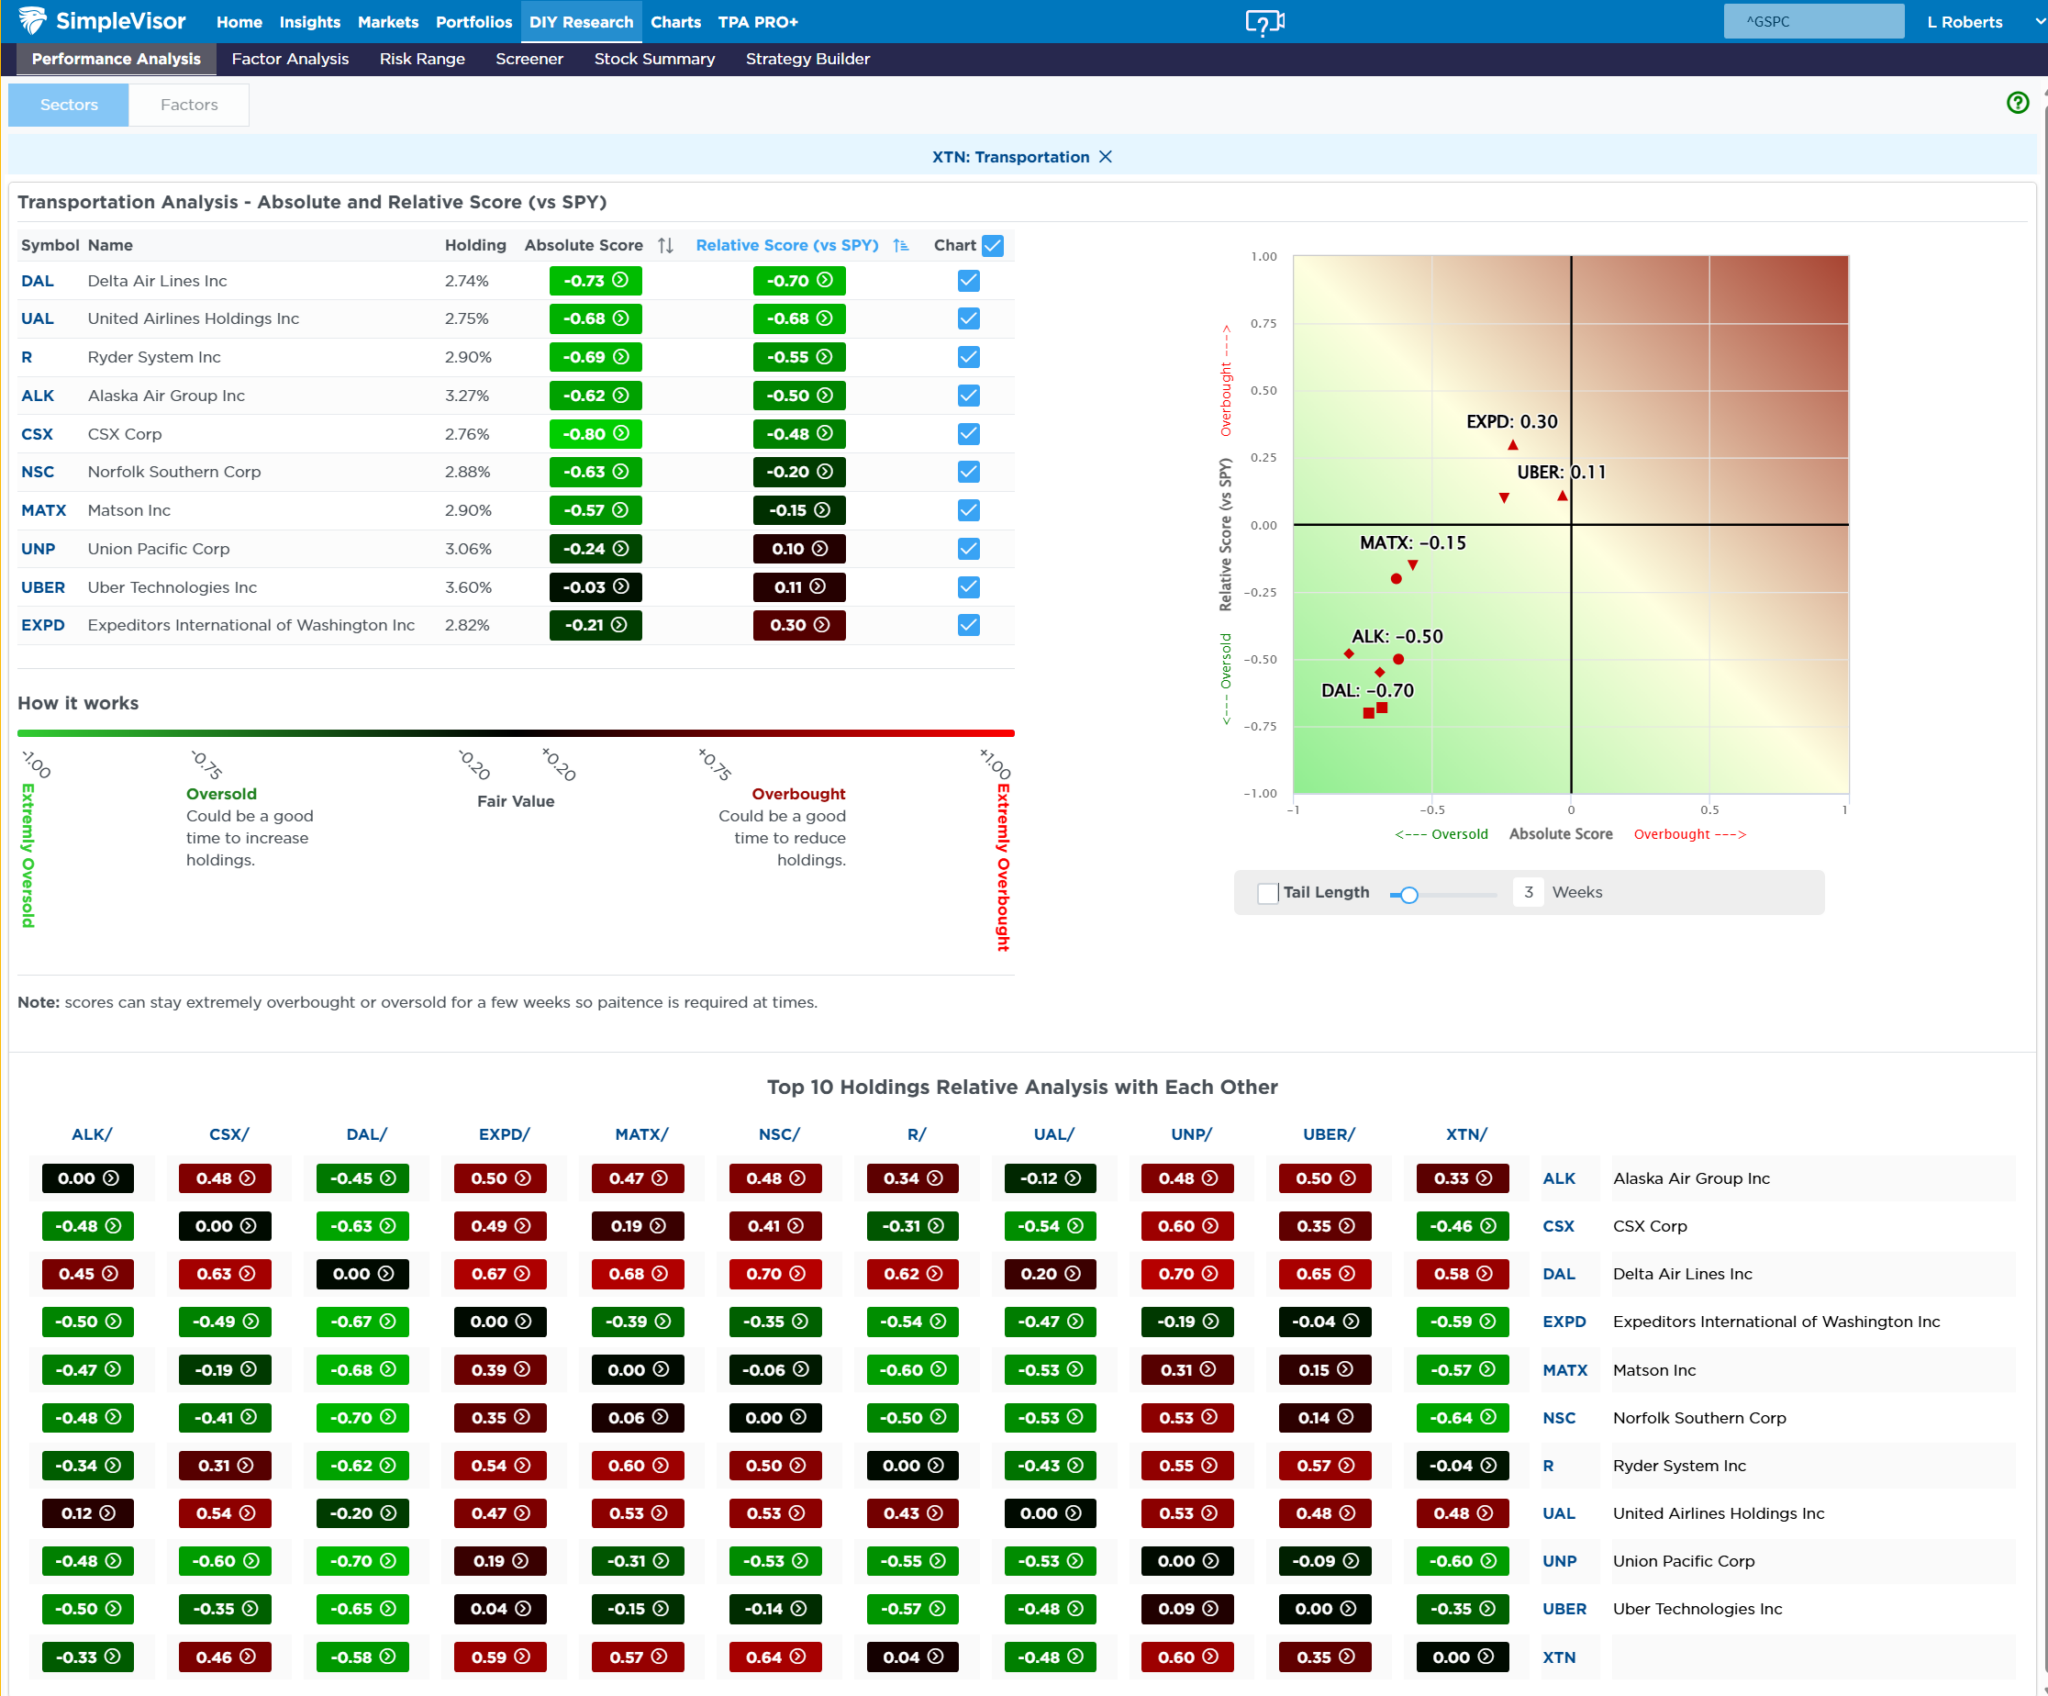
SimpleVisor Top & Bottom Performers By Sector
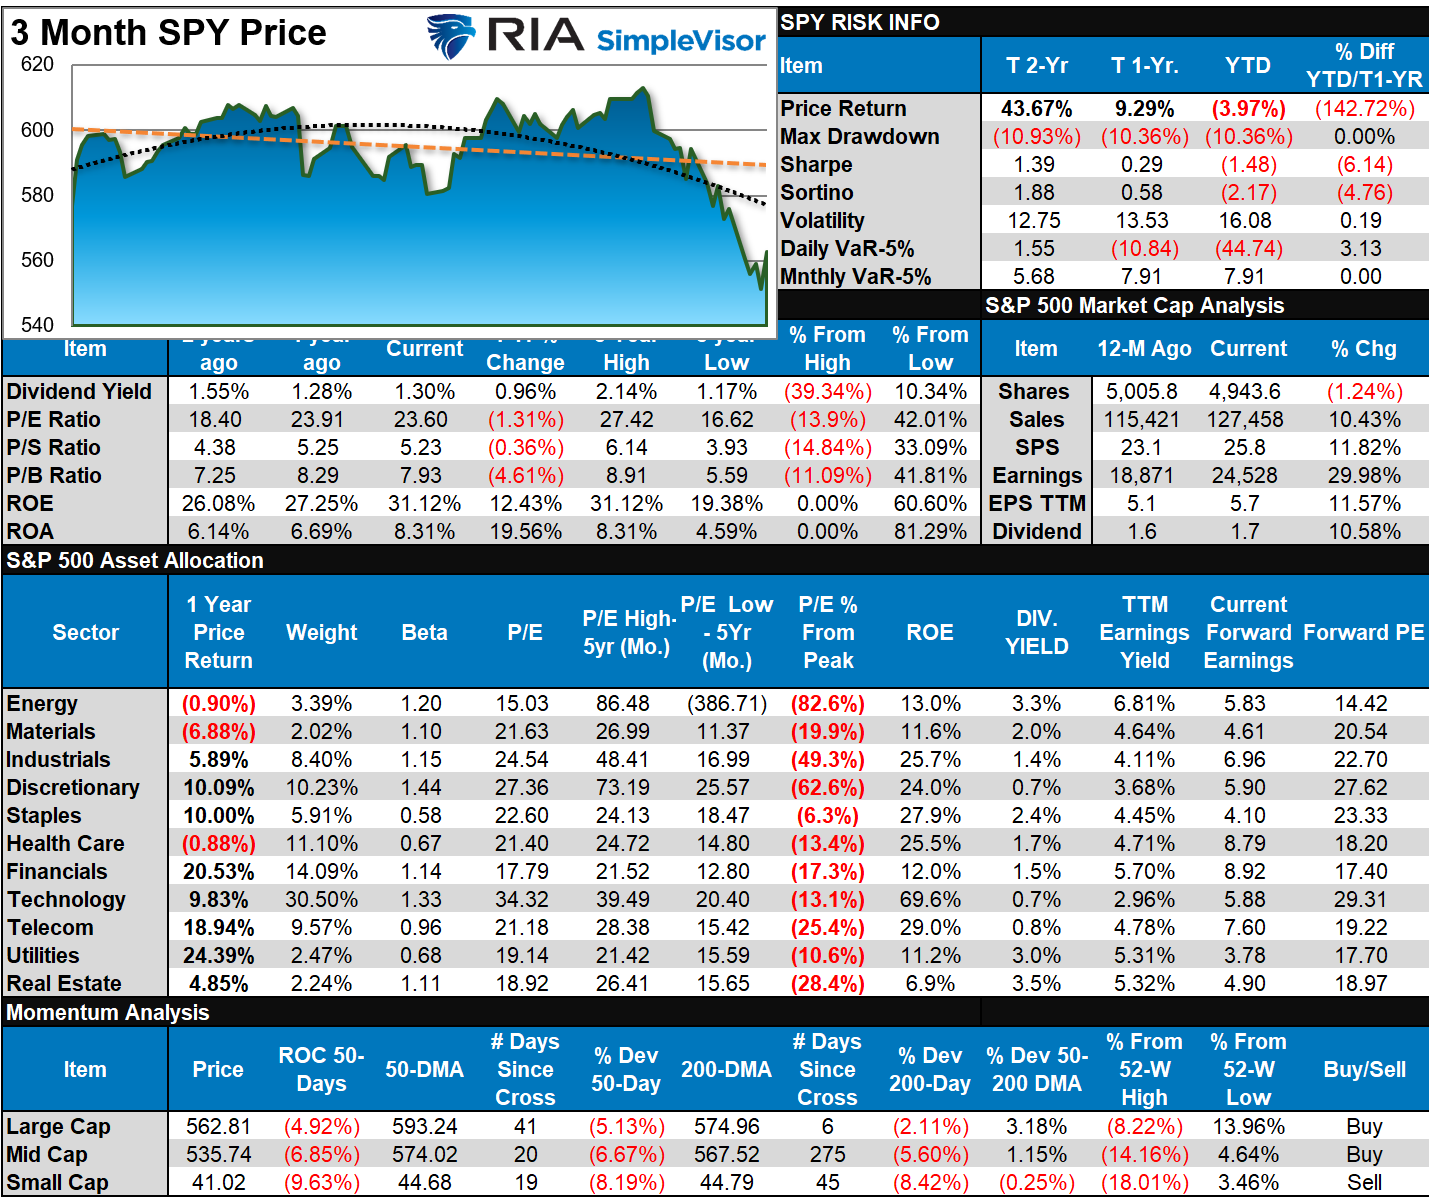
S&P 500 Weekly Tear Sheet
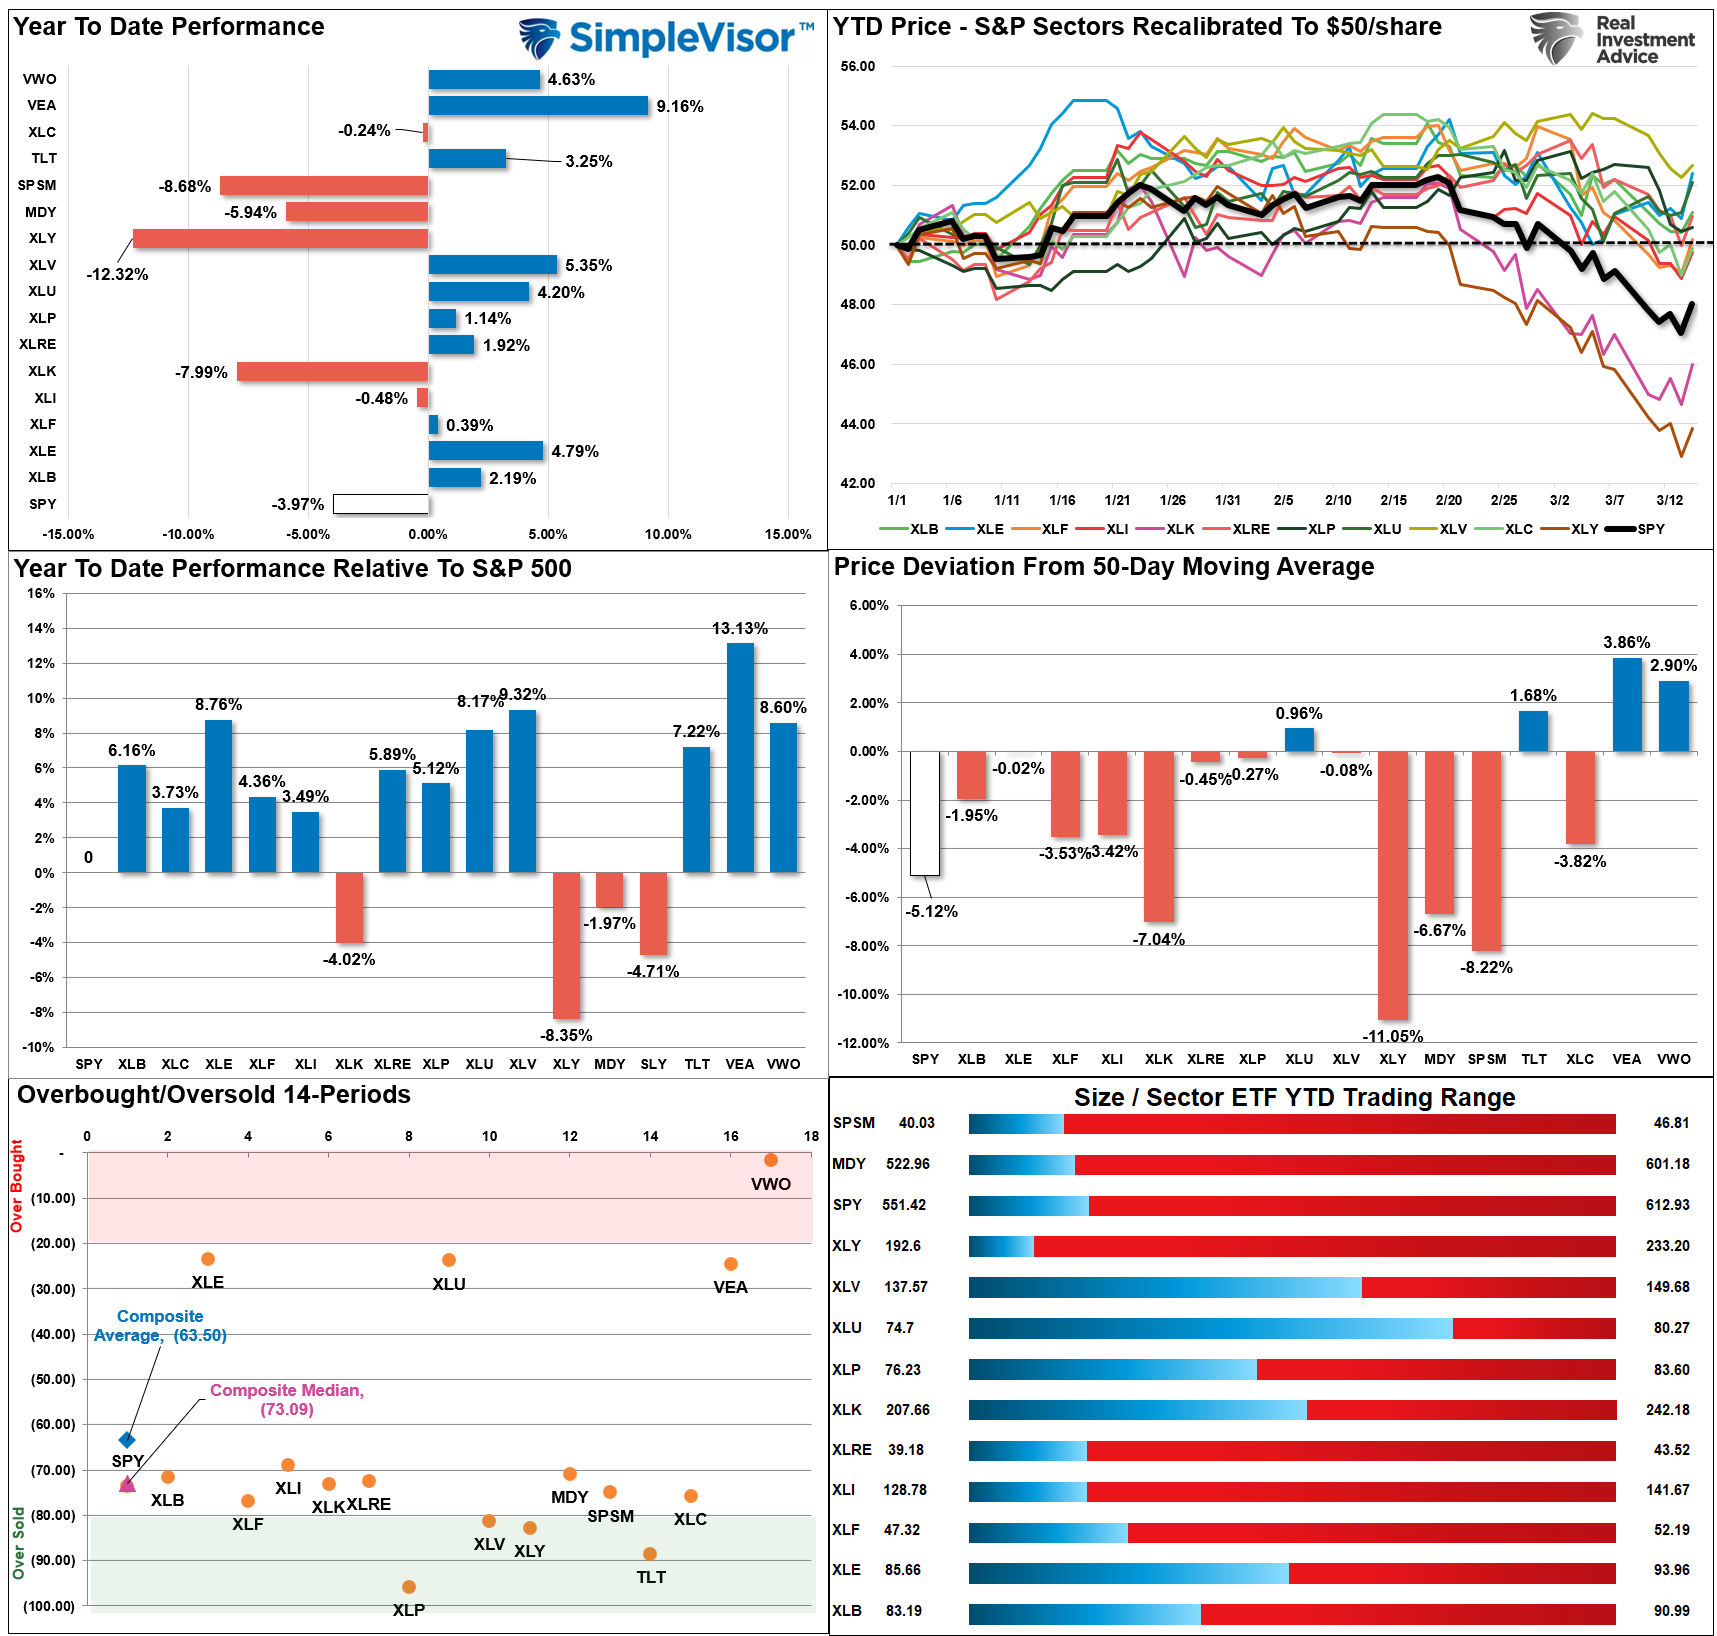
Relative Performance Analysis
As noted last week, stocks struggled amid increased policy uncertainty from the White House. "Tariff on, Tariff off" makes it difficult for investors to assess the impact on future earnings growth. However, with most markets and sectors decently oversold, the rally that started on Friday appears to be a short-term bottom. If the market can rally again on Monday, it will likely bring buyers into the market. I expect to see a rotation from International and Emerging markets back into U.S. holdings and a further dollar rally.
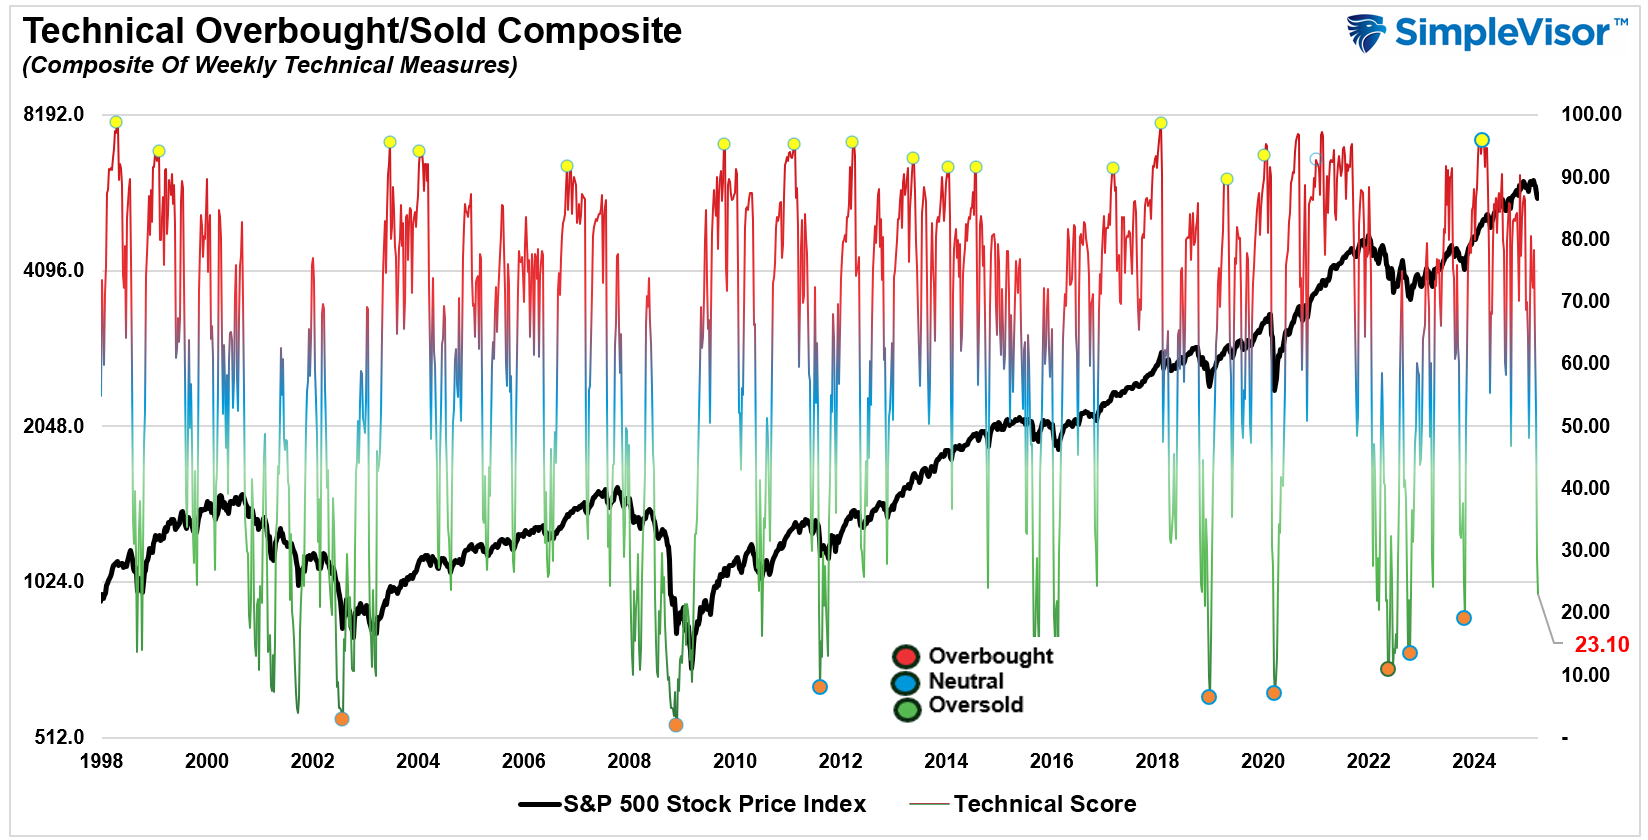
Technical Composite
The technical overbought/sold gauge comprises several price indicators (R.S.I., Williams %R, etc.), measured using “weekly” closing price data. Readings above “80” are considered overbought, and below “20” are oversold. The market peaks when those readings are 80 or above, suggesting prudent profit-taking and risk management. The best buying opportunities exist when those readings are 20 or below.
The current reading is 23.10 out of a possible 100.
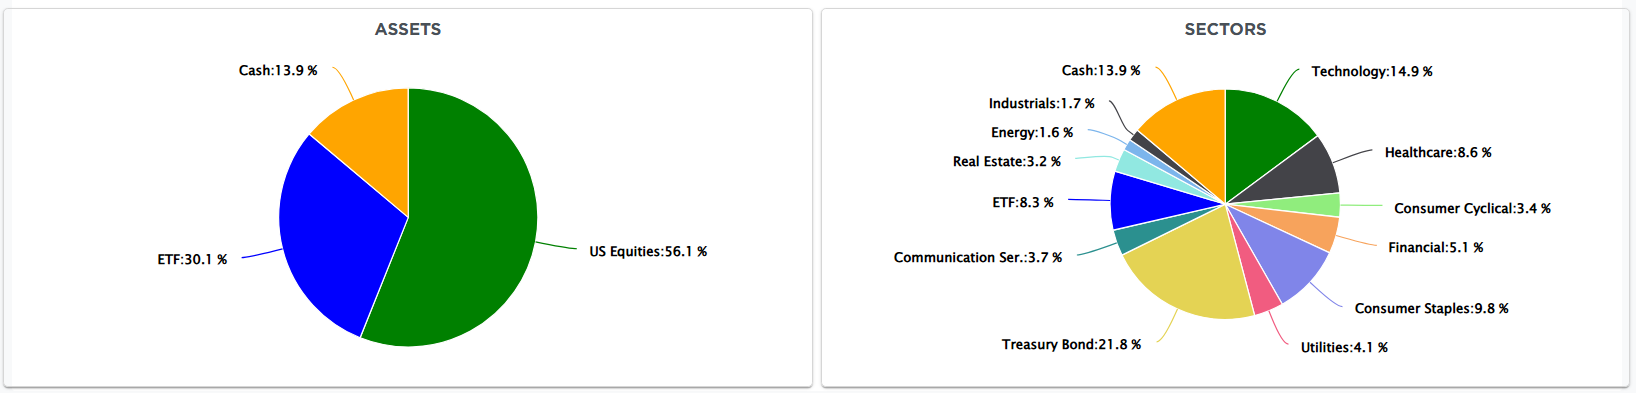
Portfolio Positioning “Fear / Greed” Gauge
The “Fear/Greed” gauge is how individual and professional investors are “positioning” themselves in the market based on their equity exposure. From a contrarian position, the higher the allocation to equities, the more likely the market is closer to a correction than not. The gauge uses weekly closing data.
NOTE: The Fear/Greed Index measures risk from 0 to 100. It is a rarity that it reaches levels above 90. The current reading is 48.91 out of a possible 100.

Relative Sector Analysis
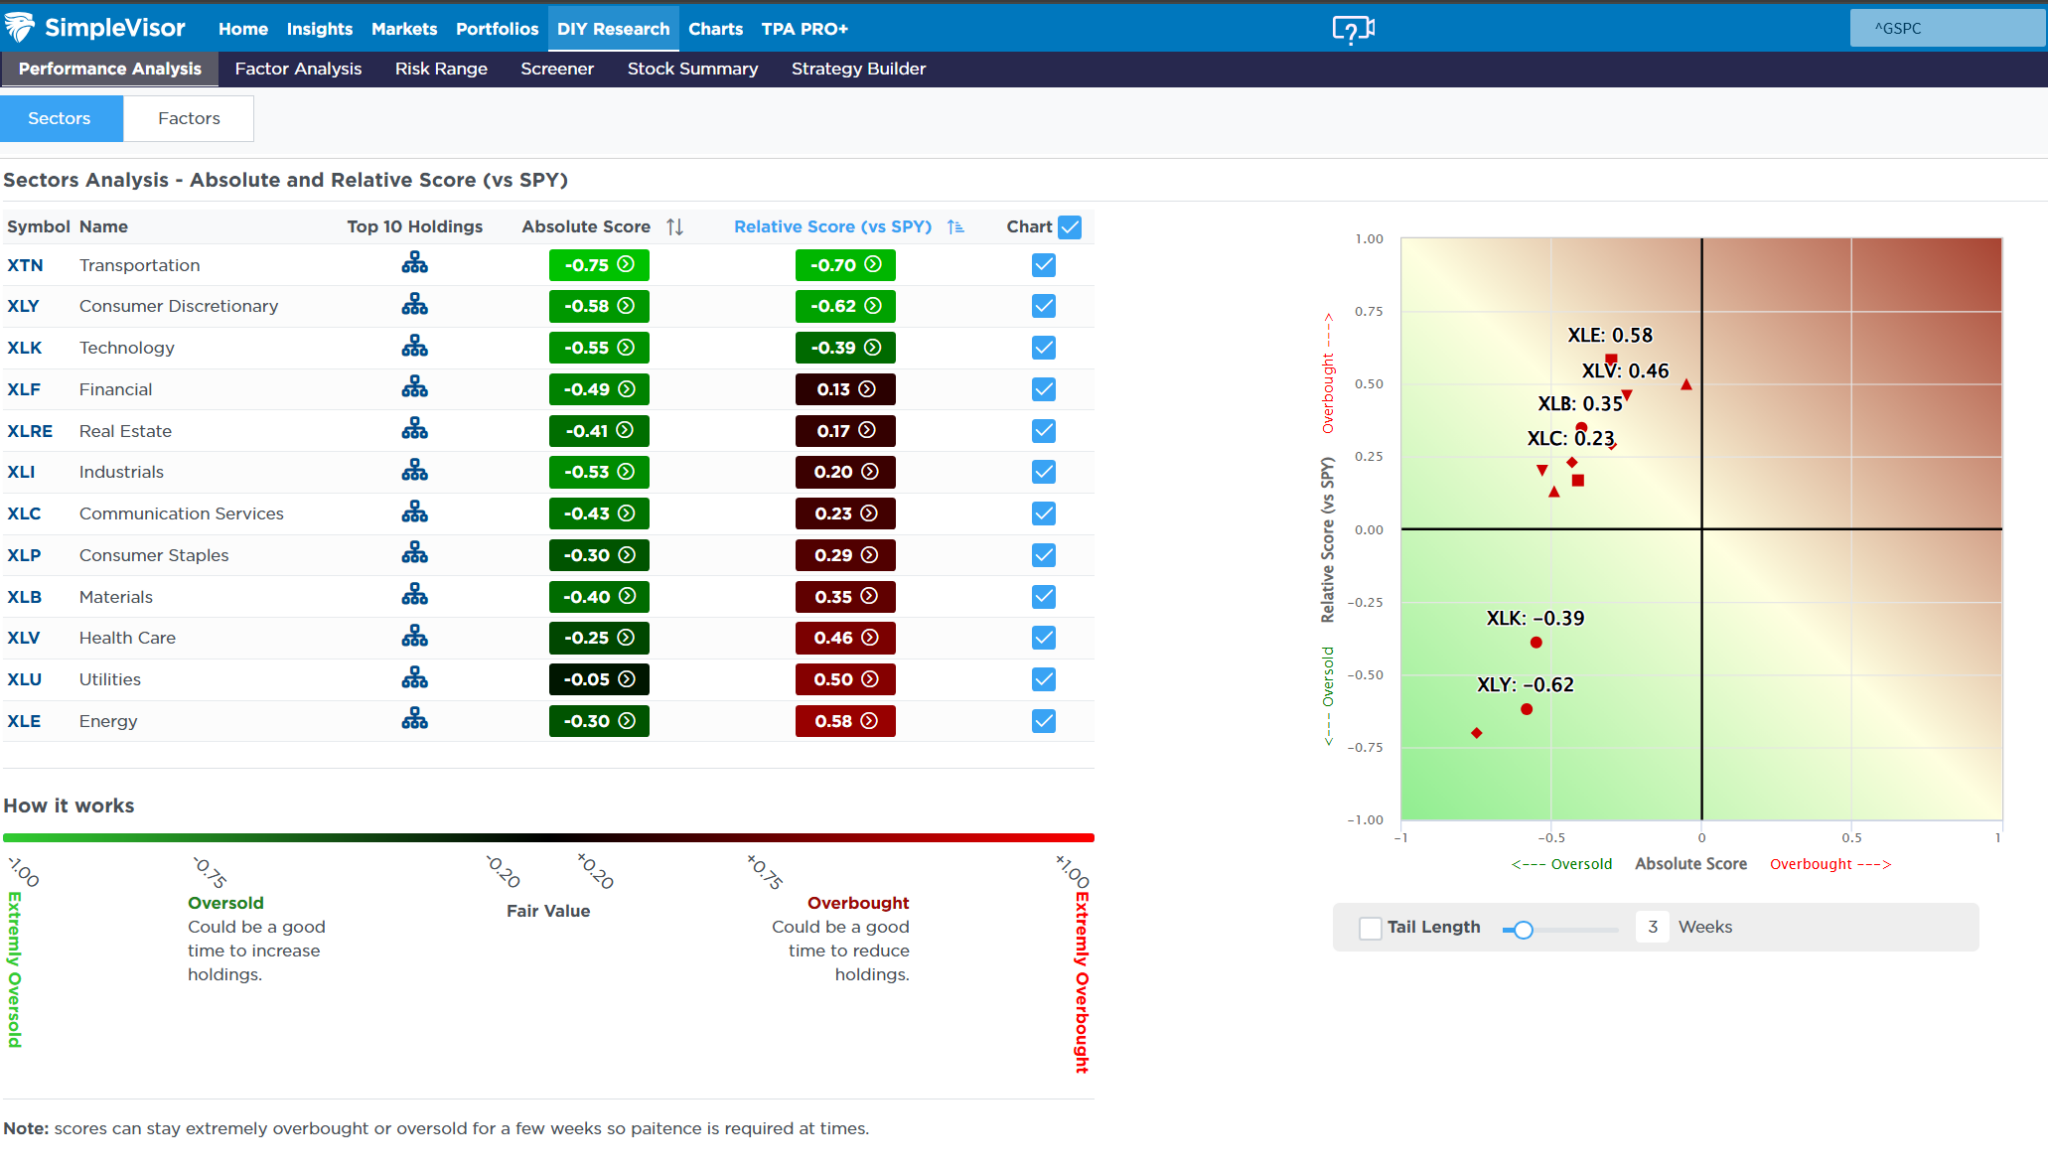
Most Oversold Sector Analysis
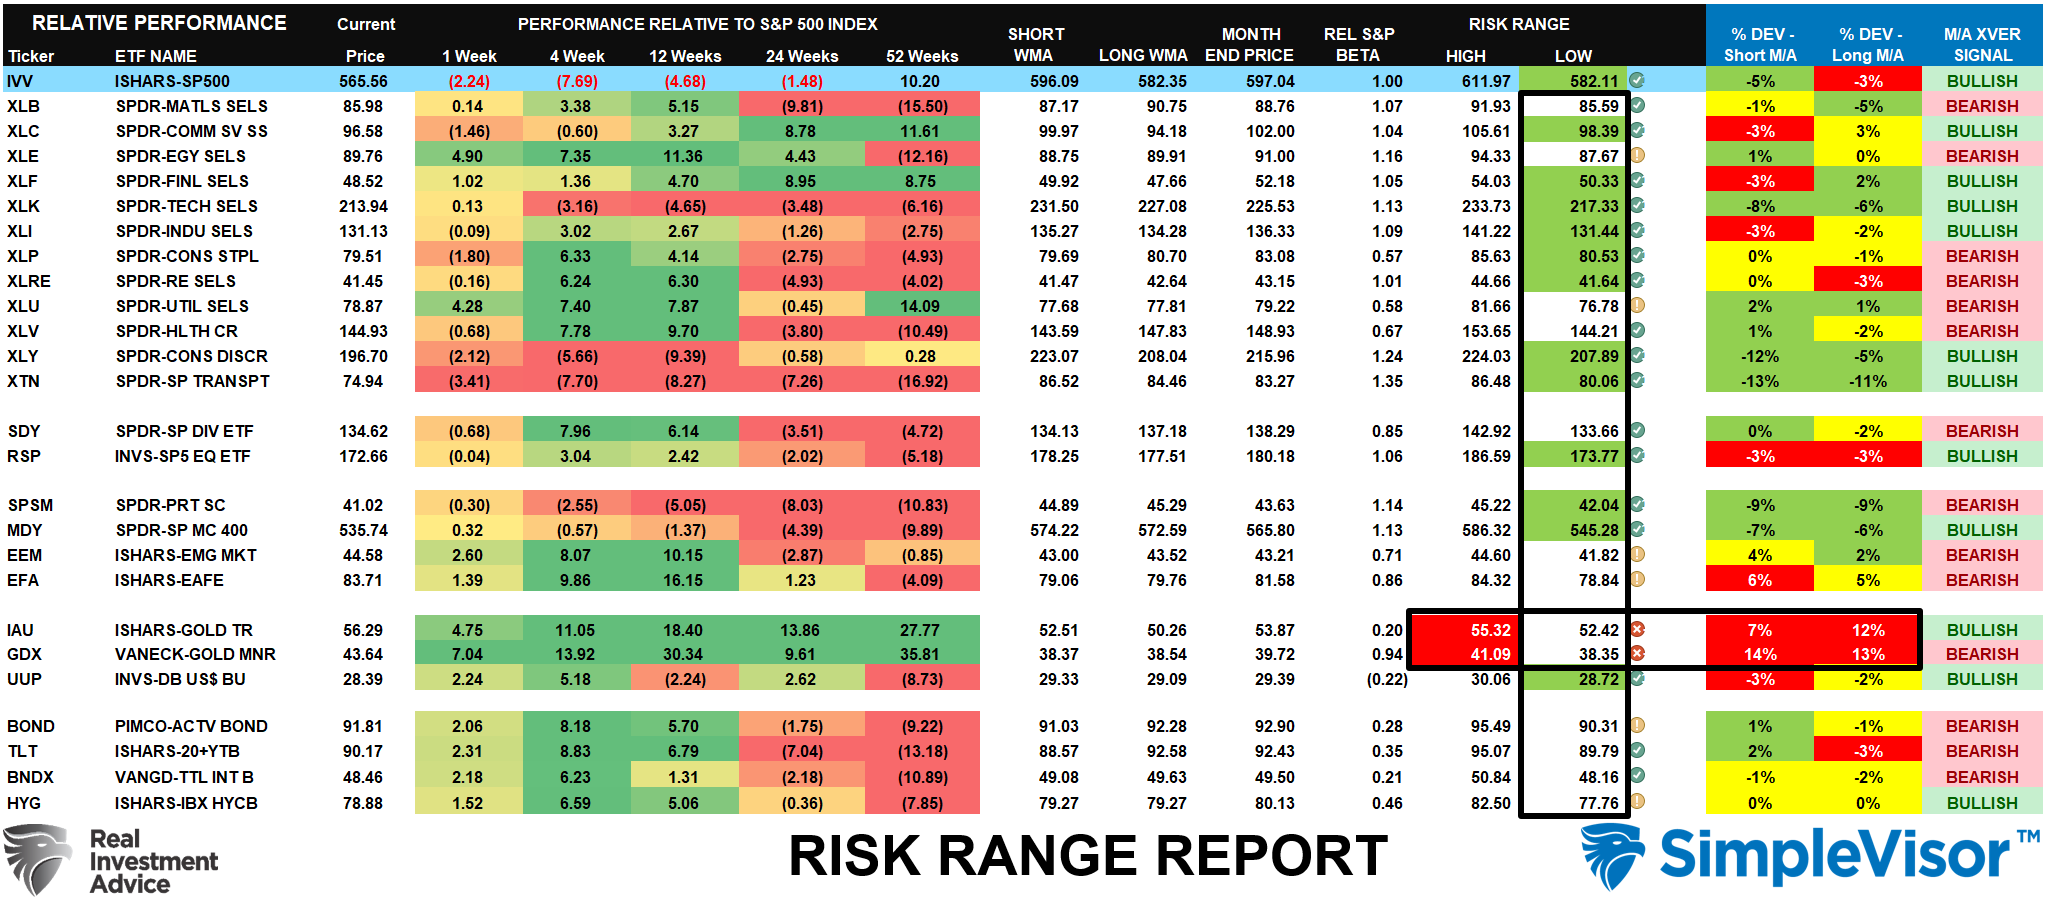
Sector Model Analysis & Risk Ranges
How To Read This Table
- The table compares the relative performance of each sector and market to the S&P 500 index.
- “MA XVER” (Moving Average Crossover) is determined by the short-term weekly moving average crossing positively or negatively with the long-term weekly moving average.
- The risk range is a function of the month-end closing price and the “beta” of the sector or market. (Ranges reset on the 1st of each month)
- The table shows the price deviation above and below the weekly moving averages.
Over the last few weeks, we have noted the continued deterioration in the markets.
"One of the early warning indicators the risk-range report provides is the moving average crossover (last column) of intermediate and long-term measures. A few months ago, only bonds and international traded on bearish crossovers. Since then, we have sharply increased the number of bearish crossovers in various sectors and markets."
As the markets continued deteriorating, bearish crossovers increased from 9 to 12 to 14 over the last few weeks. As shown, many markets and sectors are oversold enough for a decent reflexive rally to ensue. We would suggest taking profits in Gold and Gold Miners that are extremely deviated above their running moving averages and looking to add to sectors and markets that are oversold and still in a bullish trend (E.g., Communications, Financials, Technology, Industrials, and Discretionary). However, given the underlying deterioration, we remain concerned about the sustainability of any rally.
Weekly SimpleVisor Stock Screens
We provide three stock screens each week from SimpleVisor.
This week, we are searching for the Top 20:
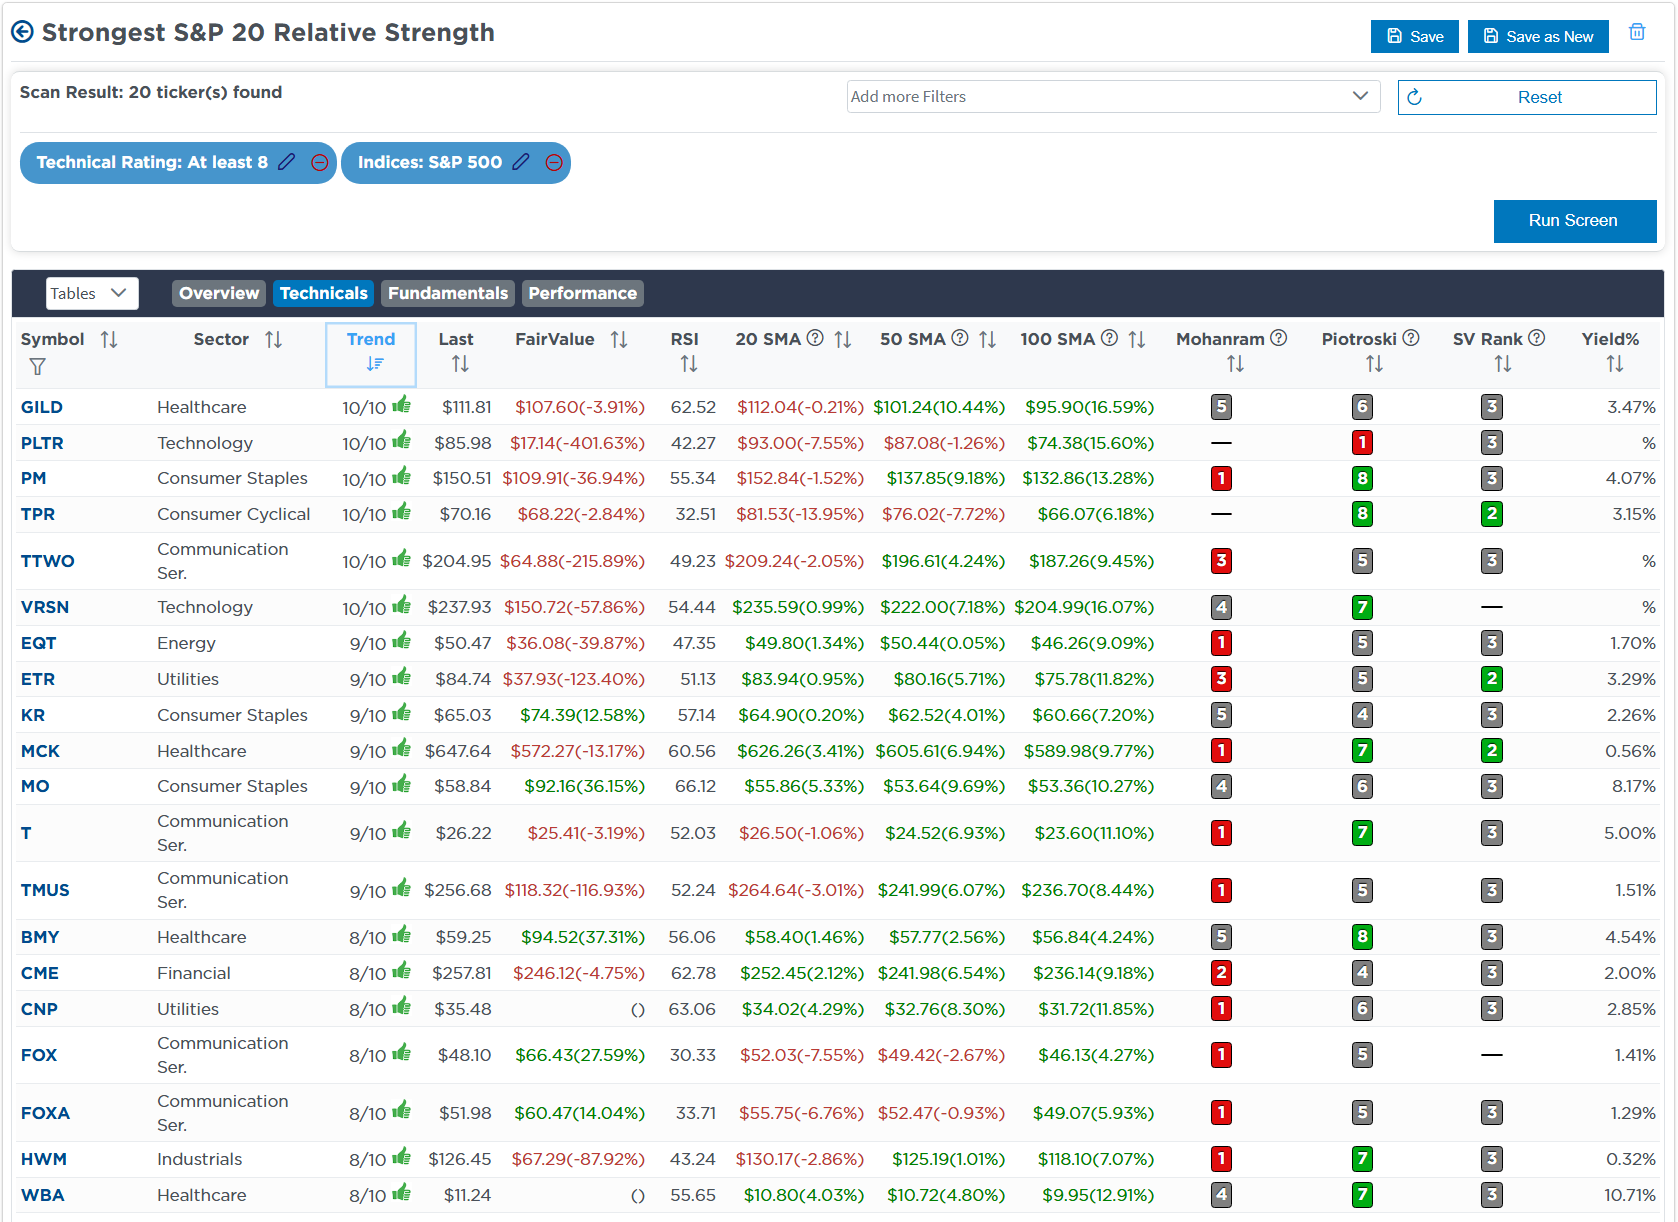
- Relative Strength Stocks
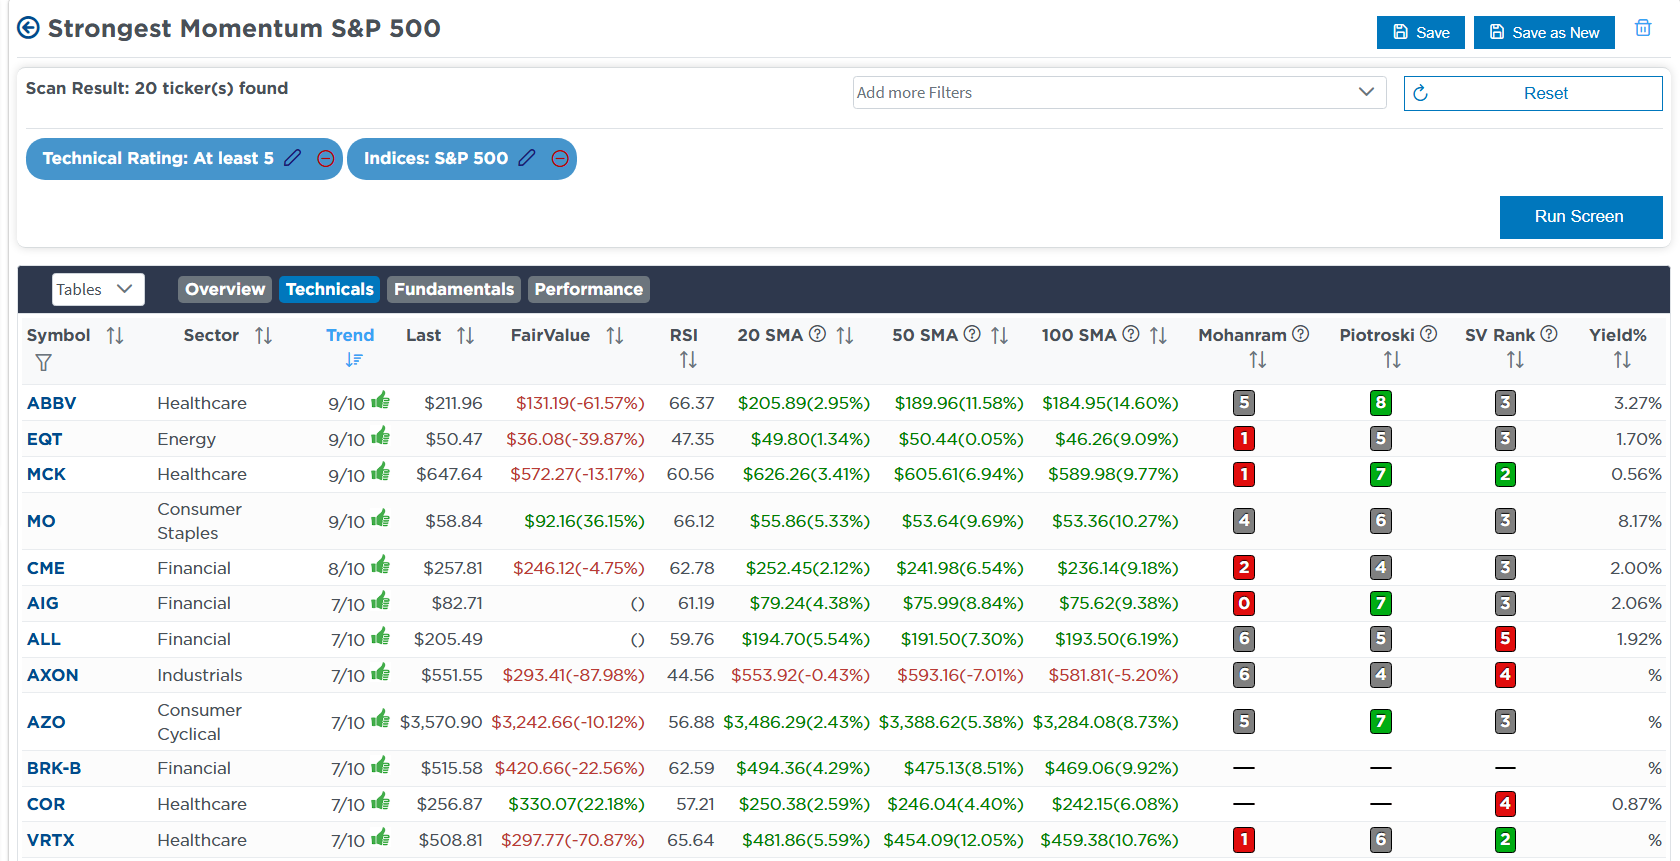
- Momentum Stocks
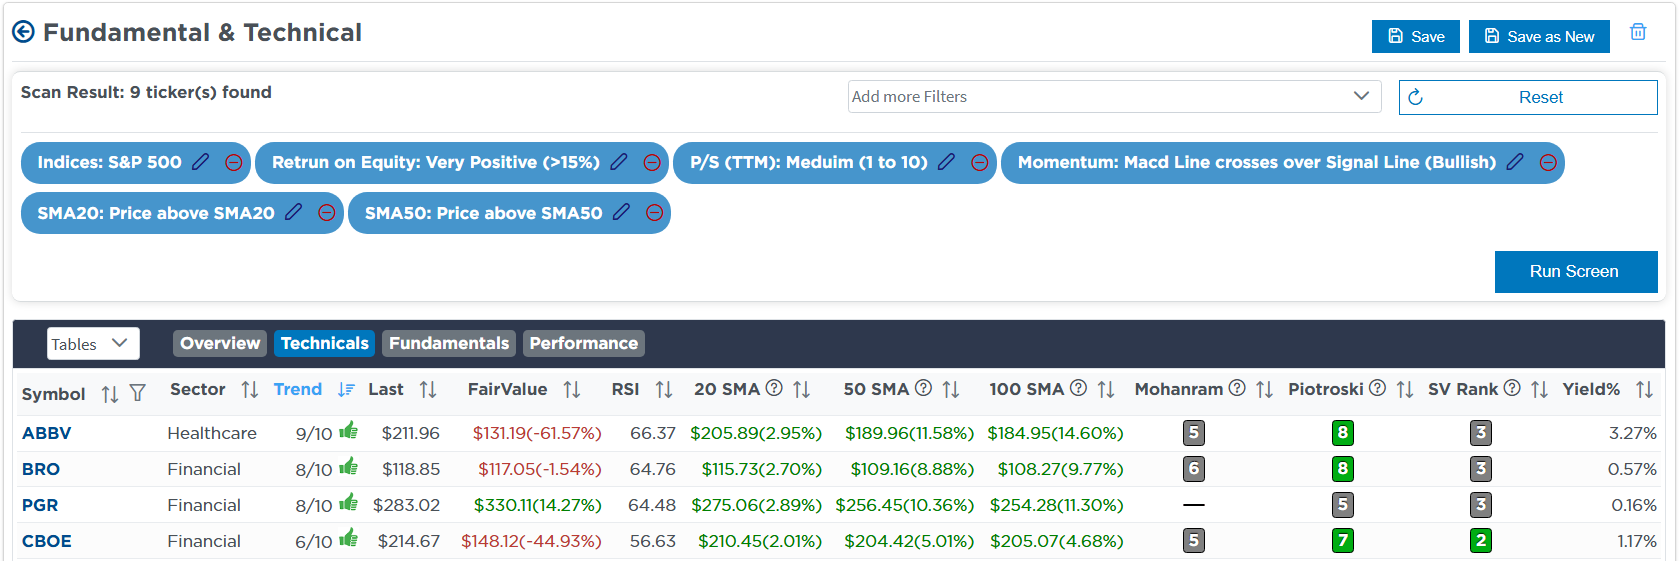
- Fundamental & Technical Strength W/ Dividends
(Click Images To Enlarge)
RSI Screen
Momentum Screen
Technically Strong With Fundamentals
SimpleVisor Portfolio Changes
We post all of our portfolio changes as they occur at SimpleVisor:
Mar 11th
"We have been nibbling at stocks that have reached extreme oversold conditions during the recent decline. Today, we continue that process by increasing our weight in Arista Networks (ANET) in the Equity portfolio and the Megacap Growth ETF (MGK) in the ETF model. While markets are deeply oversold, we may not yet be at the ultimate bottom. We will wait to see the market hold some support level and confirm a bottom before doing a complete portfolio rebalance across all models."
Equity Model
- Increase ANET to 2% of the portfolio)
ETF Model
- Increase MGK to 4% of the portfolio
Lance Roberts, C.I.O., RIA Advisors
The post Sell Off Accelerates As Recession Fears Emerge appeared first on RIA.
Full story here Are you the author?Tags: Featured,newsletter