Lance Roberts
My articles My offerMy siteAbout meMy videosMy books
Follow on:TwitterSeeking AlphaFacebookAmazon
Inside This Week's Bull Bear Report
- Is The Correction Over?
- How We Are Trading It
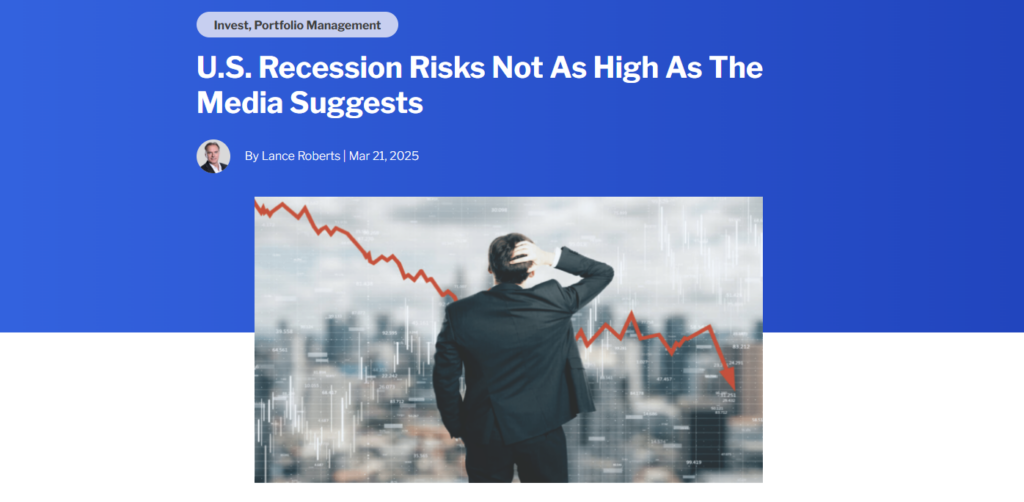
- Research Report - Recession Risk Not As High As Believed
- Youtube - Before The Bell
- Market Statistics
- Stock Screens
- Portfolio Trades This Week
Is A Bottom Beginning To Form?
Last week, we noted that the market performance, while distressing as of late, has been well within regular correctionary market cycles from a historical perspective. To wit:
"While Trump's tariffs and bearish headlines currently dominate investors' psychology, we must remember that corrections are a normal market function. Yes, the market is down roughly 9% from the peak, but we have seen these corrections repeatedly in the past. That does NOT mean a more extensive corrective process is not potentially in process. It only implies that markets are likely in a position for a technical rally to reverse the more extreme oversold conditions. As shown, the MACD and relative strength are currently at levels not seen since the October 2022 lows. Furthermore, the market has completed a 23.6% retracement of the rally from those lows, providing the support needed for a rally."
The market tried to muster a rally this week, and we are beginning to see early signs of a bottom forming. As shown in the chart below, while bumpy, volatility has fallen below 20, relative strength has improved, and momentum is turning into a buy signal. Furthermore, money flows are also beginning to reverse, suggesting a near-term bottom may be in.

However, even with that technical improvement, while meager, let me reiterate what we said last week.
"Let me be clear. I am not saying the markets have bottomed, and the next move is back to all-time highs. While that could be the case, other technical warnings suggest we could be in for a longer corrective/consolidative process. As such, we recommend using rallies to rebalance portfolios, reduce risk and leverage, and increase cash levels slightly until the markets confirm the bullish trend is re-established."
The last part of that statement is the most critical. Nothing in the market is guaranteed. Therefore, we must continue managing risk accordingly until the market's direction is revealed. When that will be, we are uncertain, so we continue to watch the technicals, make small moves within portfolios, and reduce volatility risk as needed.
This week, we will discuss the recent correction and what is likely to happen next.
Need Help With Your Investing Strategy?
Are you looking for complete financial, insurance, and estate planning? Need a risk-managed portfolio management strategy to grow and protect your savings? Whatever your needs are, we are here to help.

The Correction Was Not Unexpected
Interestingly, the market correction has significantly reversed investor sentiment over the last few weeks. However, the correction was unsurprising as we laid out the risk of such in: "Retail Exuberance Sets Market Up For A Correction" on the 18th of February. That was just about a week before the correction started. To wit:
"While the immediate response to this analysis will be, “But Lance, margin debt is only slightly higher than in 2021,” there are many differences between then and today. The lack of stimulus payments, zero interest rates, and $120 billion in monthly “Quantitative Easing” are just a few. However, some glaring similarities exist, including the surge in negative cash balances and extreme deviations from long-term means."

"Does this mean the markets are about to suffer a significant mean reverting event? No. It suggests only that with leverage elevated, correlations across asset classes are high, and bullish sentiment is rampant. The ingredients of a reversion are undoubtedly present, but the catalyst is absent."
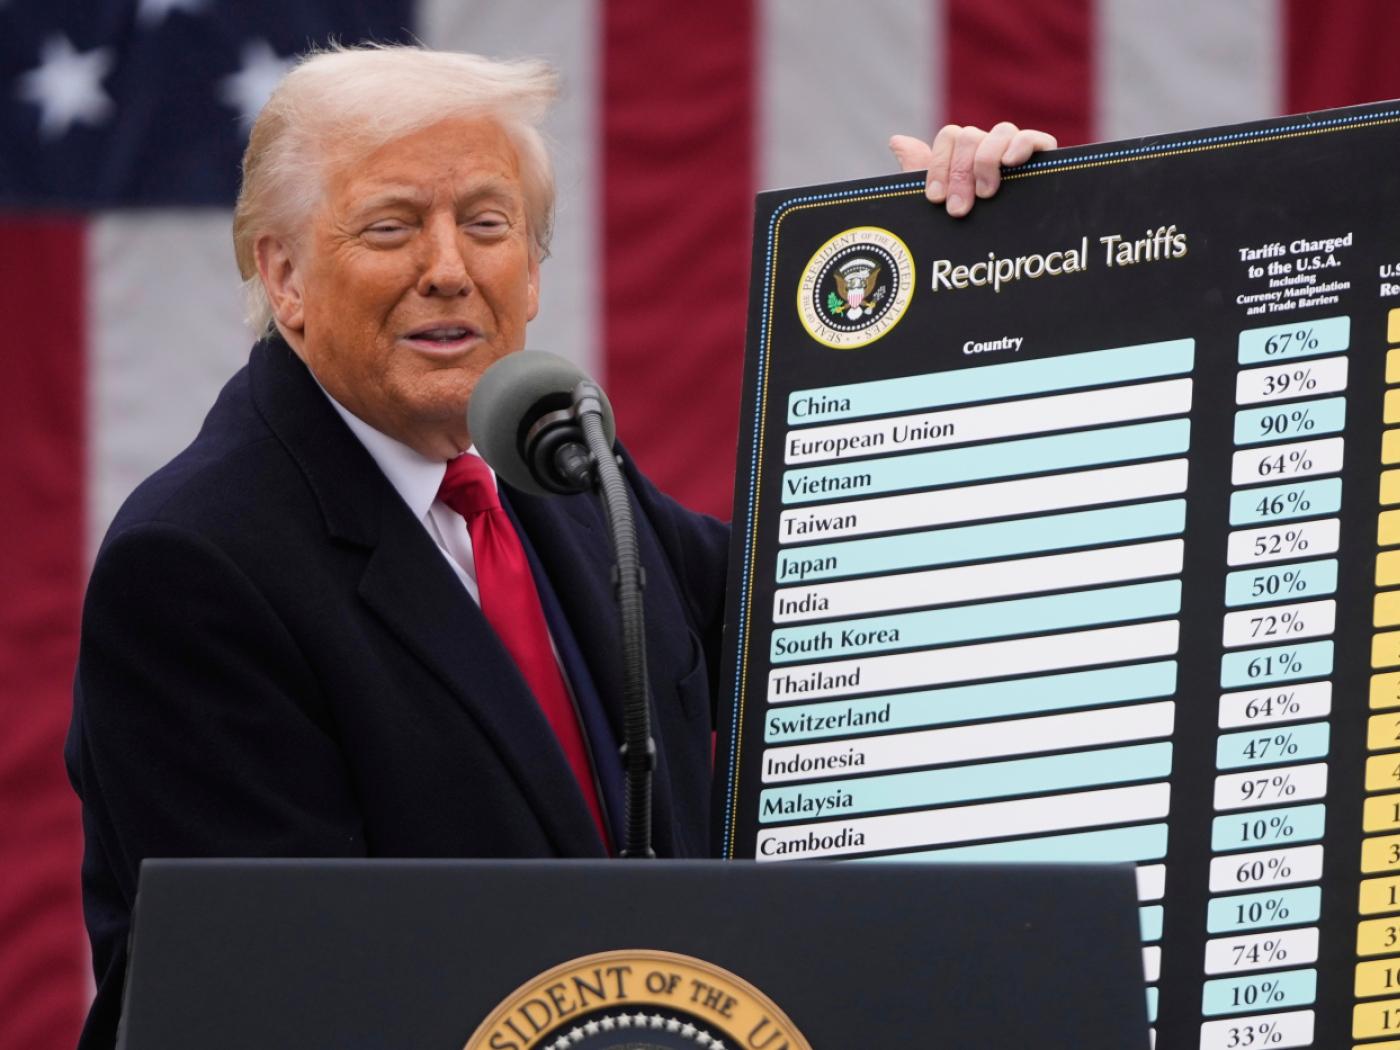
That catalyst turned out to be President Trump's on again, off again, tariff announcements that created turmoil in earnings expectations. The risk of tariffs also caused a reversal in the U.S. dollar, which reversed foreign inflows. That reversal led to the correction in U.S. stocks and the recent outperformance in international markets.

As we concluded in that February 18th article:
"While it may “feel” like the market “just won’t go down,” it is worth remembering Warren Buffett’s sage words: “The market is a lot like sex, it feels best at the end.”
The timing of that article could not have been much better as a warning to investors to reduce risk and rebalance allocations. However, today, the backdrop for the markets has reversed. On Tuesday, we discussed the sharp increase in bearish sentiment as the correction over the last few weeks has intensified.
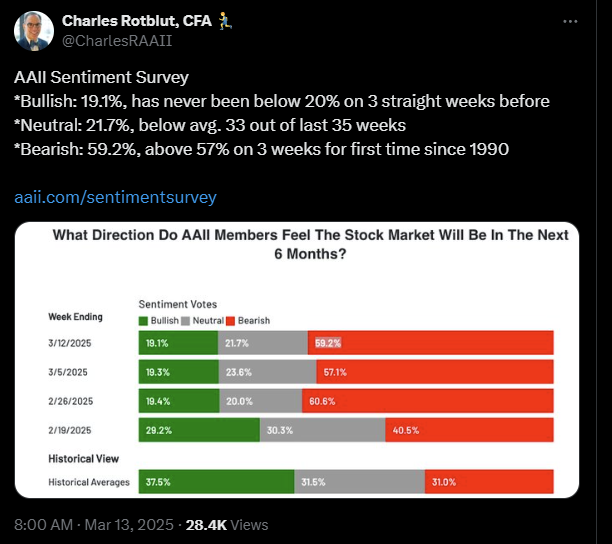
"Not surprisingly, investors were terrified when the market entered correction territory last week (a decline of ~10%). Our composite index of retail and institutional investors showed that fear was rampant. As shown, the standard deviation of net bullish sentiment was at the lowest level since the depths of the 2022 market correction and the “financial crisis.”

"The fact that retail investors were so bearish after a minor market correction is something rarely witnessed in the markets. Such was a point made by Charles Rotblut of the American Association of Individual Investors."
While the correction was not unexpected, the reversal in sentiment and positioning suggests that we may be closer to a near-term market bottom than not. For that analysis, we turn to the technicals.
Is The Correction Over?
As humans, we need to rationalize why things happen. For example, if I show you the following inkblot, do you see two people about to kiss or a butterfly?

Both answers are wrong.
It's just some ink on a piece of paper folded in half to duplicate it. However, our brains need to provide order to chaos.
The same happens during the market correction process. Why are stock prices going down? The media is quick to provide answers for clicks and views, from "Orange Man Bad—It's Tariffs" to "Recession Risks Rising." The reality was, as noted on February 18th, the markets were overbought and bullish, and a correction was likely. All that was needed was a catalyst to get markets to question forward earnings expectations. If the "E" in the Price/Earnings ratio declines, the "P" must also be repriced. Such is all that has happened currently.
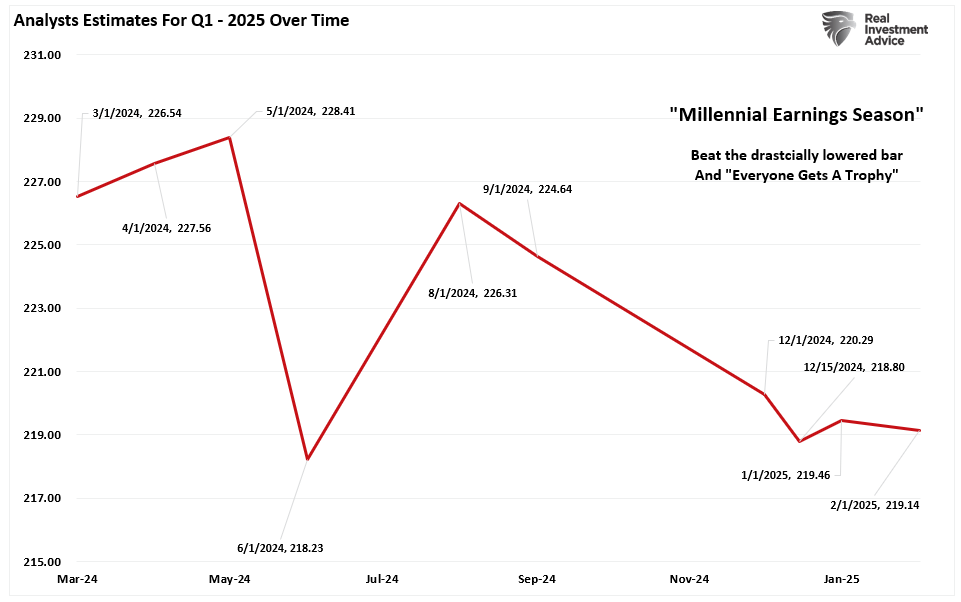
As shown, the earnings estimates for Q1, which companies will start reporting in April, have declined from $226/share in March of last year to just $219. We may see further revisions to reduce earnings with only two weeks before earnings season begins. However, that reduction in the "E" is part of the market's recent reversion process.
The following chart shows the market's valuation (price divided by forward earnings). At its peak in February, the market traded at a multiple of 22x forward earnings. Even with the recent reductions in forward estimates, the correction has reduced valuations to 20.6x forward estimates. While valuations remain elevated, the reversal temporarily erases some pressure on the equity markets.
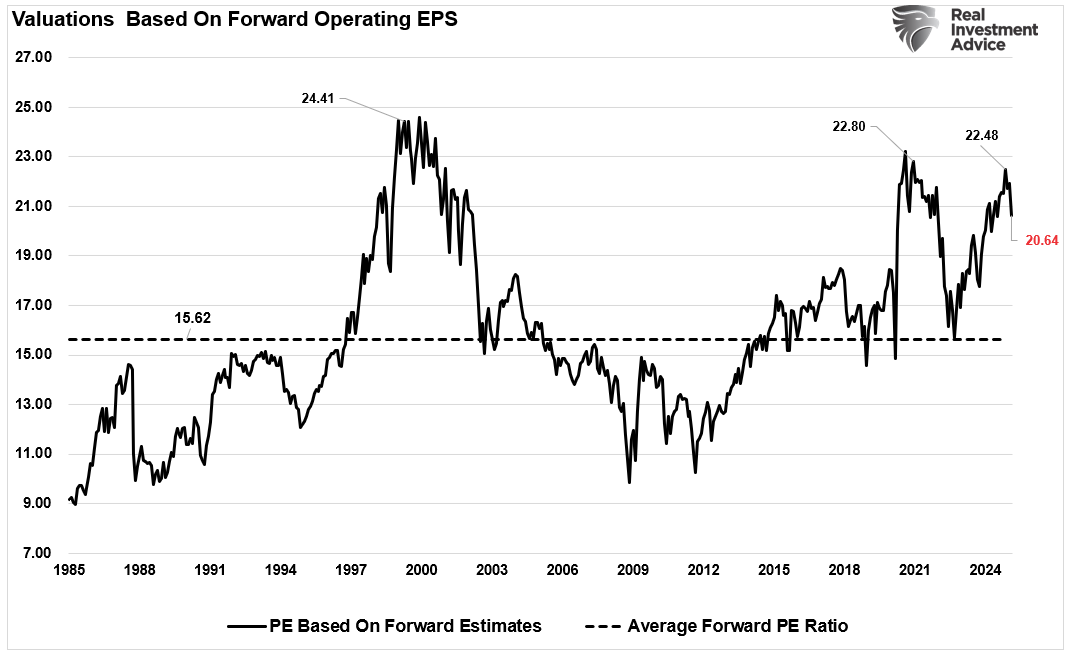
Furthermore, today, as opposed to mid-February, the market is no longer overbought on multiple levels. The reduction in valuations, combined with highly negative sentiment and technically oversold conditions, provides the "fuel" for a market reversal.
A Larger Process May Be Near
In the chart below, the top panel is the Moving Average Convergence Divergence (MACD) indicator, which measures market momentum. That indicator is at levels ordinarily consistent with short-term bottoms, even during a broader correctionary process, as we witnessed in 2022. The third panel is money flow, which has turned negative as sellers have outpaced buyers combined with the bottom panel, which is relative strength (RSI). Combined, these measures suggest the "sellers" are likely near exhaustion level, and a price reversal will bring buyers into the market.
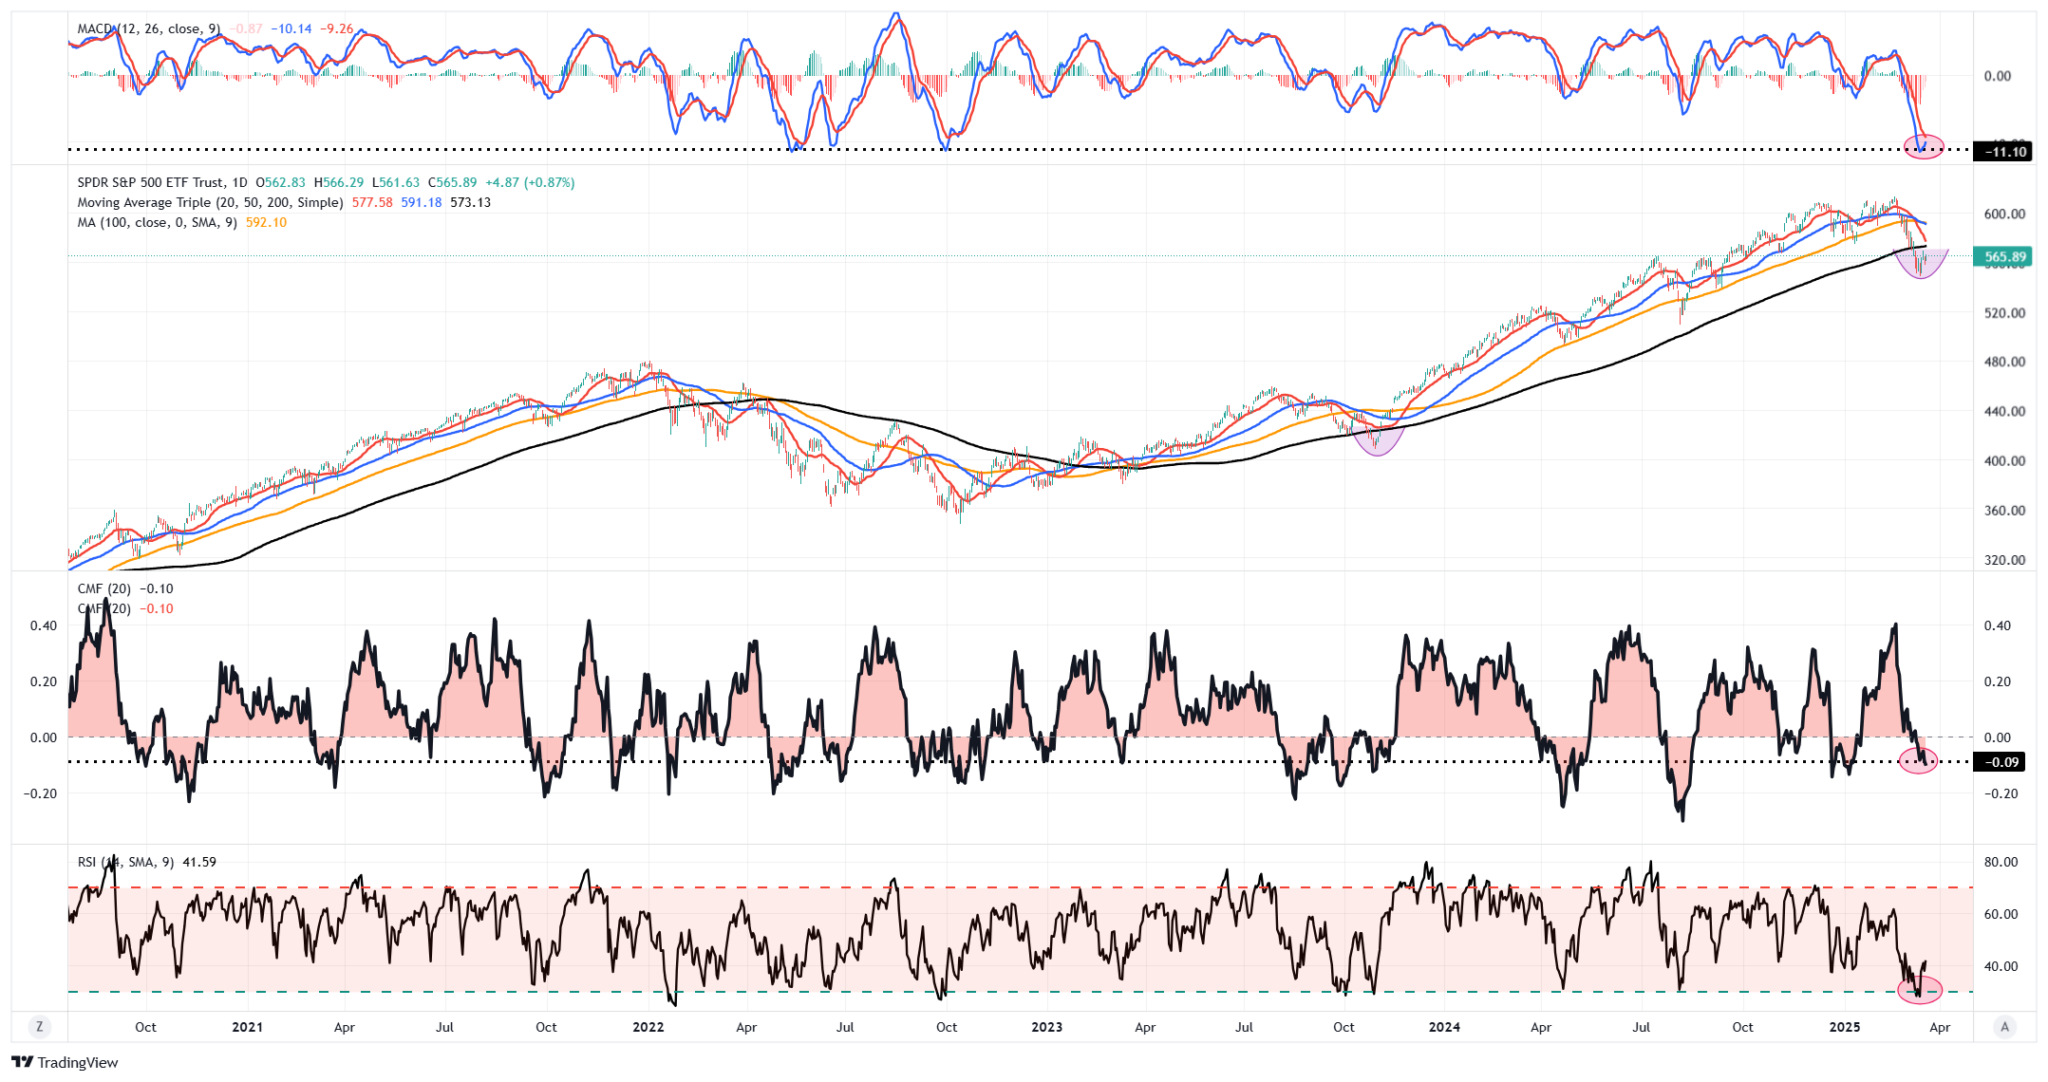
Does this mean the correction is over, and a bull market is set to resume? No. It only suggests that everyone who wanted to sell has likely done so. If prices rise, investors will begin chasing markets higher to "buy the dip," pushing prices higher and bringing more buyers into the market. As we saw during 2022, those "counter-trend" rallies can be significant, allowing investors to rebalance portfolio risks at more advantageous levels.
But, crucially, a "counter-trend" rally does not mean a more extensive correction process is not occurring.
The chart below is one of our favorites. It uses two weekly moving averages of different lengths to reduce the volatility of the markets on allocation decisions. When the shorter-term moving average crosses below the longer-term, a "sell signal" occurs, suggesting that investors should reduce equity risk in portfolios. When that signal reverses, investors should increase equity risk. Since 1995, the weekly indicator has only given three "false" signals. However, those signals were quickly reversed as the bull market continued doing little harm to investor's total returns. Notably, the signals did warn investors of more critical downturns early enough to reduce equity exposure and avoid more significant capital destruction.
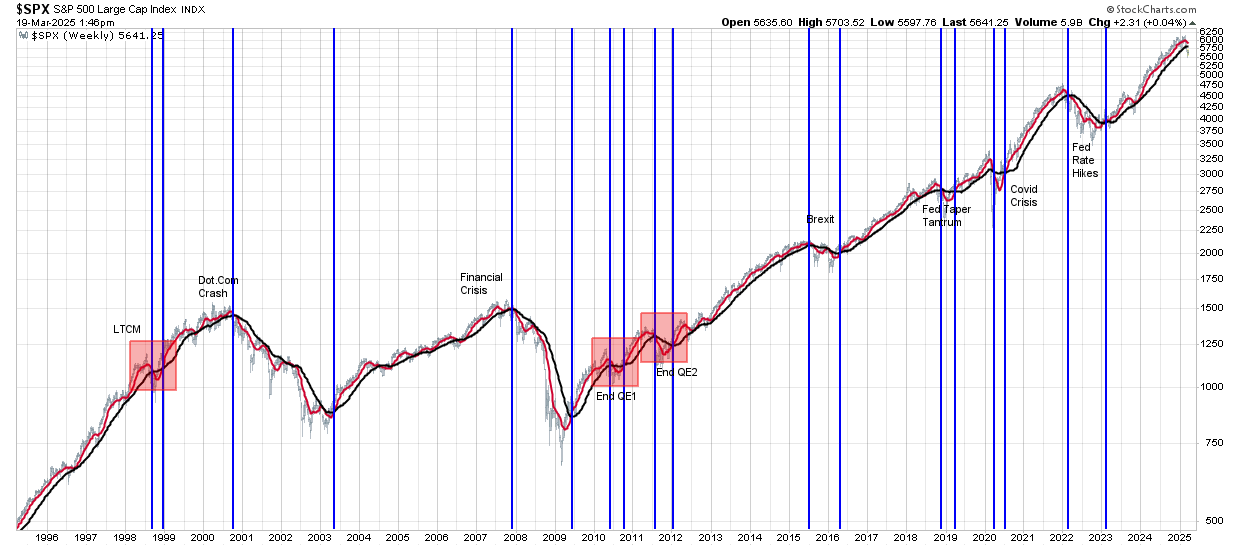
While no "bear market" signal has been triggered, suggesting a more extensive risk reduction in portfolios, that doesn't mean one will not occur. We suspect a signal will eventually be triggered, but likely not without the market rallying first.
The markets are currently in a tenuous position, and we must let things develop over the next few days or weeks. The market will eventually tell us what actions to take. The mistake investors make is "assuming" they know more than "Mr. Market." That assumption usually gets investors into more trouble than not.
How We Are Trading It
While several warning indicators suggest that the market may take further corrective action, the weekly "buy/sell" signal has not yet been triggered. We are watching that signal closely.
As of today, the market is oversold enough for a reflexive rally. We suggest using that rally to implement basic risk management protocols such as:
- Rebalance current holdings to target weights.
- Reduce positions that have been underperforming or carry significantly higher volatility than the market.
- Reduce or eliminate leverage.
- Look to raise cash levels modestly. Don't feel forced to "buy" something. Holding cash is a hedge.
- Add holdings that protect portfolios during a market correction, such as fixed income or other hedges.
If the market rallies, which we suspect will, prices could trend more "sideways." If that occurs, the weekly sell signal will trigger, suggesting a reduction of equity risk in portfolios. That signal will happen even if markets are holding at higher levels, which is why the actions noted above can assist in aligning you with current market risk.
Adding equity exposure as desired is simple if markets break out to new all-time highs. However, if the market breaks down, you have already taken some actions to reduce risk and the impact on your portfolios. Reducing holdings further to offset market decline risk is an easy process.
As often stated, portfolio management is a game of "inches." Small moves can significantly impact future outcomes. What we don't want, and where mistakes happen the most, is being forced to take action at the worst possible time.
Most importantly, keep your emotions in check. They are often our own worst enemy.
Feel free to reach out if you want to navigate these uncertain waters with expert guidance. Our team specializes in helping clients make informed decisions in today’s volatile markets.
Have a great week.
Research Report
Subscribe To “Before The Bell” For Daily Trading Updates
We have set up a separate channel JUST for our short daily market updates. Please subscribe to THIS CHANNEL to receive daily notifications before the market opens.
Click Here And Then Click The SUBSCRIBE Button
Subscribe To Our YouTube Channel To Get Notified Of All Our Videos
Bull Bear Report Market Statistics & Screens

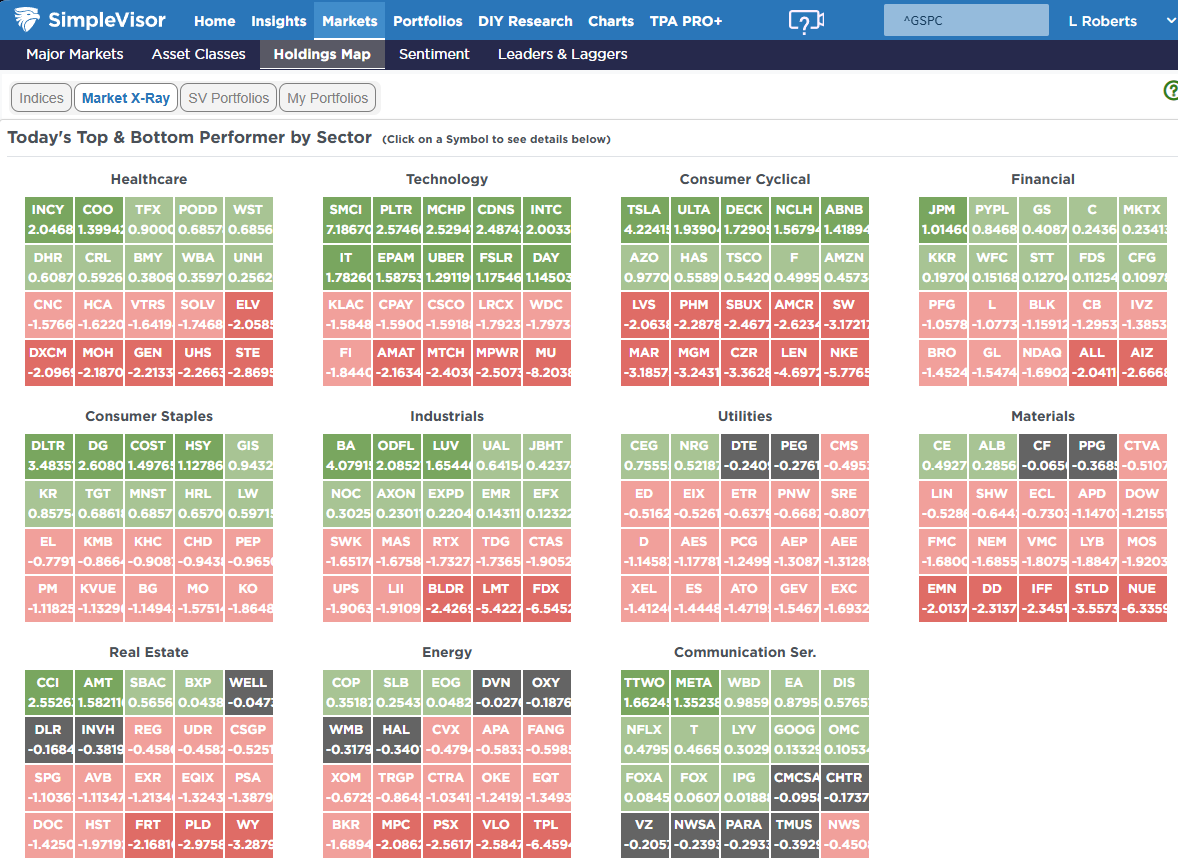
SimpleVisor Top & Bottom Performers By Sector
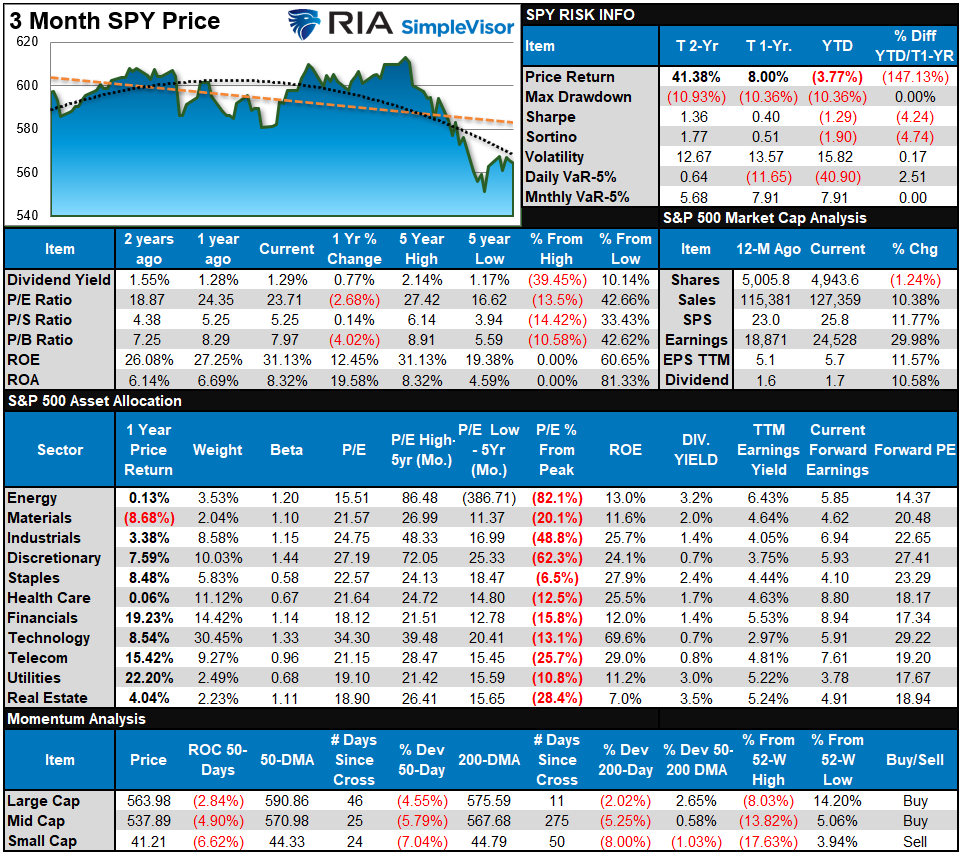
S&P 500 Weekly Tear Sheet
Relative Performance Analysis
As noted last week, stocks struggled again amid increased policy uncertainty from the White House. "Tariff on, Tariff off" makes it difficult for investors to assess the impact on future earnings growth. However, the markets saw a reversal in money flows this week, with various sectors and markets coming from deep oversold levels. The market is not overbought, which should allow stocks to rally more next week, barring any more headlines from the White House. We will see if the recent bottom holds this week.
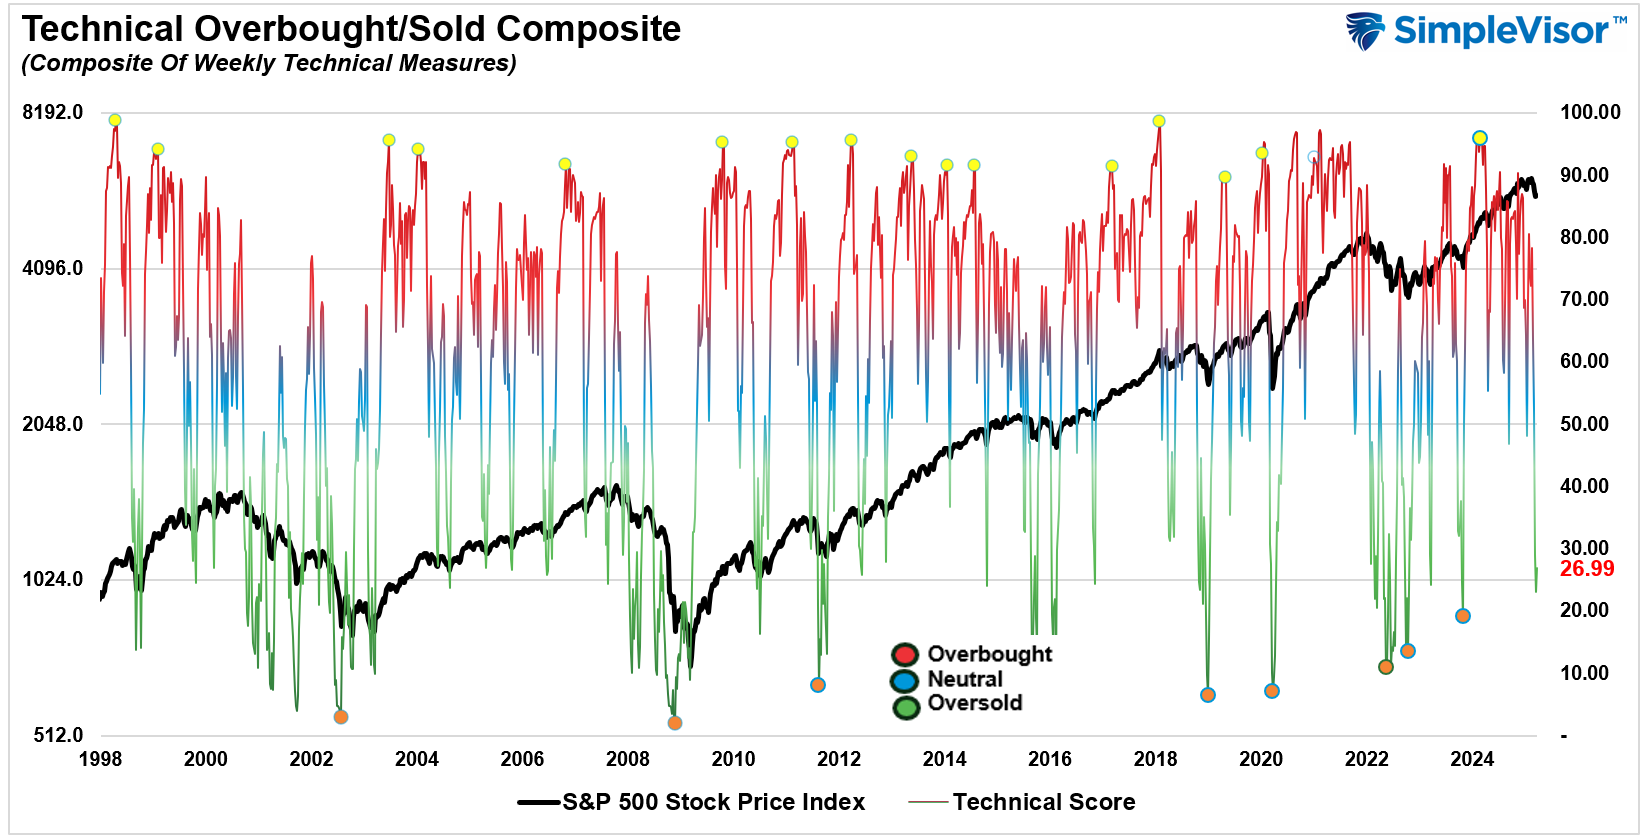
Technical Composite
The technical overbought/sold gauge comprises several price indicators (R.S.I., Williams %R, etc.), measured using “weekly” closing price data. Readings above “80” are considered overbought, and below “20” are oversold. The market peaks when those readings are 80 or above, suggesting prudent profit-taking and risk management. The best buying opportunities exist when those readings are 20 or below.
The current reading is 26.99 out of a possible 100.
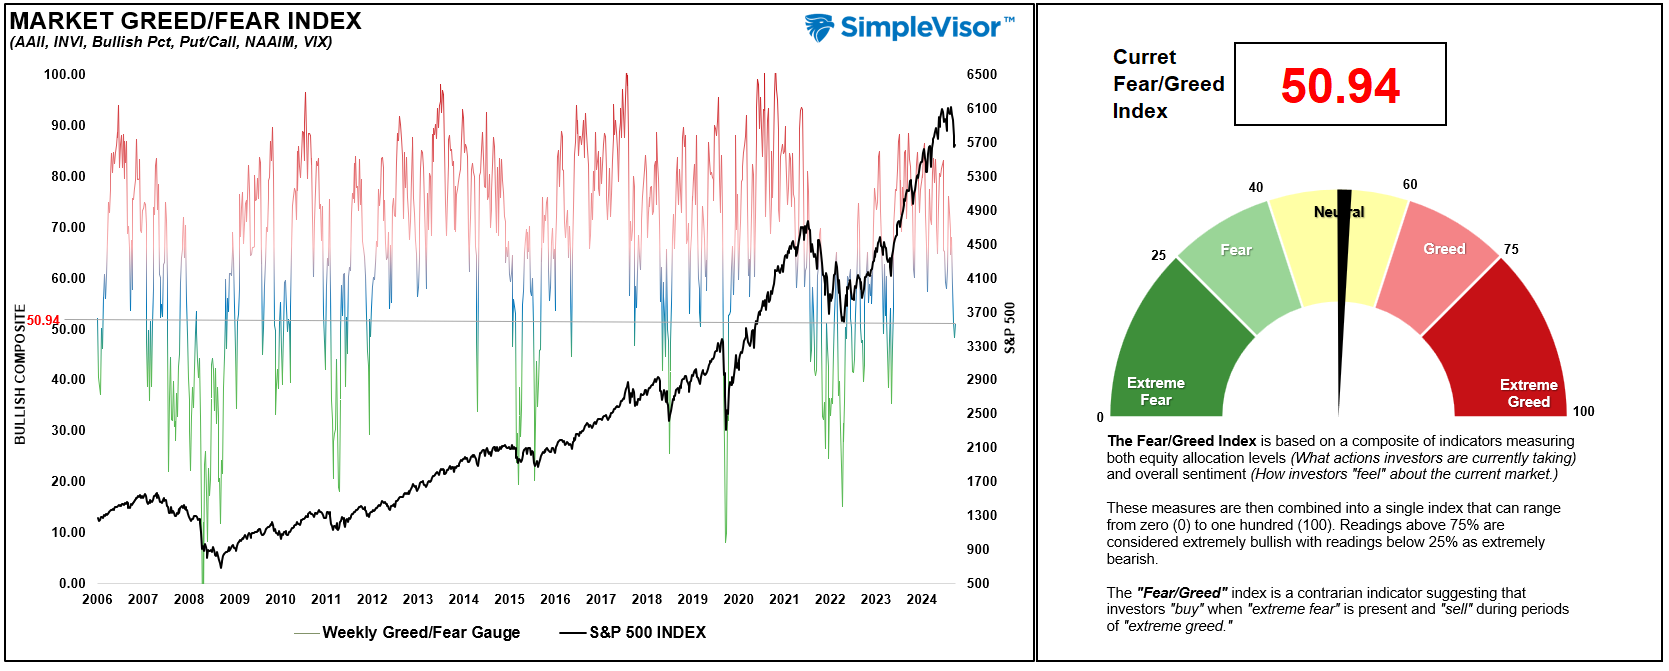
Portfolio Positioning “Fear / Greed” Gauge
The “Fear/Greed” gauge is how individual and professional investors are “positioning” themselves in the market based on their equity exposure. From a contrarian position, the higher the allocation to equities, the more likely the market is closer to a correction than not. The gauge uses weekly closing data.
NOTE: The Fear/Greed Index measures risk from 0 to 100. It is a rarity that it reaches levels above 90. The current reading is 50.94 out of a possible 100.
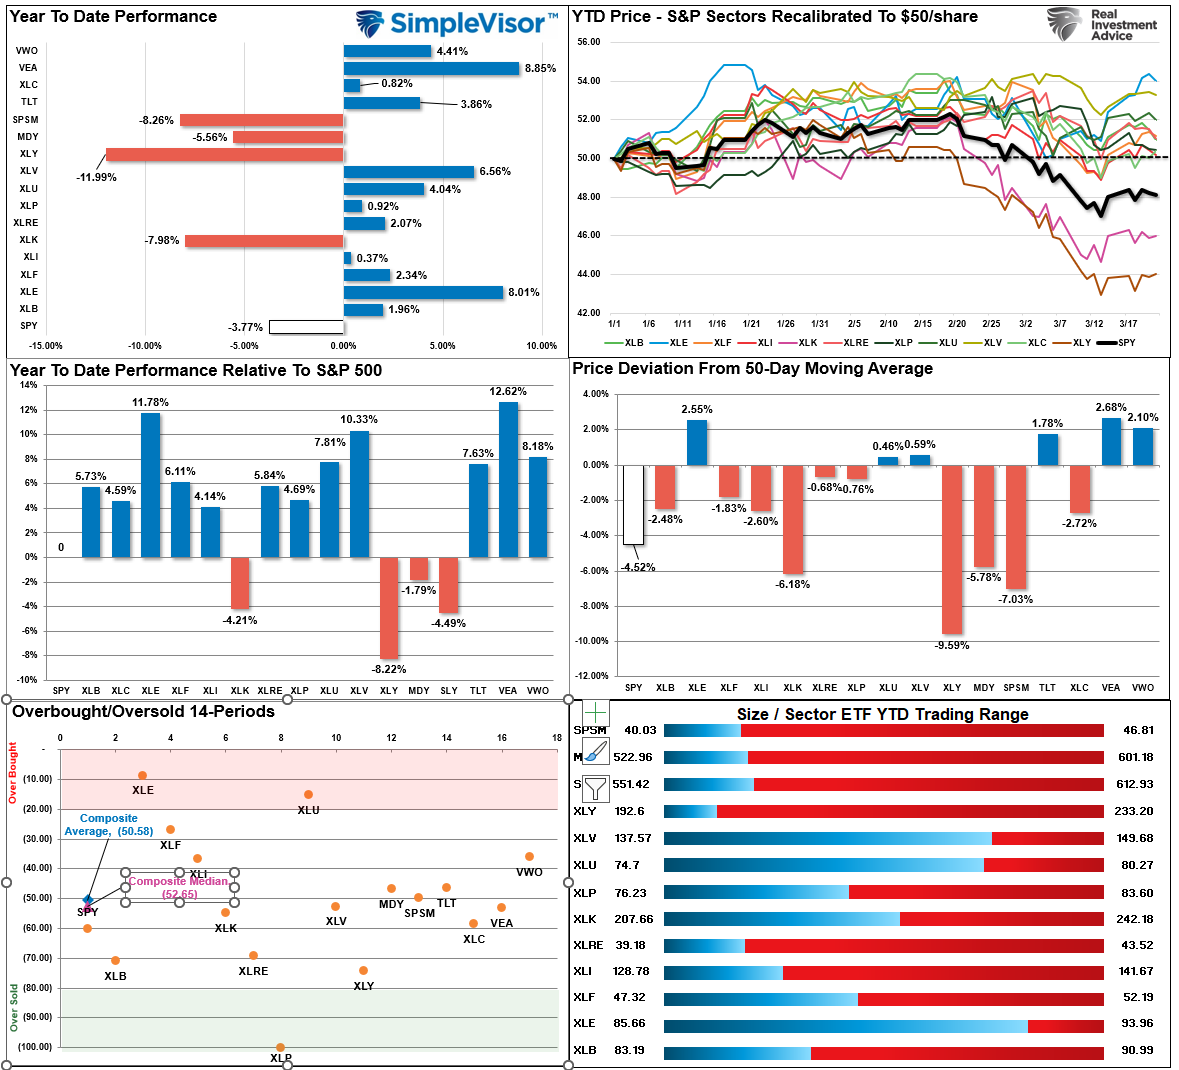
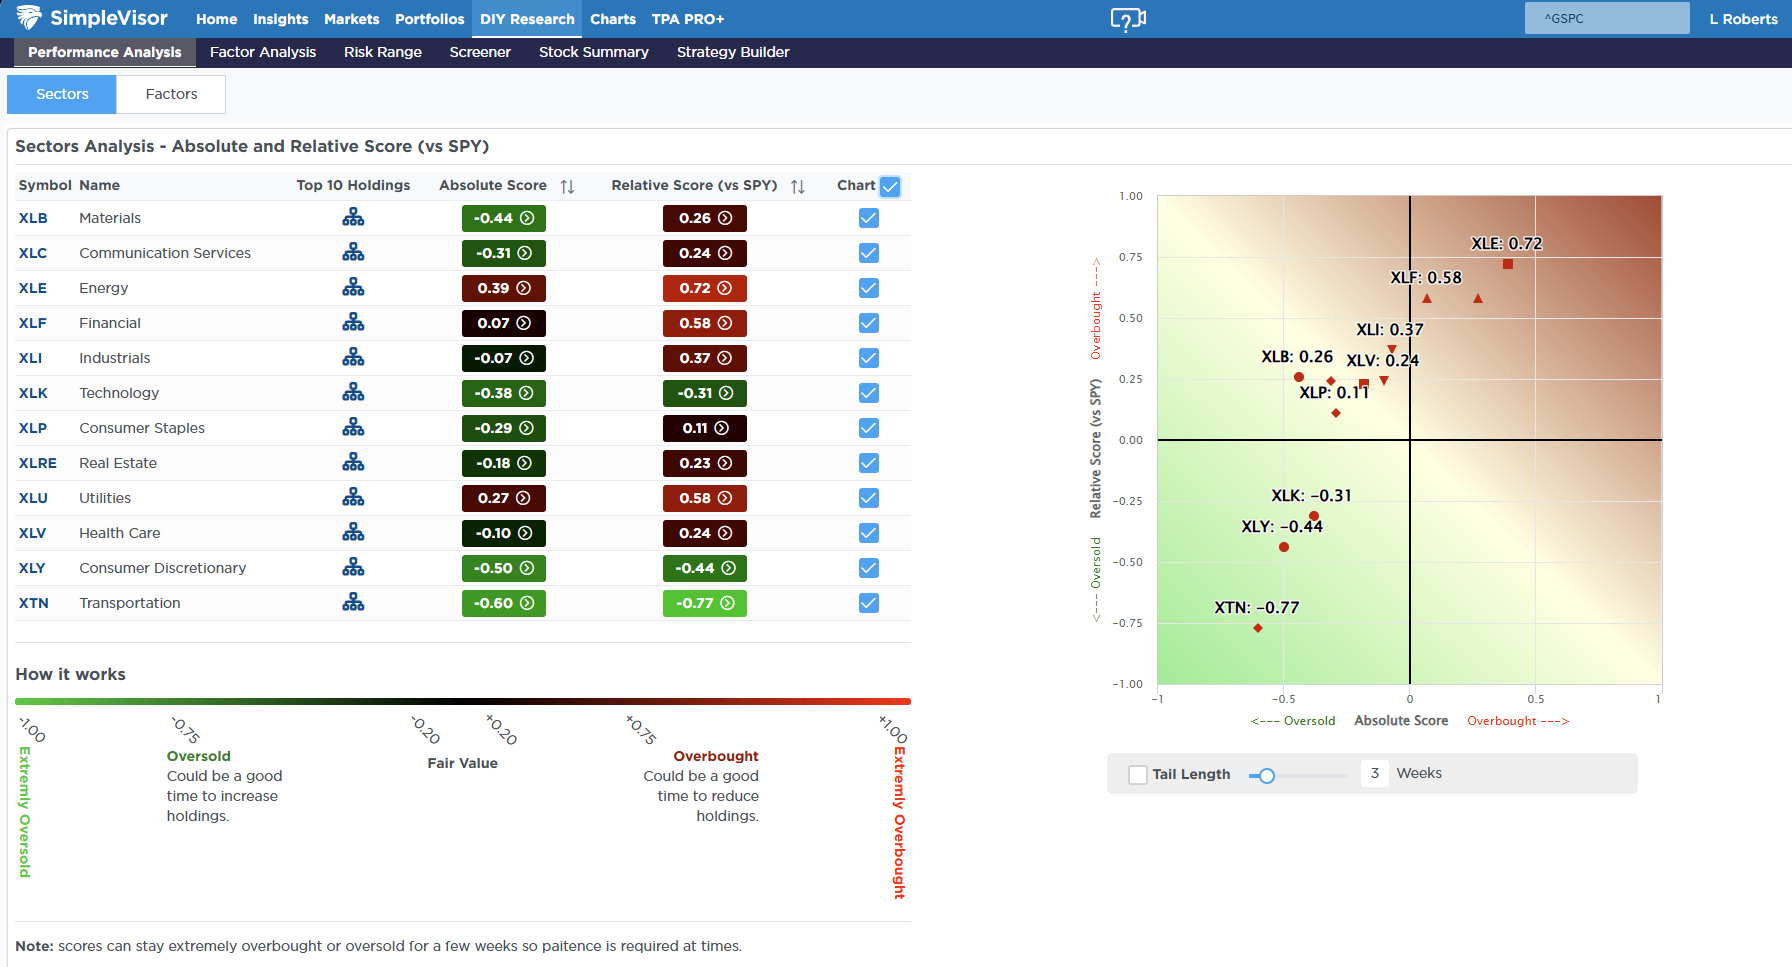
Relative Sector Analysis
Most Oversold Sector Analysis

Sector Model Analysis & Risk Ranges
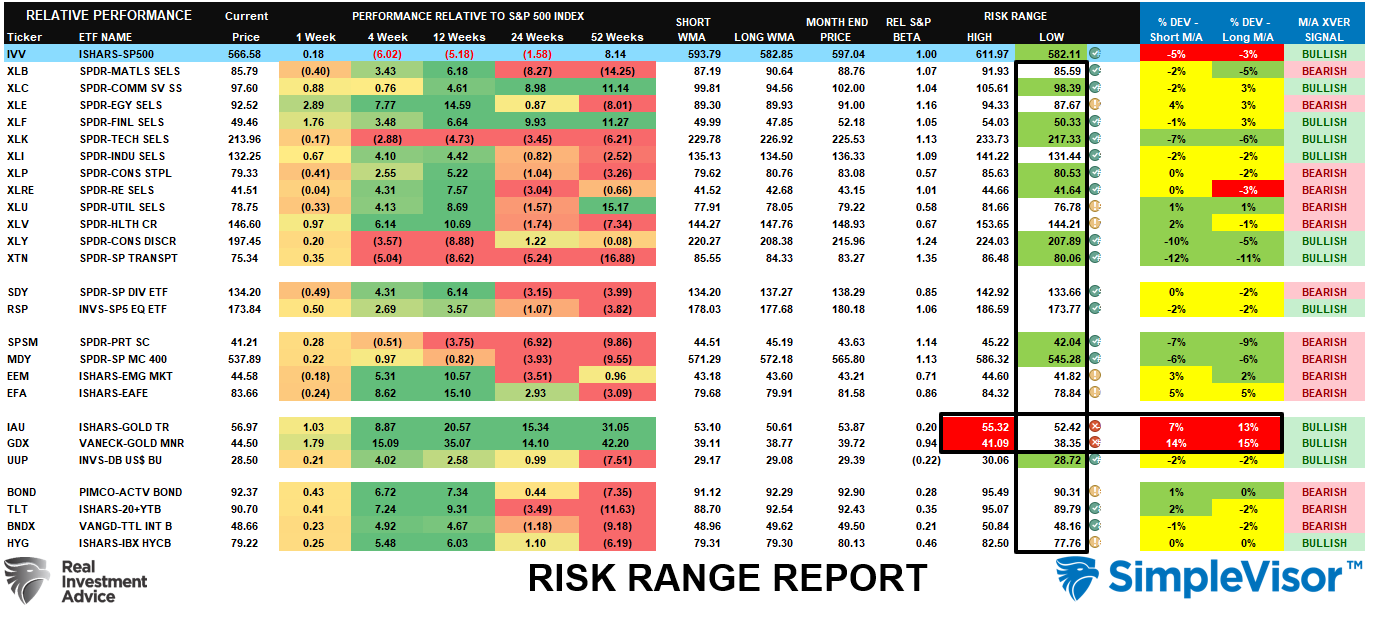
How To Read This Table
- The table compares the relative performance of each sector and market to the S&P 500 index.
- “MA XVER” (Moving Average Crossover) is determined by the short-term weekly moving average crossing positively or negatively with the long-term weekly moving average.
- The risk range is a function of the month-end closing price and the “beta” of the sector or market. (Ranges reset on the 1st of each month)
- The table shows the price deviation above and below the weekly moving averages.
As the markets deteriorated, many sectors traded well below their normal risk/reward ranges. These deviations provide more opportunistic entry points for investors in the short term. We would suggest taking profits in Gold and Gold Miners that are significantly deviated above their running moving averages and looking to add to sectors and markets that are oversold and still in a bullish trend (E.g., Communications, Financials, Technology, Industrials, and Discretionary). However, given the underlying deterioration, we remain concerned about the sustainability of any rally so continue to manage risk/reward carefully.
Weekly SimpleVisor Stock Screens
We provide three stock screens each week from SimpleVisor.
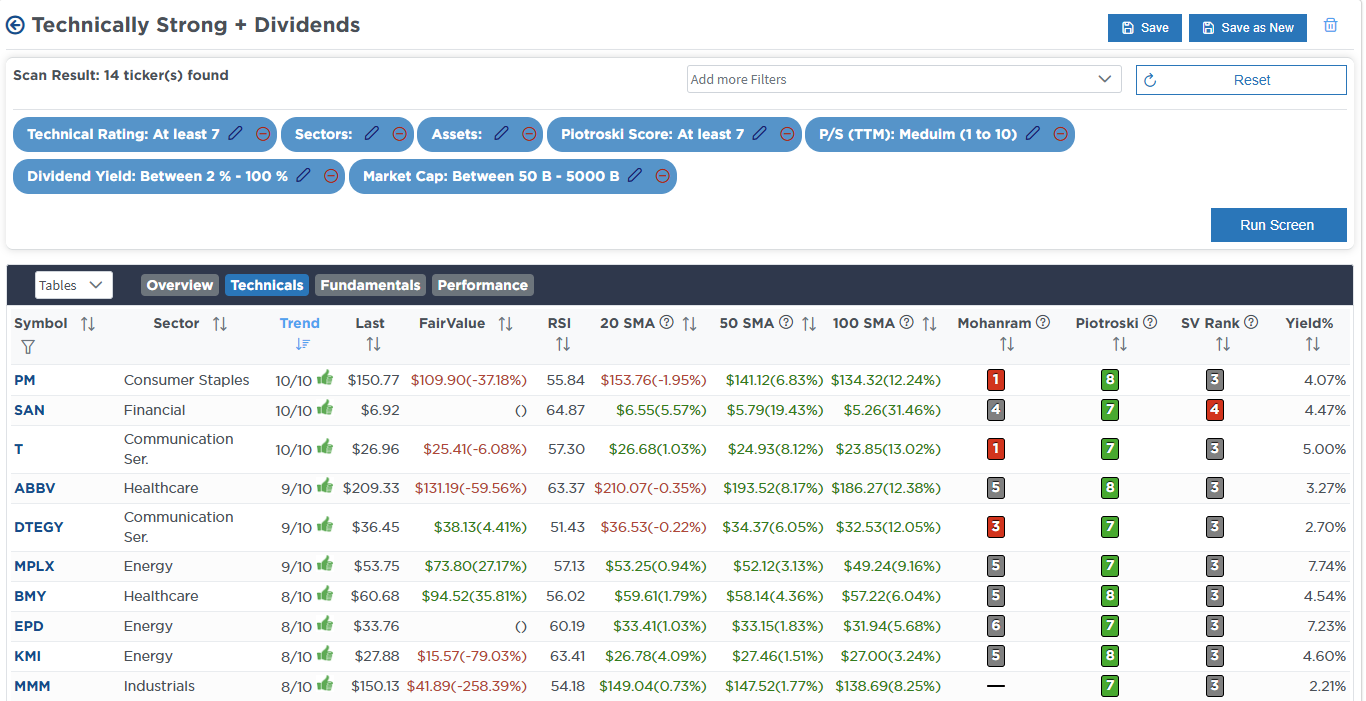
This week, we are searching for the Top 20:
- Relative Strength Stocks
- Momentum Stocks
- Fundamental & Technical Strength W/ Dividends
(Click Images To Enlarge)
RSI Screen
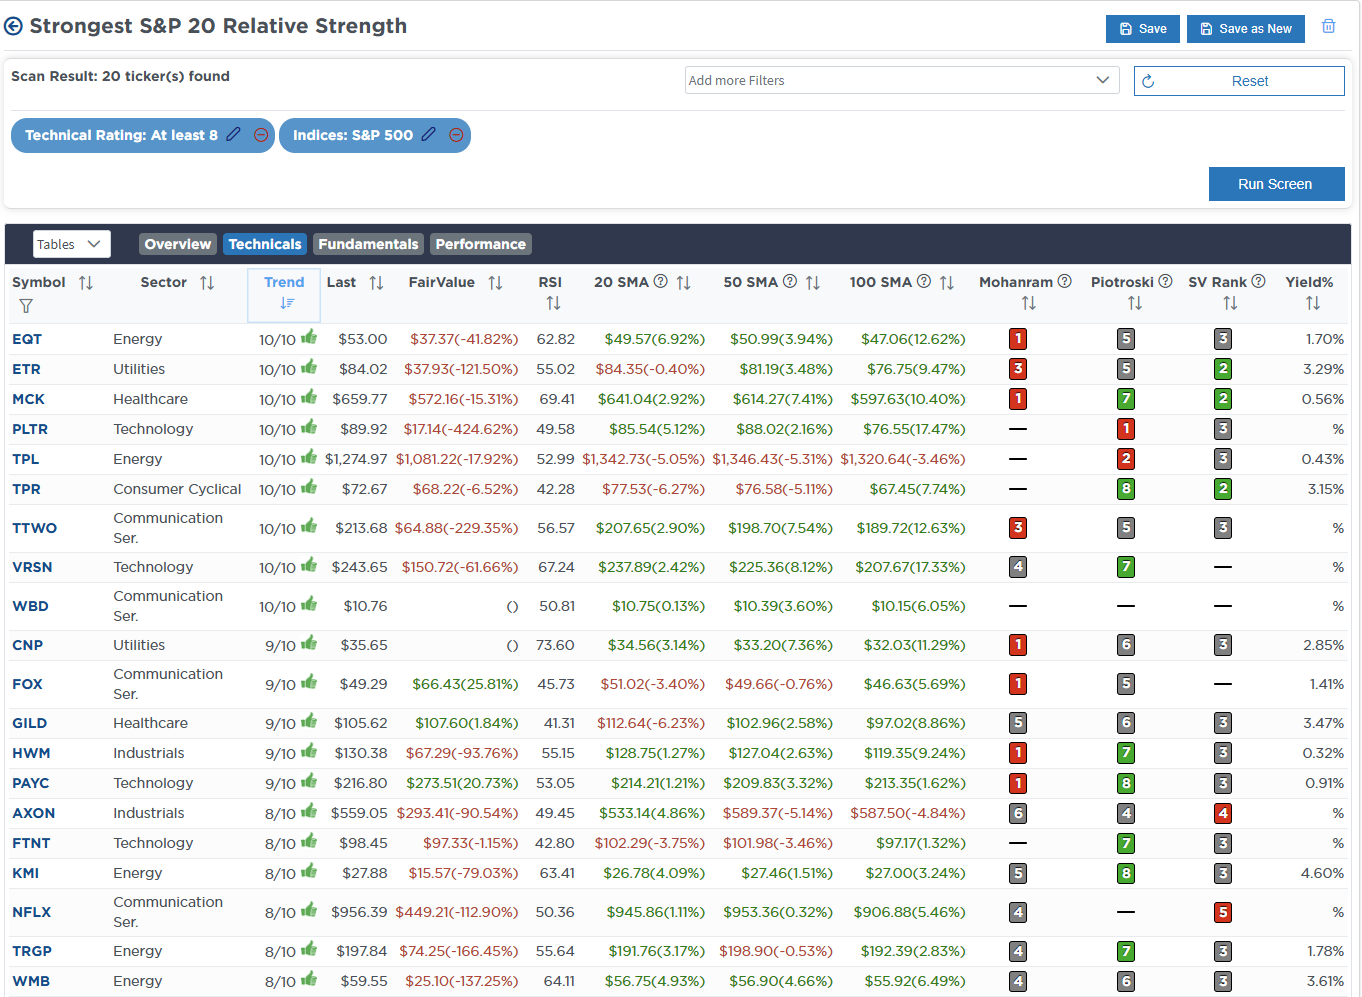
Momentum Screen

Technically Strong With Dividends
SimpleVisor Portfolio Changes
We post all of our portfolio changes as they occur at SimpleVisor:
Mar 20th
"Today, as we head into the end of the quarter, we are rebalancing the Dividend Equity Growth Model early to take advantage of the recent stock decline. The model is designed to take advantage of the passive indexing flows into the largest company stocks, which should help provide relative market performance. The bottom 70% of the portfolio are equally weighted holdings of more fundamentally based companies with strong dividend histories."
Dividend Equity Growth Model
- Reduce the following holdings to 3.33% of the portfolio – O, MO, KO, VZ, XOM, MMM, DUK, KMI, NLY, AEP, and ABBV.
- Increase the following holdings to 3.33% of the portfolio – TFC and JPM
- Increase the following holdings to 5% of the portfolio – AMZN, MSFT, AAPL, NVDA, META, and GOOG
Lance Roberts, C.I.O., RIA Advisors
The post Is The Correction Over? appeared first on RIA.
Full story here Are you the author?Tags: Featured,newsletter