Lance Roberts
My articles My offerMy siteAbout meMy videosMy books
Follow on:TwitterSeeking AlphaFacebookAmazon
Inside This Week's Bull Bear Report
- The Clock Has No Hands
- How We Are Trading It
- Research Report - Bullish Exuberance Returns Following The Inauguration
- Youtube - Before The Bell
- Market Statistics
- Stock Screens
- Portfolio Trades This Week
Administrative Note - No Newsletter Next Week
Next weekend, I am flying to Vancouver to deliver the keynote address at Mike Campbell's annual Moneytalks Conference. As such, I won't be able to produce a newsletter next week.
I appreciate your patience, and the full newsletter will return the following week. Make sure to follow me on Substack, as I will provide updates on market events if they occur and need specific attention.
Thank you.
DeepSeek Shocks The Markets
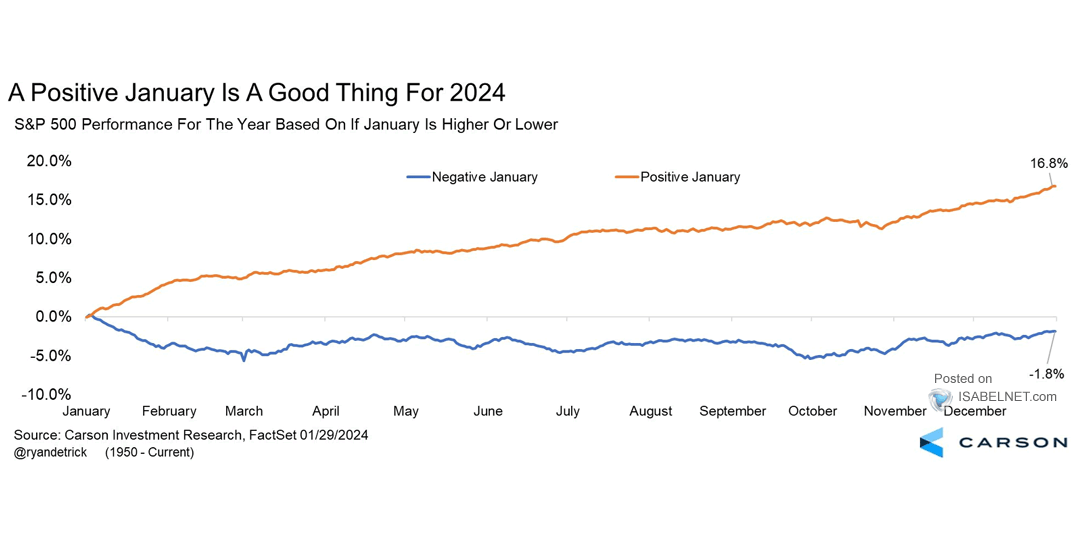
Last week, we noted that with the first five days of January making a positive return, such set the "January Barometer" in motion. If you missed our previous discussions, we reviewed the historical precedents of "So goes January, so goes the month." With Friday's close, the market turned in a positive month despite the "DeepSeek" shock to the markets this past Monday.
As noted by Stocktraders Almanac this past week, the January Barometer sets up a more bullish view of the year's outcome. To wit:
"A positive JB builds upon a positive First Five Days (FFD) and lessens the concerns that our Santa Claus Rally (SCR) failed to show. This will be just the fourth time since 1950 that our January Trifecta went down SCR, and up FFD and JB.
Focusing on just the positive JB alone has a solid track record. Up Januarys are followed by up years, 88.9% of the time (40/45 years), with an average S&P 500 gain of 17.0%. 14 of 18 of the last post-election years followed January’s direction. When January is positive in post-election years, 8 of 9 full years were up with an average gain of 17.8%. 2001 was the exception. January was up 3.5%, but the full year was down 13.0%.
Let’s remember that the January Barometer exists because of the Twentieth “Lame Duck” Amendment to the Constitution. The Amendment's passage in 1933 created the January Barometer. Since then, it has essentially been “As January goes, so goes the year.” January’s direction has correctly forecasted the market's major trend in many subsequent years."
However, while a positive January tends to coincide with a positive year return, February tends to be less optimistic. The first half of the month tends to carry on with January's momentum. However, weakness towards the month's latter half tends to be more common.

Despite Monday's concern about "DeepSeek," the market quickly absorbed the data, and bulls regained their footing. The market remains on a MACD 'buy signal,' which supports the current rally. However, the markets are back to being overbought in the short term. Furthermore, the market may temporarily struggle with all-time highs early next week. If the bulls can facilitate a breakout, it would coincide with early February strength. Such would align with market tendencies to reverse those overbought conditions later in the month.

Many uncertainties are ahead, such as the impact of tariffs on Canada and Mexico, announced Friday afternoon. As such, even though the market remains bullishly biased, continue to manage risks and allocations accordingly.
This week, we will discuss the surge in sentiment following the inauguration and what it may mean for the market.
Need Help With Your Investing Strategy?
Are you looking for complete financial, insurance, and estate planning? Need a risk-managed portfolio management strategy to grow and protect your savings? Whatever your needs are, we are here to help.

Market Panic Wakes Up Investors
In a Daily Market Commentary this week, we discussed the panic over the DeepSeek announcement, which hit some of the high-flying AI stocks fairly hard. (If you are unfamiliar with DeepSeek, I did a fairly deep dive into what we know in Tuesday’s blog post.
The most significant question everyone is wrestling with is whether this event causes the market to reprice everything. In other words, is DeepSeek potentially the "pin that popped" the A.I. bubble? Unfortunately, no one knows with certainty, nor do they ever. We will only know in hindsight.
However, whether or not the A.I. bubble is over, there are many reasons for concern, as we have expressed several times this year. While I will touch more on those reasons in today's newsletter, here are some links for further reading:
- Are Return Expectations For 2025 Too High?
- Tactically Bearish As Risks Increase
- “Curb Your Enthusiasm” In 2025
As is always the case, when very complacent and bullish investors are impacted by an exogenous and unexpected event, a vacuum of buyers forms. As we discussed previously, "sellers live higher, buyers live lower."
"The stock market is always a function of buyers and sellers, each negotiating to make a transaction. While there is a buyer for every seller, the question is always at “what price?”
In the current bull market, few people are willing to sell, so buyers must keep bidding up prices to attract a seller to make a transaction. As long as this remains the case and exuberance exceeds logic, buyers will continue to pay higher prices to get into the positions they want to own.
Such is the very definition of the “greater fool” theory.
However, at some point, for whatever reason, this dynamic will change. Buyers will become more scarce as they refuse to pay a higher price. When sellers realize the change, they will rush to sell to a diminishing pool of buyers. Eventually, sellers will begin to “panic sell” as buyers evaporate and prices plunge.”
On Monday, we saw an "exogenous and unexpected event," in this case, the DeepSeek announcement, which created a vacuum between those wanting to sell and those willing to buy. That vacuum left the market vulnerable to a correction, and while there were “willing buyers” for every transaction—they were just at much lower prices.
However, this is the problem with exuberance.
The Selloff Just Needed A Catalyst
A great note from Societe Generale sums up our current view on the magnitude of Monday's selloff.
“Market panics are common, and currently, it is understandable with American exceptionalism in full force. The Mag-5s (NVDA + its top 4 customers, i.e. Microsoft, Google, Amazon, Meta) have contributed approximately 700 points to the S&P 500 over the last 2 years. In other words, the S&P 500 excluding the Mag-5s would be 12% lower today. Nvidia alone has contributed 4% to the performance of the S&P 500. This is what we find to be the ‘American exceptionalism’ premium on the S&P 500.”
Okay, why were investors panic selling if that is the case?
As we previously warned, when “everyone is on the same side of the boat,” an unexpected, exogenous event causes sharp reversals.
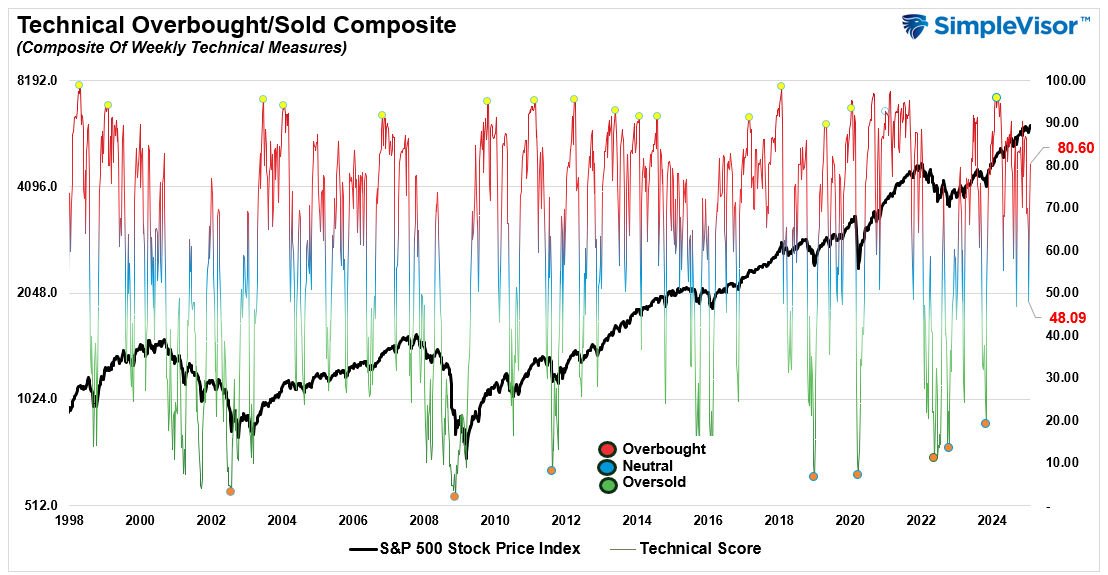
Over the last two weeks, sentiment reversed from negative to extremely bullish following the inauguration. In this week’s #BullBearReport, we stated that “the technical gauge reversed sharply for short-term oversold back to more bullish levels. While not at more severe “overbought” warning levels, current levels suggest that near-term upside could be somewhat limited.“
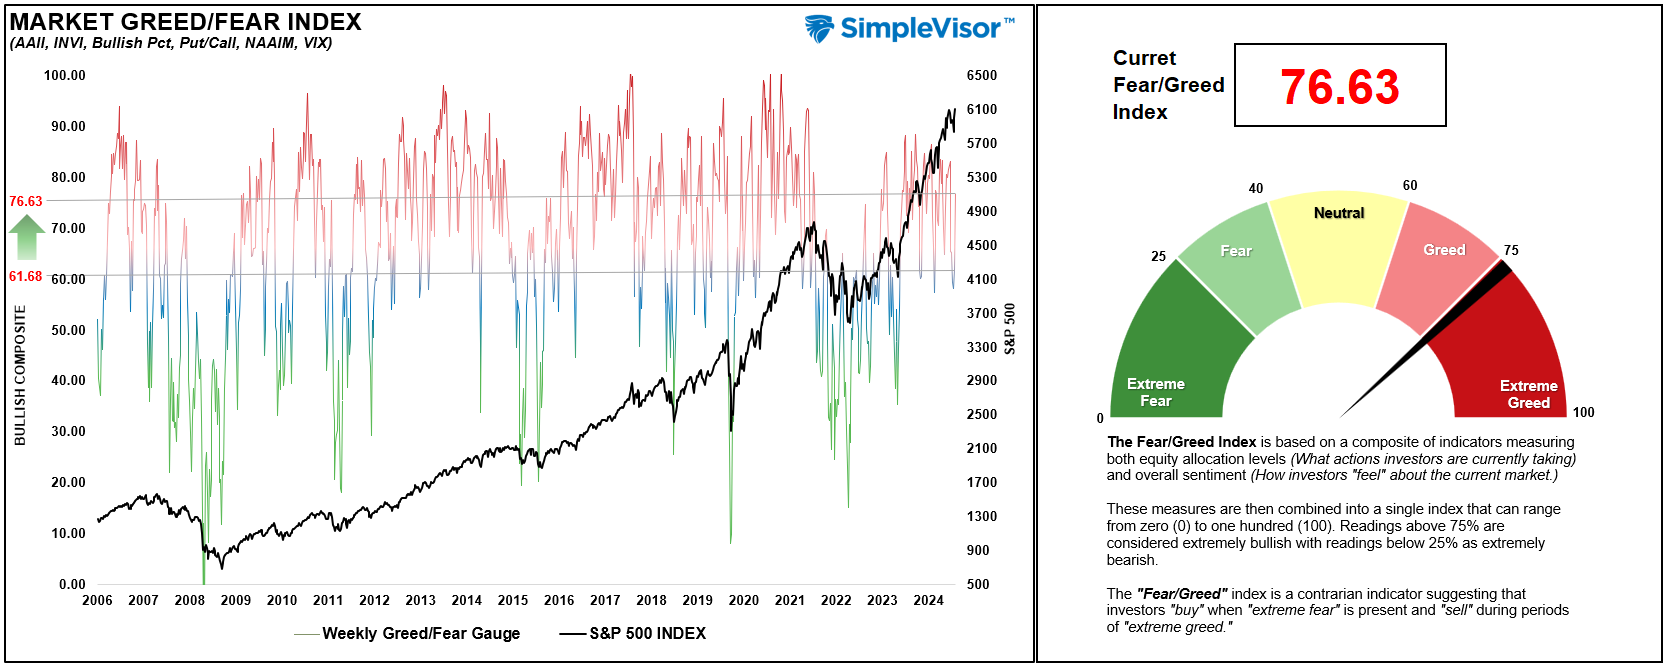
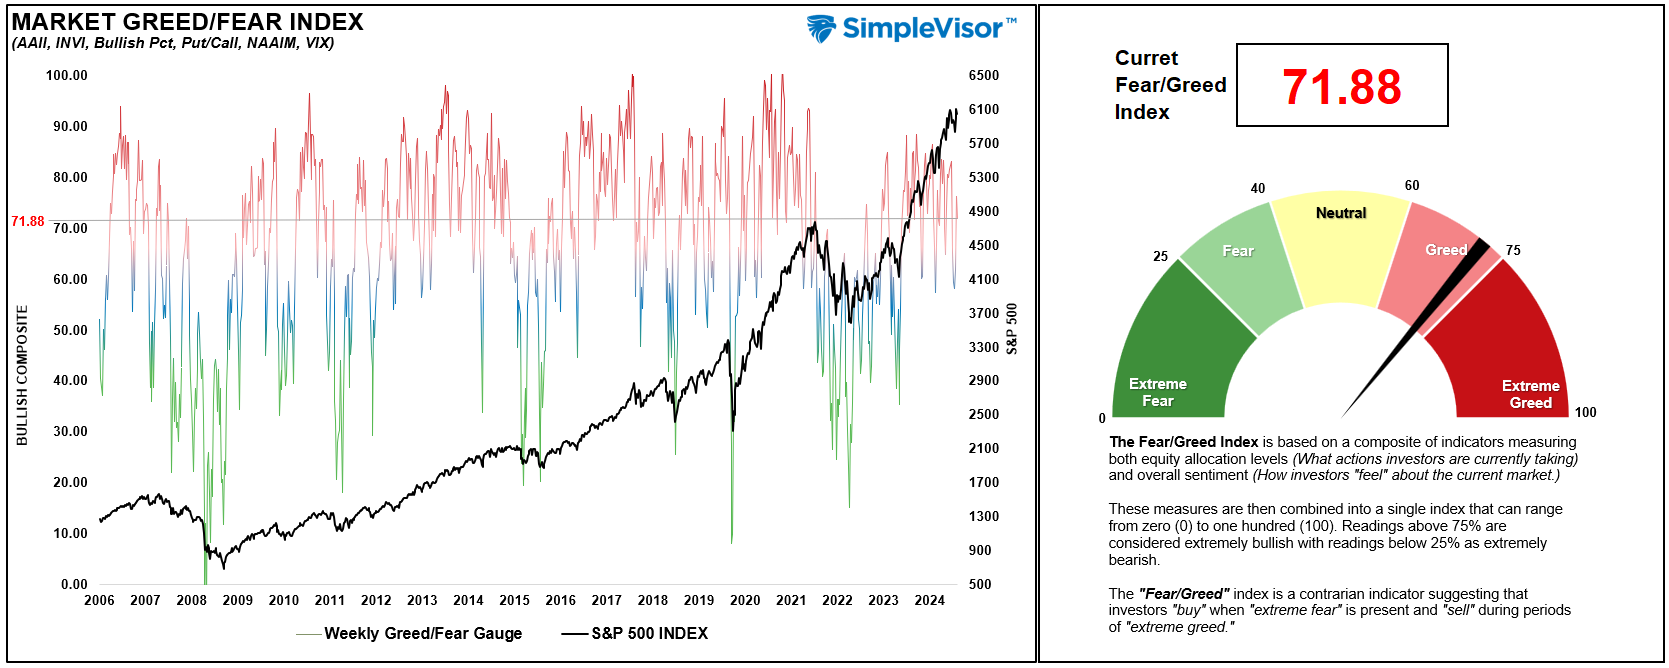
Furthermore, the investor “Fear/Greed” gauge moved from neutral territory back into extreme greed. This indicator is based on how professional and retail investors position themselves based on equity allocations, including options, bullish and bearish sentiment, and concerns about risk.
We see the same surge in investor sentiment by the standard deviation of “net bullish sentiment.” After reversing rather sharply from the December highs, investing sentiment reversed sharply last week following the inauguration. While not back to more extreme levels, the swiftness of the reversal has been remarkable.
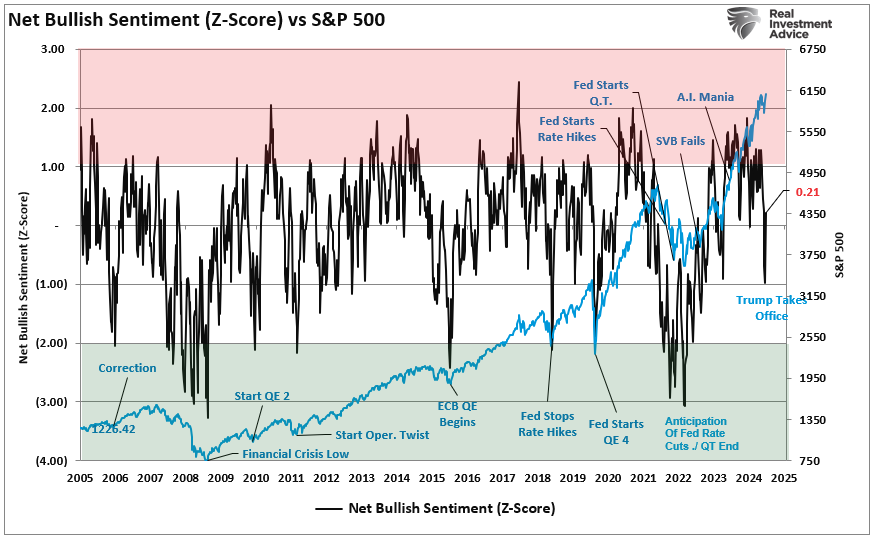
Up until now, the A.I. field has been dominated solely by U.S. companies. That dominance led to a rise in markets driven by a handful of mega-capitalization companies. Suddenly, everything has changed, or at least it seems that way. With everyone short-term bullish on the market, the risk of a reversal was elevated. Such is particularly true when an unexpected event, like DeepSeek, causes the market to question current earnings growth assumptions.

This is why, as investors, we must remain vigilant about the risks we take within our portfolios, as we are never fully sure what "time it is" within any given market cycle.
The Clock Has No Hands
This past week, Jason Zweig had a great commentary in the WSJ:
“Whenever markets feel euphoric — like, say, right now! — I’m always haunted by a paragraph Goodman wrote in the late 1960s, during a mania that came to be known as ‘the great garbage market.’ Here it is, as published in his 1972 book Supermoney:”
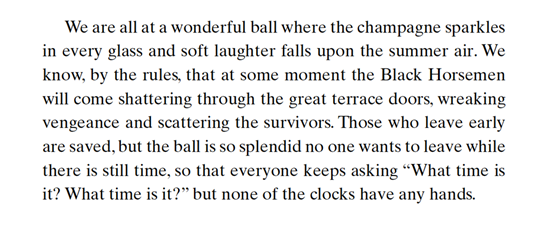
“I’m not saying that the bull market is about to end. However, you should always seek to take the other side of the trade from the market’s dominant emotion. As other people verge on ecstatic, you should become more skeptical. After decades of learning about market booms and busts throughout history, it seems to me that one of the universal laws is that the smarter investors are, the more they believe they’re smart enough to scale back on an overvalued market before it’s too late.
They think that by constantly asking ‘What time is it?’ they’re learning whether there’s still time to make money. What they should be reminding themselves, before it really is too late, is: But none of the clocks have any hands.“
This is the conundrum that investors currently face.
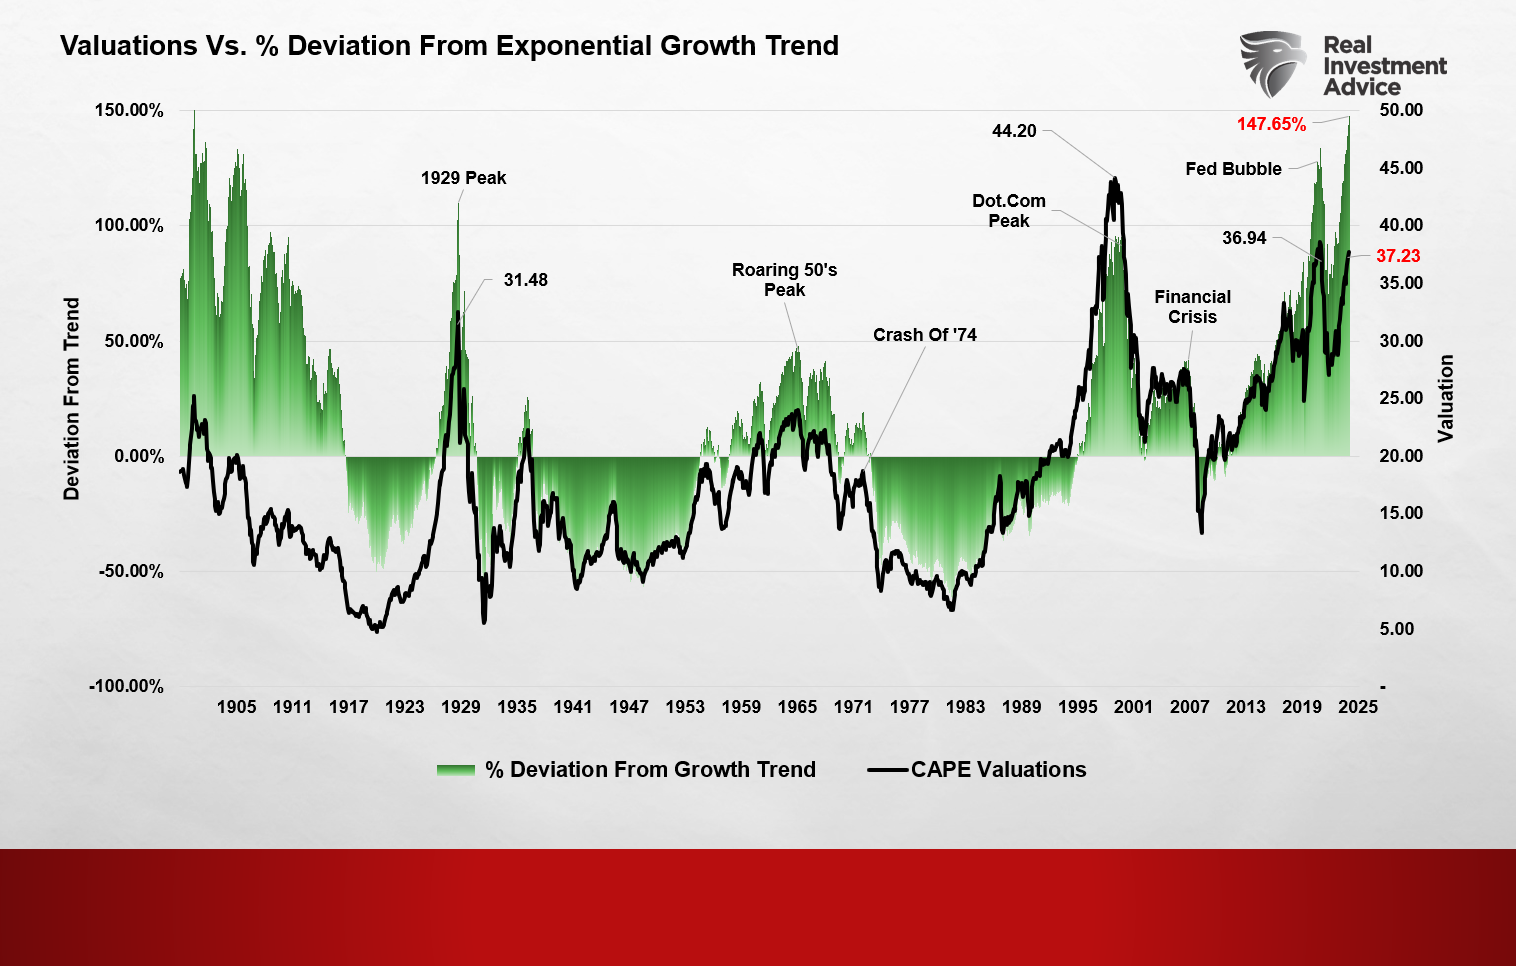
At our 2025 Economic and Investment Summit, we discussed the exceedingly high valuations investors pay to own assets. The chart below shows the S&P 500's current deviation from its long-term, exponential growth trend. At 147%, that deviation is among the highest levels on record and surpasses that of both the "Dot.com" and "Financial Crisis" peaks. Unsurprisingly, investors' overpayment of future earnings has also pushed current valuations to some of the highest levels on record.
Given that the market has consistently risen over the last 15 years, it has trained investors to rationalize several beliefs about the market to support consistent levels of overvaluation.
Here are some of the most common rationalizations used over the last decade.
- Corporate managers have become so adept at their jobs that profit margins and equity valuations will remain at or rise from current nearly unprecedented levels.
- The Fed will always bail out the market.
- Annual fiscal deficits over $1 trillion will power economic growth without consequences.
- The rising number of corporate bankruptcies is a “non-event” due to the Fed.
- Technology companies are the best place to invest now and in the future, as they can continue to grow their earnings.
- Corporations, via stock buybacks, will continue to be the predominant purchaser of U.S. stocks.
- Liquidity flows to the financial markets are never going to stop.
- Central Banks can permanently prop up asset prices.
- Valuations don’t matter. Just the Fed.
- The stock market is a situation where you can’t lose. Buy stocks as they always go up.
- This time is different.
The following chart best encapsulates the last point. At no point in previous history have consumers been this confident about higher stock prices in the next year. Of course, that optimism is encapsulated by the rise in trailing one-year valuations.

As long as markets rise, valuations are not an issue. However, given that the "clock has no hands," we never know what market cycle phase we are in.
The same was true in 1999 and 2007.
Am I suggesting that another "market event" is imminent? No.
But given that the clock we are watching tells us little, we must remain invested until chimes start to ring.
How We Are Trading It
So, if the "clock has no hands," how can investors navigate the potentially late hour?
It is difficult to be unemotional when it comes to your money.
There are times, such as now, when logic states that we must participate in the current opportunity. However, emotions of “greed” and “fear” cause individuals to take on too much exposure, and a crash could occur at any moment. These emotionally driven decisions tend to lead to worse outcomes over time.
As Howard Marks stated, individuals must remain unemotional and adhere to strict investment discipline in times like these. Based on Marks's view on risk management, I thought of sharing the rules that drive our investment discipline.
Managing money can be difficult, particularly when unexpected, exogenous events occur. However, we must learn to accept responsibility for our mistakes, act prudently, and respond logically to a changing market environment.
We are all human and suffer from the same frailties. However, we can mitigate those flaws through the fundamental, economic, and price analysis, which forms the foundation of overall risk exposure and asset allocation. The following rules are the “control boundaries” under which we strive to operate.

Every investor has their own set of rules. These are just ours.
Given that our clock suggests we are late in the hour, it is worth reviewing your trading rules and making sure you are managing risk accordingly.
Feel free to reach out if you want to navigate these uncertain waters with expert guidance. Our team specializes in helping clients make informed decisions in today’s volatile markets.
Have a great week.
Research Report
Subscribe To “Before The Bell” For Daily Trading Updates
We have set up a separate channel JUST for our short daily market updates. Please subscribe to THIS CHANNEL to receive daily notifications before the market opens.
Click Here And Then Click The SUBSCRIBE Button
Subscribe To Our YouTube Channel To Get Notified Of All Our Videos
Bull Bear Report Market Statistics & Screens

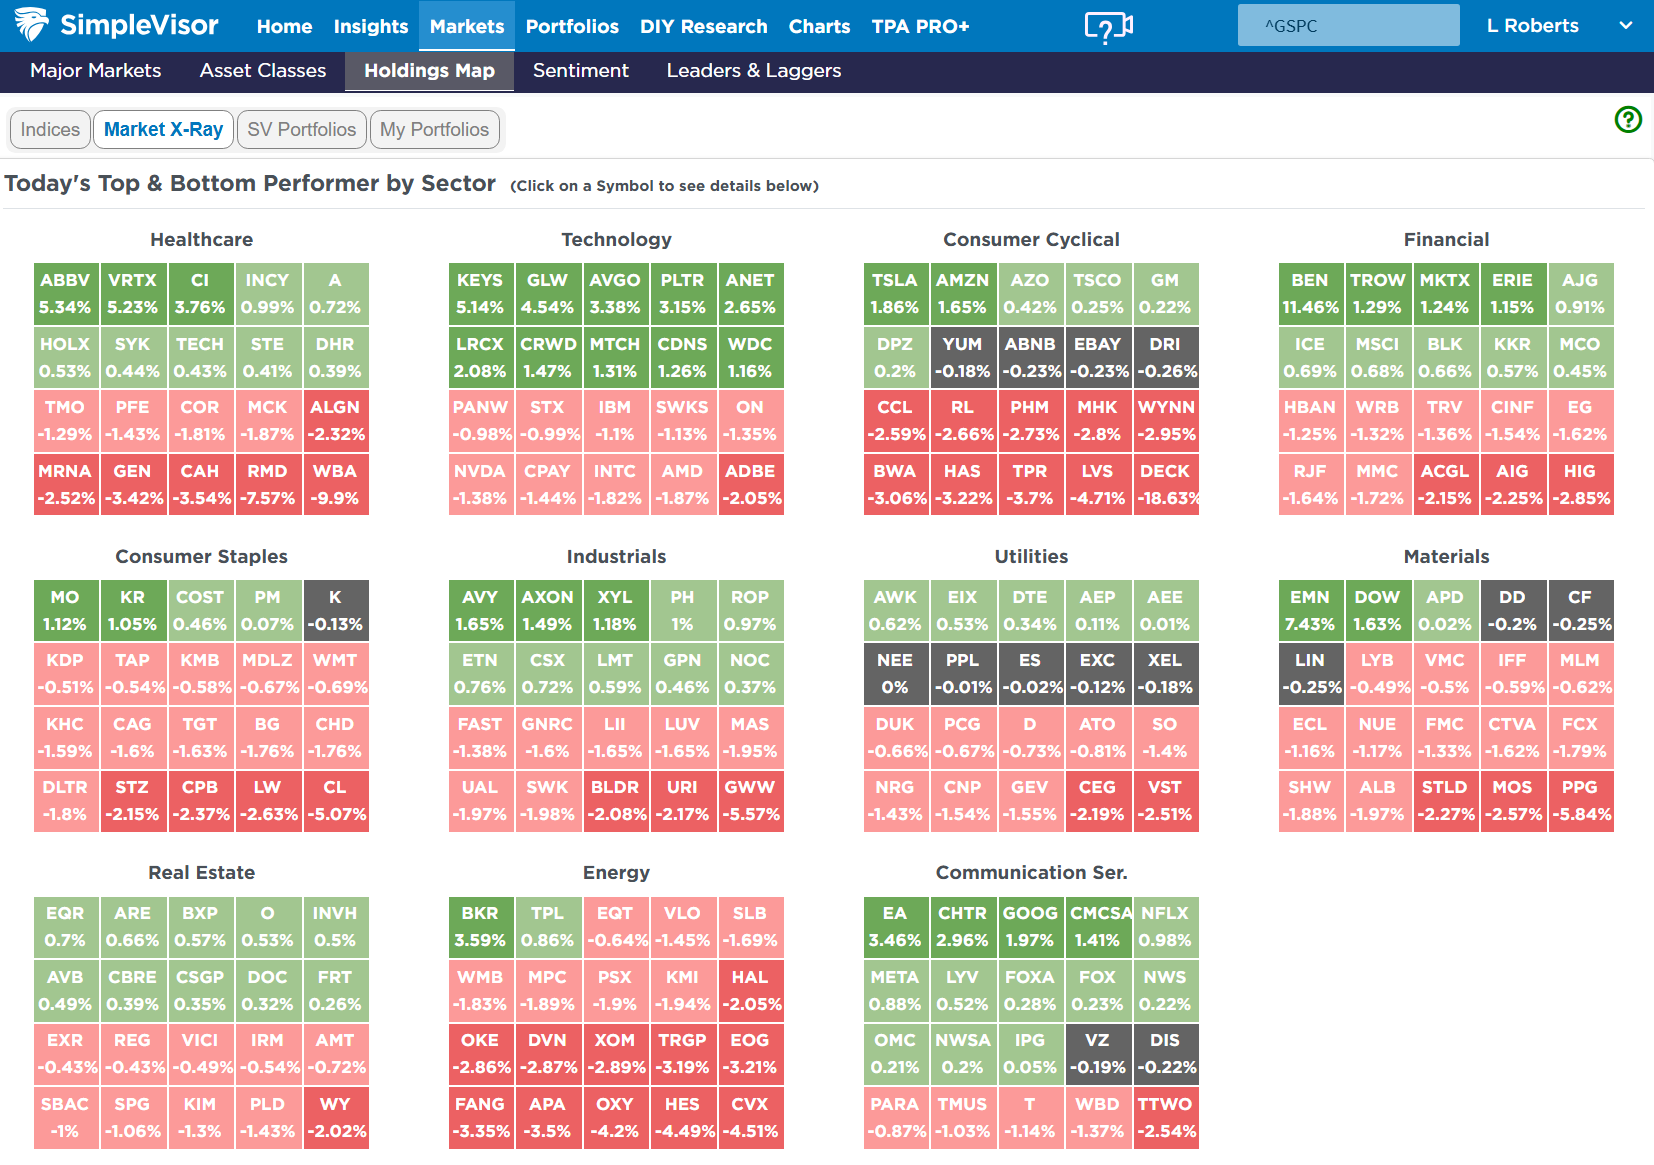
SimpleVisor Top & Bottom Performers By Sector
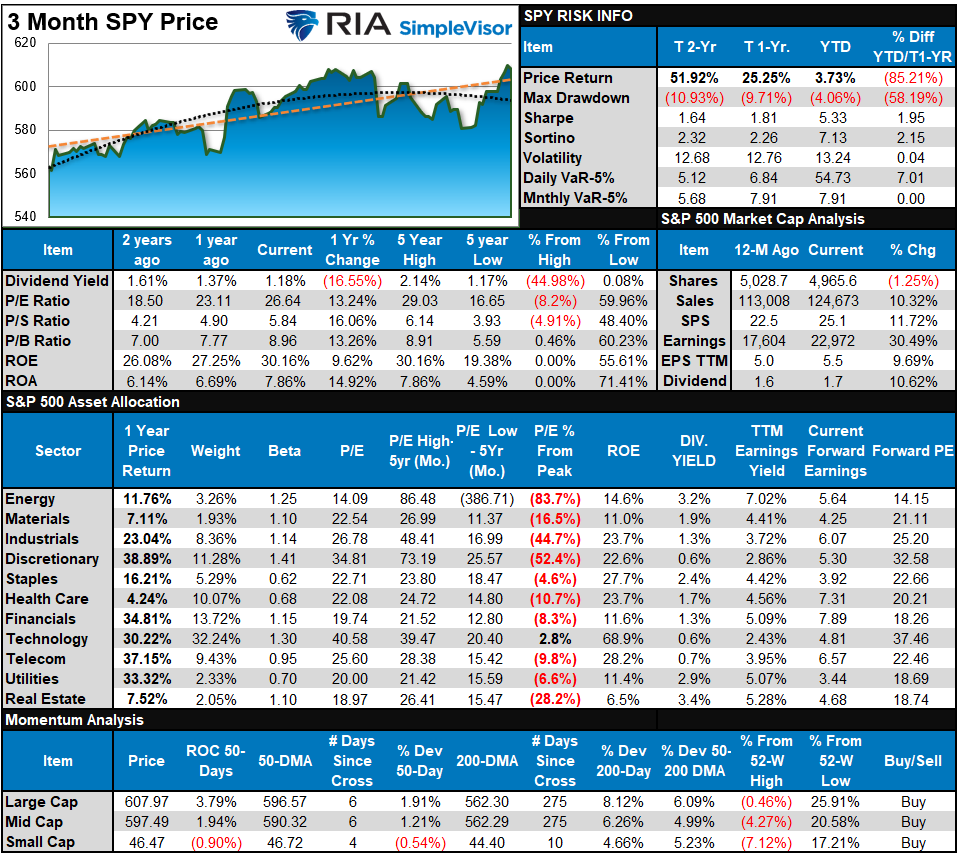
S&P 500 Weekly Tear Sheet
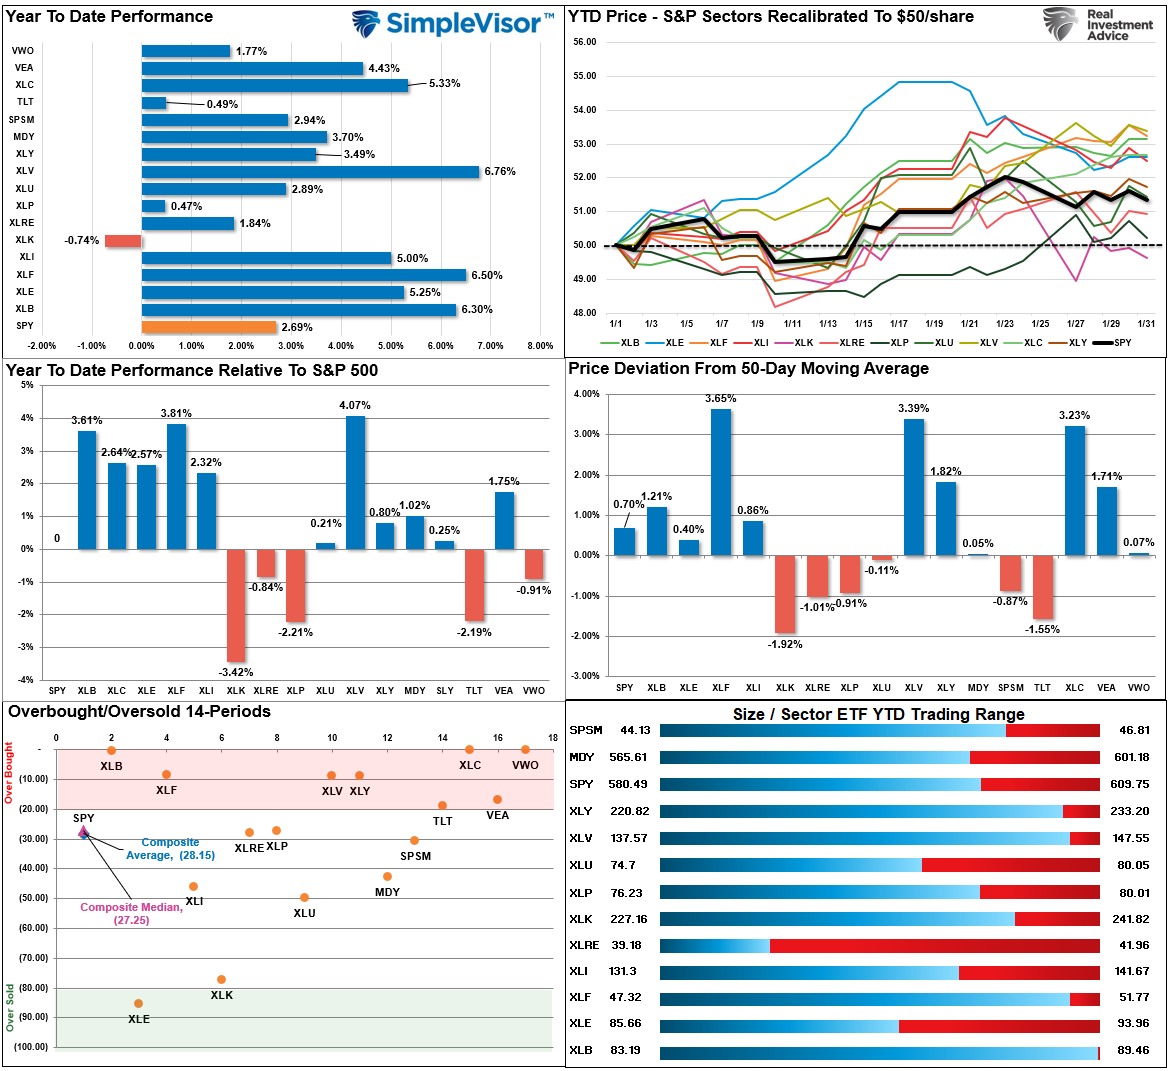
Relative Performance Analysis
In last week’s newsletter, we noted that the "inauguration" rally pushed most markets and sectors into overbought territory and could limit the upside. The "DeepSeek" announcement on Monday collided with that overbought condition, providing a pullback to the 50-DMA. While the market held that support, only Technology and Energy meaningfully reverted to oversold levels. As noted in the relative analysis below, technology is the most oversold sector, and we may see some rotation out of materials and communications into some of those stocks over the next few weeks.
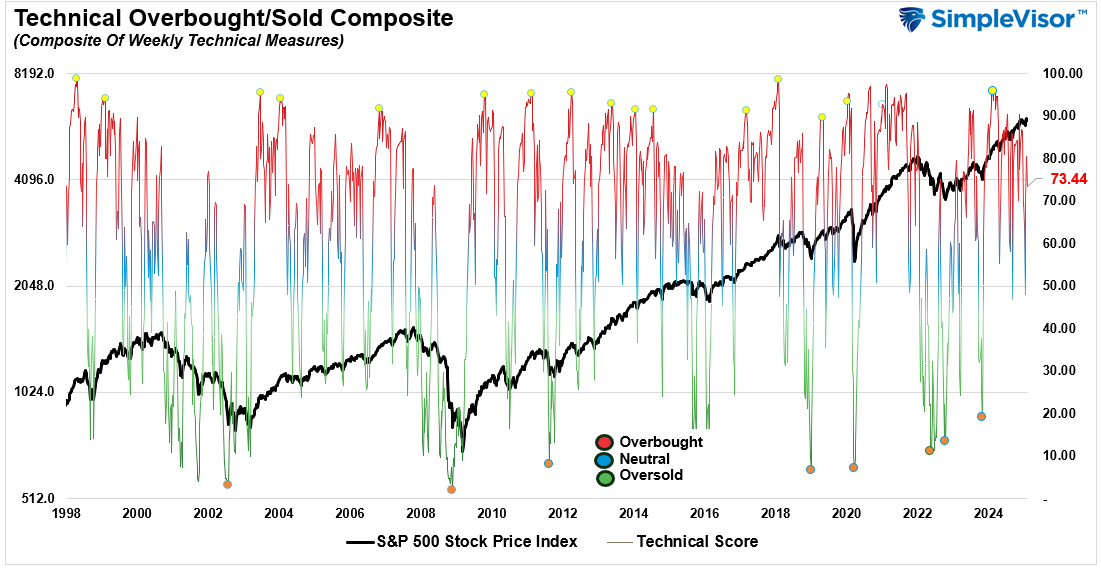
Technical Composite
The technical overbought/sold gauge comprises several price indicators (R.S.I., Williams %R, etc.), measured using “weekly” closing price data. Readings above “80” are considered overbought, and below “20” are oversold. The market peaks when those readings are 80 or above, suggesting prudent profit-taking and risk management. The best buying opportunities exist when those readings are 20 or below.
The current reading is 73.44 out of a possible 100.
Portfolio Positioning “Fear / Greed” Gauge
The “Fear/Greed” gauge is how individual and professional investors are “positioning” themselves in the market based on their equity exposure. From a contrarian position, the higher the allocation to equities, the more likely the market is closer to a correction than not. The gauge uses weekly closing data.
NOTE: The Fear/Greed Index measures risk from 0 to 100. It is a rarity that it reaches levels above 90. The current reading is 71.88 out of a possible 100.
Relative Sector Analysis
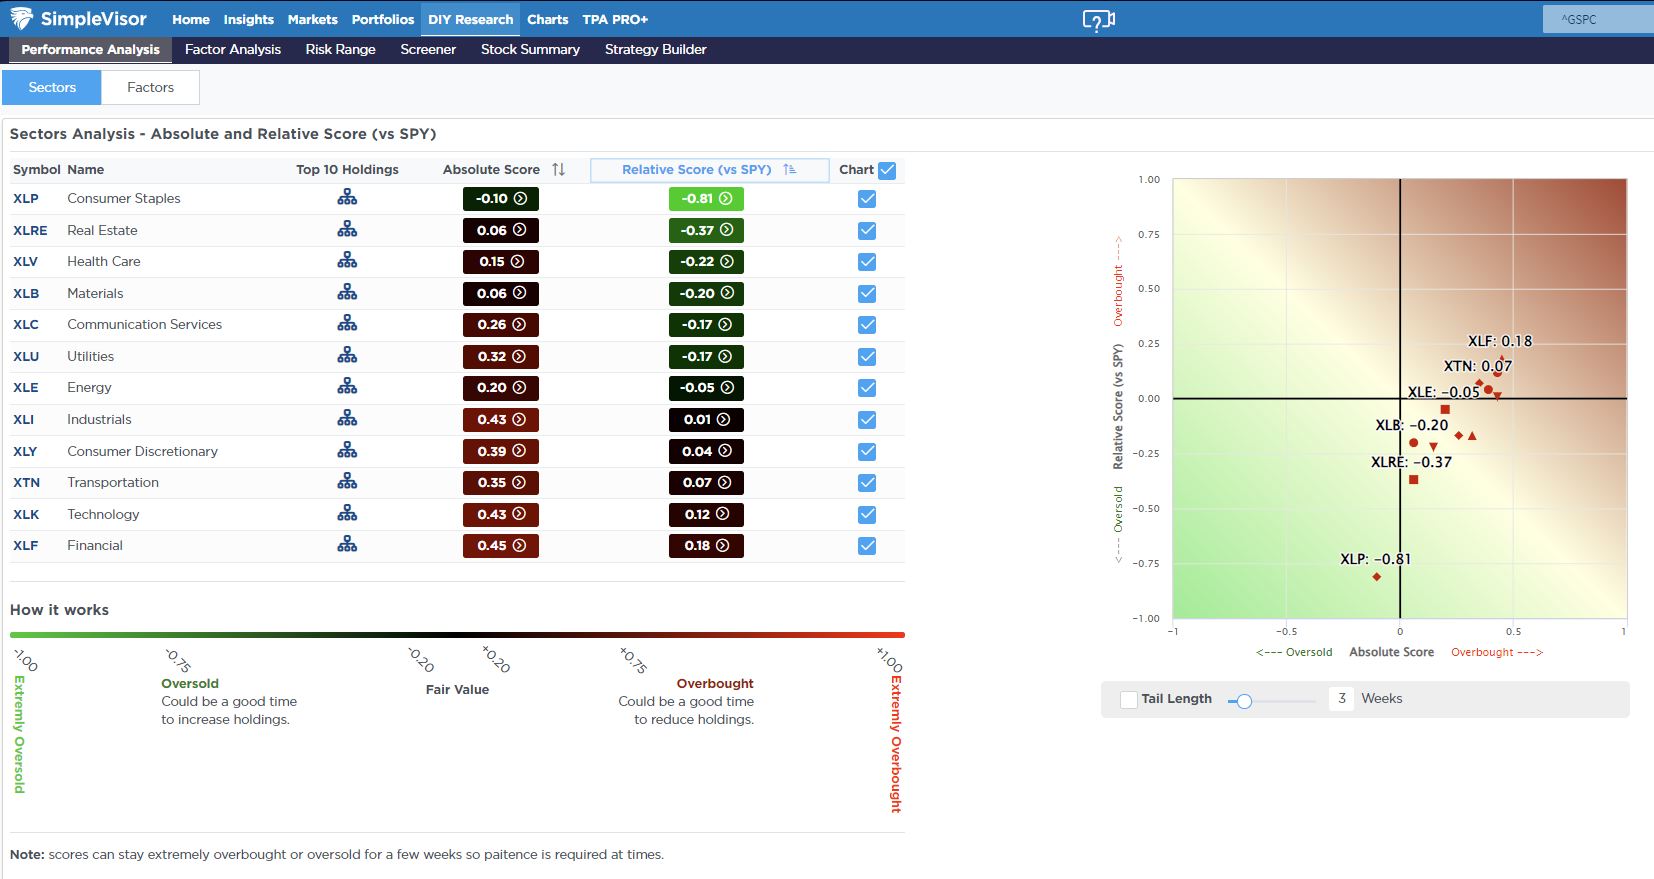
Most Oversold Sector Analysis

Sector Model Analysis & Risk Ranges
How To Read This Table
- The table compares the relative performance of each sector and market to the S&P 500 index.
- “MA XVER” (Moving Average Crossover) is determined by the short-term weekly moving average crossing positively or negatively with the long-term weekly moving average.
- The risk range is a function of the month-end closing price and the “beta” of the sector or market. (Ranges reset on the 1st of each month)
- The table shows the price deviation above and below the weekly moving averages.
Last week, we noted that:
"The furious rush into equities continued following the inauguration, pushing many sectors and markets (noted in red) above their normal monthly risk ranges. Notably, the bullish trend remains intact with the break out to new highs. Continue holding equity exposures at current levels, but rebalance sectors and markets that are grossly deviated from long-term means."
That recommendation to rebalance grossly extended sectors worked well, as the "DeepSeek" announcement on Monday and tariffs on Friday reversed some of the previous overbought conditions. The "Risk/Range" table has been reset for February and will be updated next week. However, we note that an increasing number of sectors are starting to flip onto bearish signals, which typically precede consolidations or corrective periods.

Weekly SimpleVisor Stock Screens
We provide three stock screens each week from SimpleVisor.
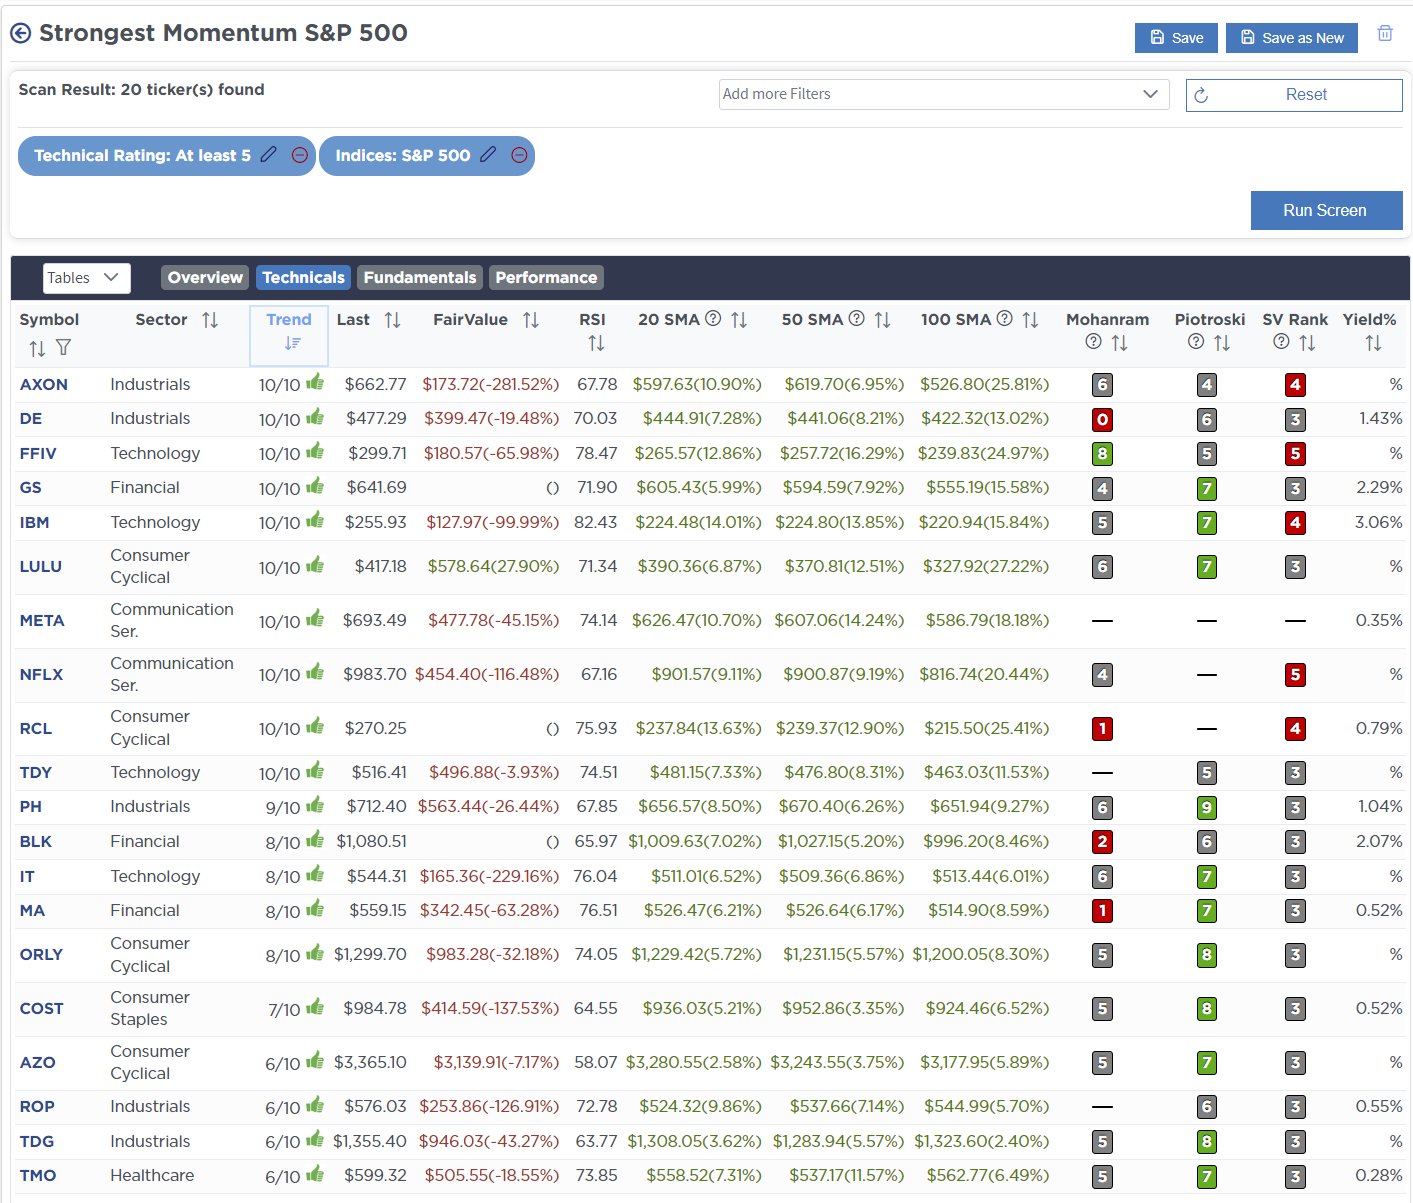
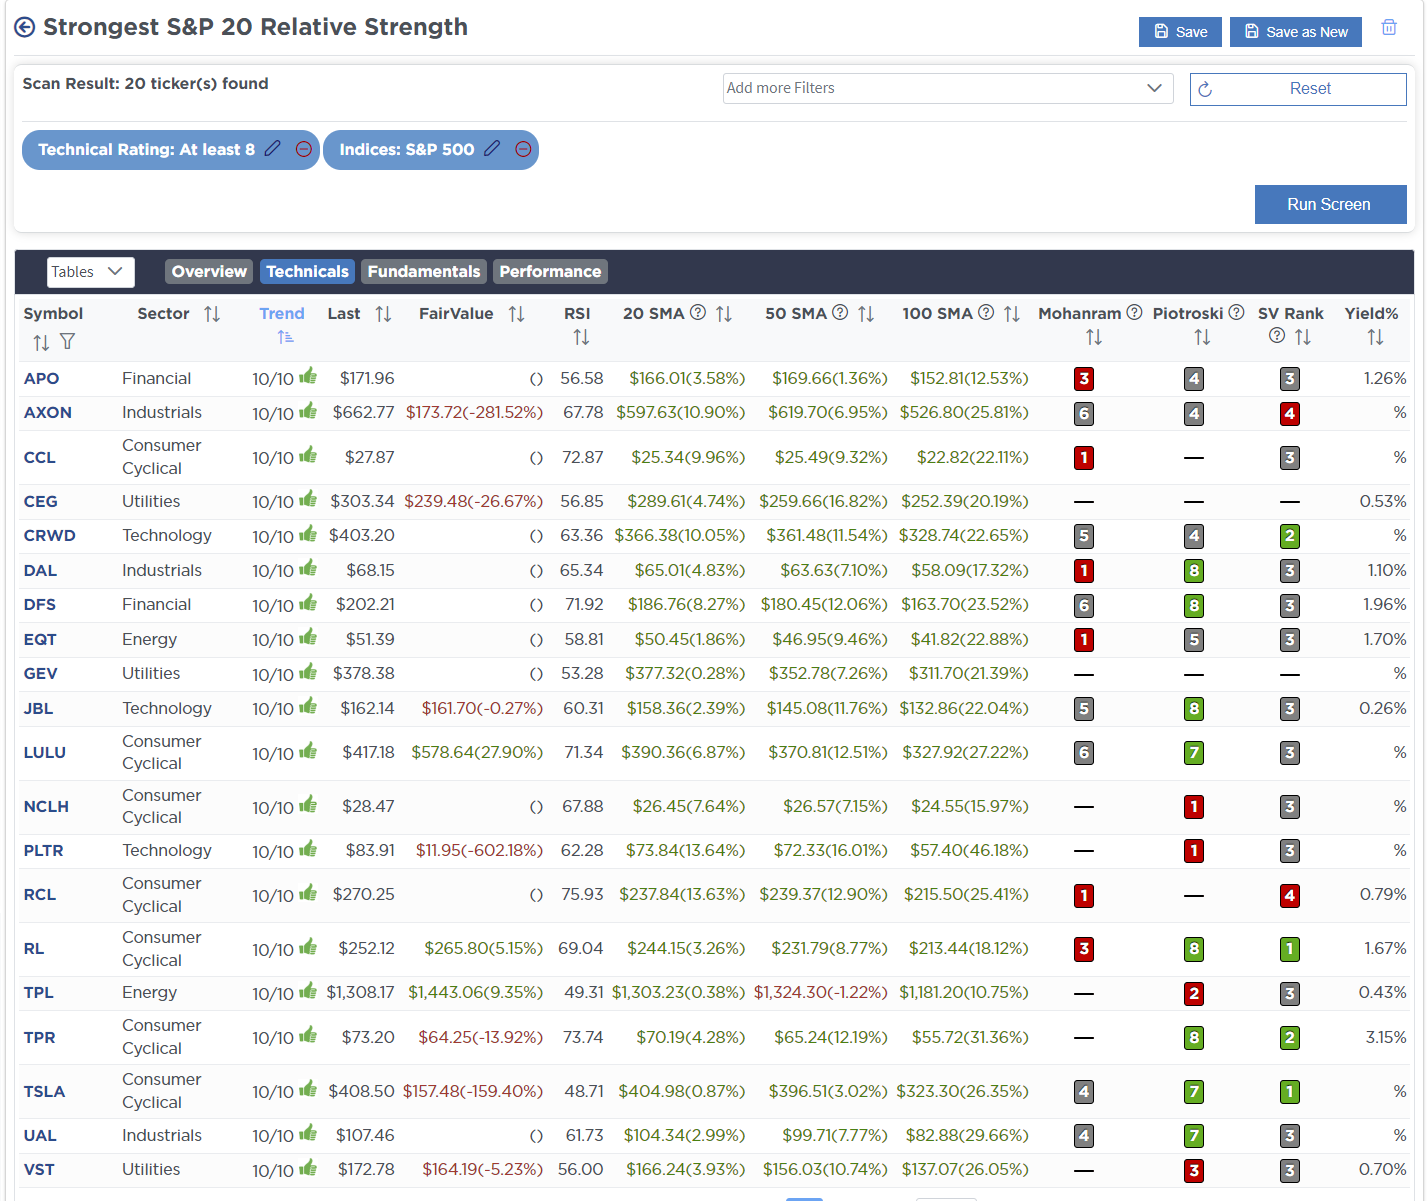
This week, we are searching for the Top 20:
- Relative Strength Stocks
- Momentum Stocks
- Fundamental & Technical Strength W/ Dividends
(Click Images To Enlarge)
RSI Screen

Momentum Screen
Technically Strong With Buy Rating
SimpleVisor Portfolio Changes
We post all of our portfolio changes as they occur at SimpleVisor:
No Trades This Week
Lance Roberts, C.I.O., RIA Advisors
The post The Clock Has No Hands appeared first on RIA.
Full story here Are you the author?Tags: Featured,newsletter