Inside This Week's Bull Bear Report
- Inauguration Sends Confidence Higher
- How We Are Trading It
- Research Report - Do Money Supply, Deficit & QE Increase Inflation
- Youtube - Before The Bell
- Market Statistics
- Stock Screens
- Portfolio Trades This Week
January Barometer On Track
Last week, we noted that with the first five days of January making a positive return, such set the "January Barometer" in motion. If you missed our previous discussions, we reviewed the historical precedents of "So goes January, so goes the month."
“However, even with a failed Santa rally, the January barometer holds the key for the year. Historically, a positive January has been a bullish sign for stocks. The chart below highlights that the popular Wall Street maxim has stood the test of time. Since 1950, the S&P 500 has posted an average annual return of 16.8% during years that included a positive January. Furthermore, the index generated positive returns in 89% of these years. In contrast, when the index traded lower in January, annual returns dropped to -1.7%, with only 50% of occurrences yielding positive results.”

The rally leading up to and following the inauguration pushed markets back to all-time highs. While the month is not over yet, the return of bullish sentiment bodes well for the market to finish the month in positive territory. Furthermore, the current rally is being supported by positive earnings announcements, improvement in sentiment, and, most importantly, a return of share buybacks. Such was a previous point I made on “X.”
“Speaking of share buybacks, in today’s trading update I published the following two charts showing the correlation between the ebbs and flows of buybacks vs the market. Given we have been in a blackout period over the last few weeks, the market weakness was unsurprising. In 2025, the market is expected to set a record of $1 Trillion in repurchases.”

Technically speaking, the market has triggered a MACD 'buy signal,' which supports the current rally. However, the markets are back to decently overbought levels in the short term. Furthermore, the deviation from the 50-DMA is getting rather large, which may limit some near-term upside. Therefore, as always, do not negate managing risk and allocations accordingly.

This week, we will discuss the surge in sentiment following the inauguration and what it may mean for the market.
Need Help With Your Investing Strategy?
Are you looking for complete financial, insurance, and estate planning? Need a risk-managed portfolio management strategy to grow and protect your savings? Whatever your needs are, we are here to help.

Inauguration Sends Confidence Surging Higher
Just after the election of President Trump in Trump, we noted in our Daily Market Commentary that business confidence would likely follow. To wit:
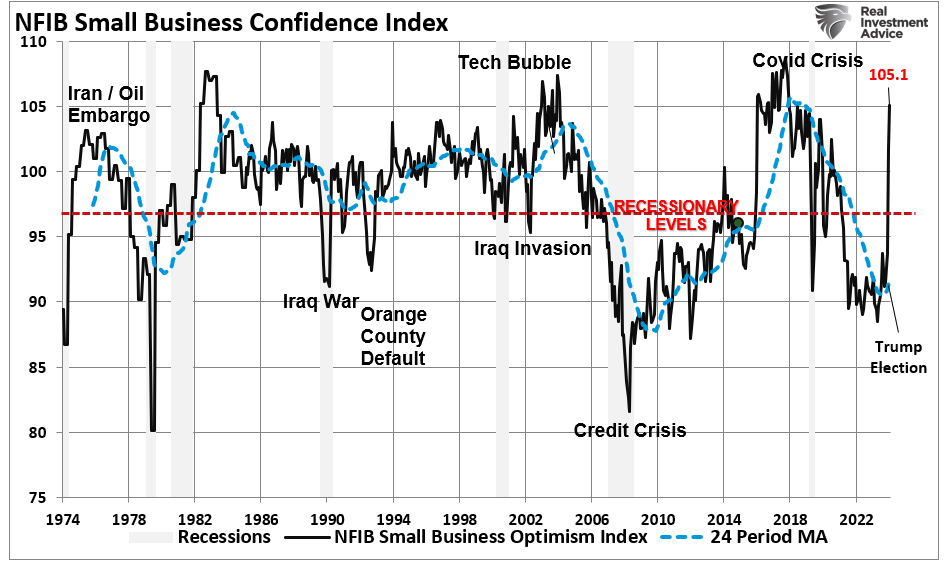
"Yesterday, we discussed the massive surge in the markets following the election of President Trump. Notably, the massive surge in small/mid-cap stocks was the most compelling. There is a very high correlation between small/mid-cap stocks’ annual rate of change and the NFIB small business confidence index. Business owners tend to lean conservatively, favoring policies that promote economic growth, reduced regulations, and tax cuts. The election yesterday supports business owners.
We suspect that the next iteration of the NFIB index will be a catchup move fueled by an explosion of business owners’ confidence. This should increase CapEx spending, employment, and wage growth."
Unsurprisingly, since the election, the NFIB confidence index has surged from some of the lowest readings on record for the past four years to some of the highest.
However, it is not just the improvement of small business owners' confidence; the CEOs of large companies are also becoming much more optimistic. As shown, and unsurprisingly, there is a correlation between the improvement or decline in CEO confidence and the annual rate of change in the financial markets.
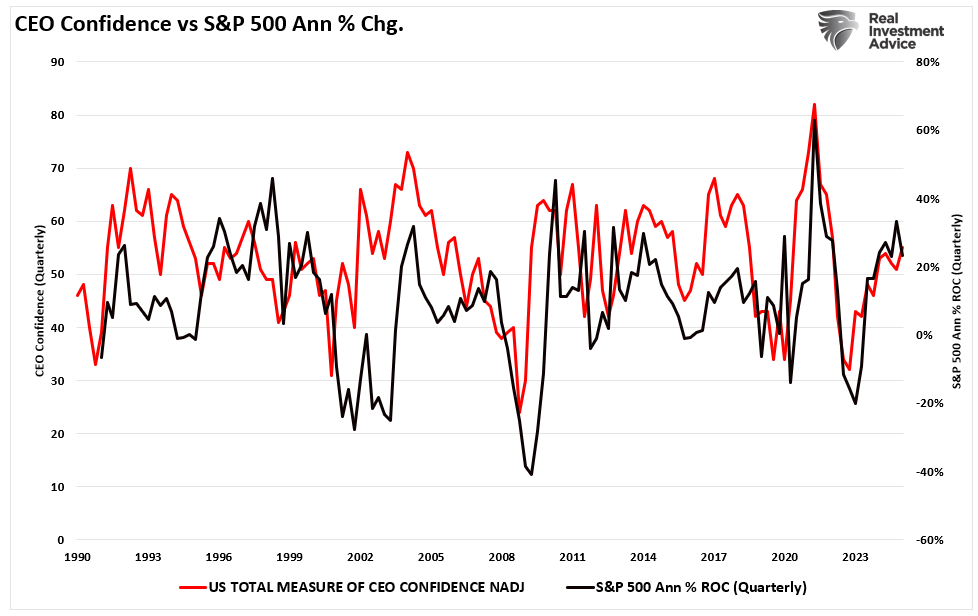
The improvement in optimism is unsurprising given the many anti-business policies and regulations implemented by the former administration. With many of the previous regulatory hurdles either being immediately repealed or promised to be, business owners are "feeling" much more confident about the future of their businesses.
Note that I put "feeling" in quotes.
This is because the NFIB, CEO, consumer confidence, and most business surveys are based on "sentiment." While sentiment is important to business decision-making, economic outcomes can easily reverse it. In other words, optimism must be supported by improving economic activity.
Will Confidence Translate To Action
Understanding the balance between "sentiment" and "hard data" is crucial.
For example, small business owners are very excited about the economy's prospects under the new administration. However, if demand for their products, goods, and services does not improve, there is no reason to increase employment. The chart below shows the current readings of expected employment increases over the next three months compared to hires over the previous three months. Notice the gap between expectations and reality.
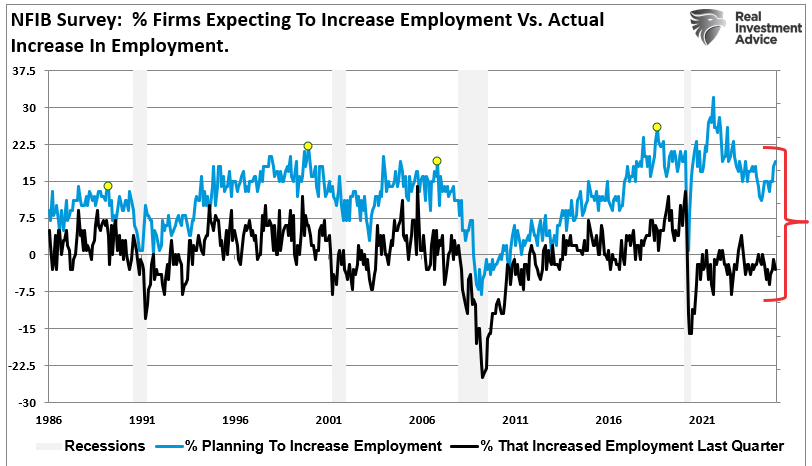
That gap is because, despite strong economic data from government data on employment and GDP, the actual demand for goods and services for small and mid-sized businesses failed to appear. The next chart explains the conundrum between expected sales over the next quarter and actual sales from the previous quarter.
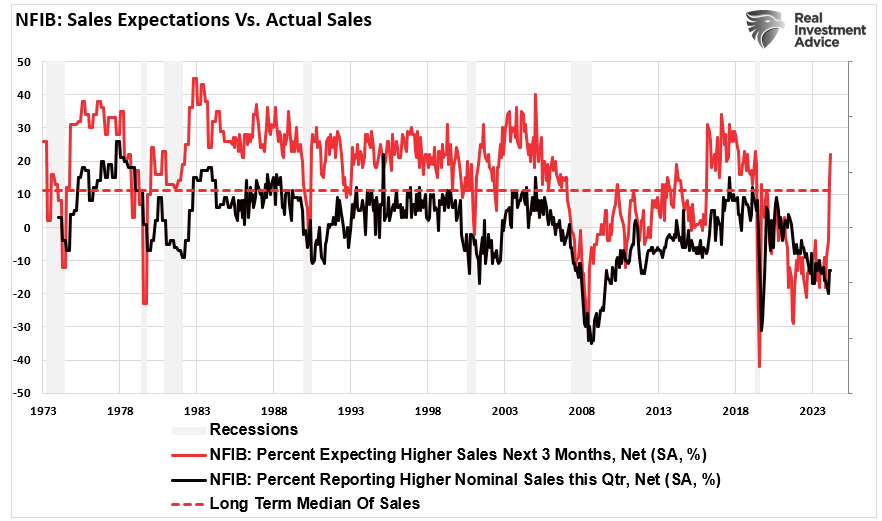
While business owners are very excited about sales prospects following the inauguration, that sentiment will quickly reverse if actual sales do not increase markedly. Furthermore, while it is hoped that employment will rise, the need for employment will depend heavily on the magnitude of the demand for the products or services sold.
The same holds for capital investment in the economy. Capital expenditures, or CapEx, are also an important driver for overall economic growth, employment, and wage increases. Private investment is part of the overall GDP calculation and correlates closely to the economy's ebbs and flows.
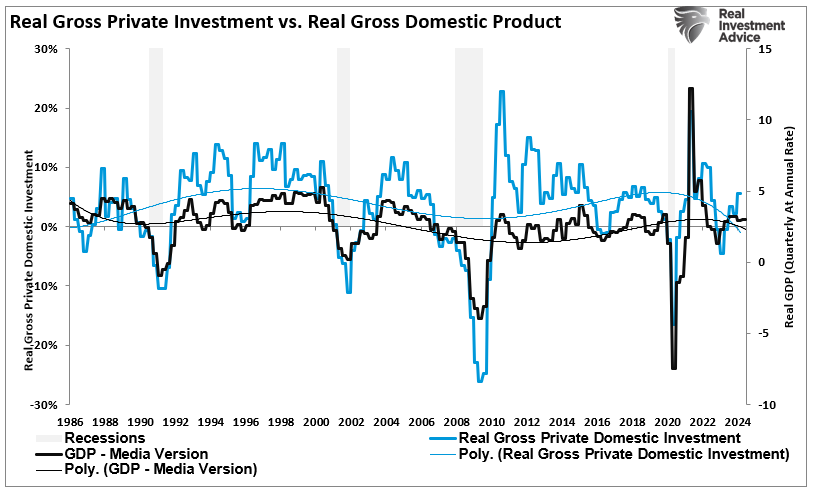
The recent NFIB survey shows that expectations for CapEX have surged to some of the highest levels on record. However, if the underlying economic growth does not rise to support those expectations, which will come from increased sales and employment needs, the plans for capital expenditures will reverse.
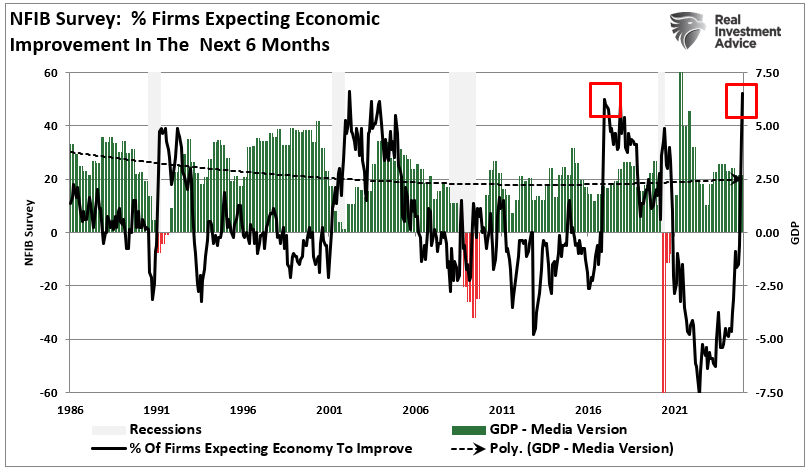
Again, while businesses are very optimistic about the future, their expectations heavily depend on one primary factor—the consumer.
Can The Consumer Meet The Demand Requirements
Regarding the economy, Personal Consumption Expenditures (PCE) comprise nearly 70% of the GDP calculation. In other words, if the consumer fails to provide the underlying demand for goods and services, all business owners' plans are quickly shelved. While there has been an increase in consumer confidence following the inauguration, it is not nearly as optimistic as the plans by business owners. Notably, PCE has been stable over the last two years and in line with historical norms. In other words, without a strong increase in employment and wages, PCE will unlikely grow substantially enough to support more exuberant expectations.
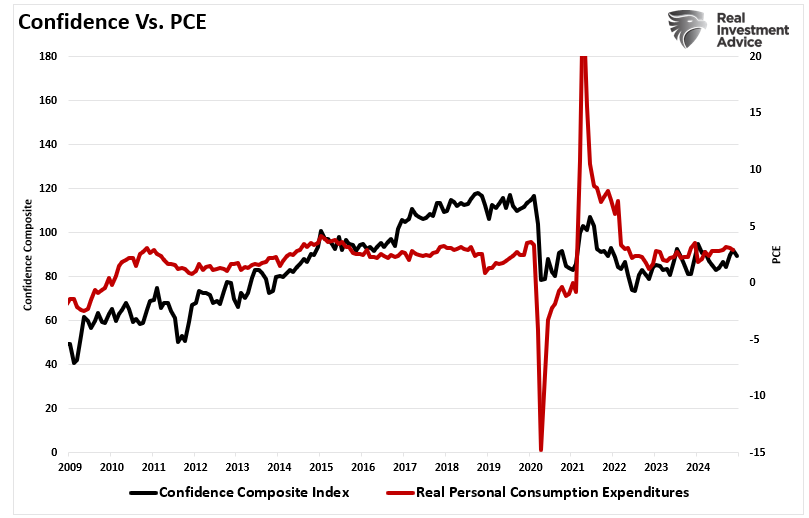
There are a few reasons why such could be the case.
First, retail sales have been flat over the last few years following the pandemic changes. Such "flat" periods generally only occur before recessionary onsets, suggesting that consumer demand is slowing.

Secondly, full-time employment is crucial to the consumer demand cycle. Full-time employment provides sufficient wages to support a household and increases demand for goods and services. Unfortunately, full-time employment has declined in recent months, suggesting less economic demand. The chart below shows full-time employment as a percentage of the working-age population. Notably, while business owners are very optimistic about the future following the inauguration, full-time employment has peaked and is declining. Historically, such has only occurred before recessionary onsets, but notably, that decline should not be occurring in a strong "employment" environment.

Third, wage growth is unlikely to increase substantially if full-time employment declines. Increasing economic demand will be more difficult without wage growth and full-time employment. Crucially, the decline in wage growth only exacerbates the fact wages have failed to keep up with inflation. Such will only increase the drag on economic performance, as consumers cannot increase demand substantially.
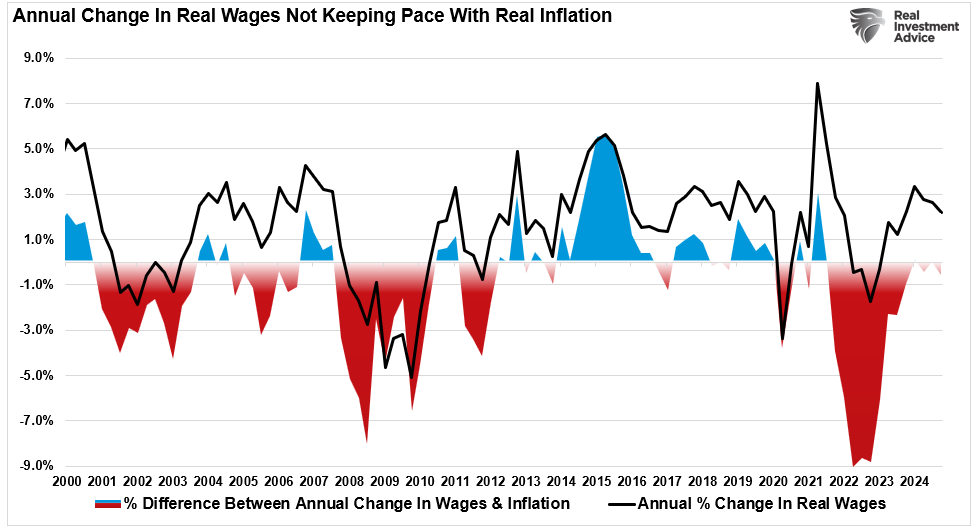
Certainly, I am not saying that these trends can not reverse sharply higher; they could. However, such a reverse would require a rapid decline in inflationary pressures, a drop in interest rates, and a surge in consumer demand from rising wages and employment.
Given the current economic data, the high levels of business optimism seem at risk of disappointment as the "confidence dichotomy" continues.
That dichotomy will be something we address closely as more data becomes available.
How We Are Trading It
There are several things that investors can do today to navigate a rapidly changing economic backdrop under a new Administration.
- Monitor consumer confidence: The surge in consumer confidence may turn to disappointment if economic data does not follow suit.
- Focus on fundamentals: A rising stock market driven by speculation rather than strong corporate earnings or economic growth may be vulnerable to corrections.
- Diversify portfolios: During periods of divergence, maintaining a diversified portfolio can help reduce exposure to market volatility and protect against downside risk.
- Prepare for corrections: History shows that markets often realign with economic fundamentals. Being prepared for a potential market correction can prevent significant losses.
However, this does not mean a “correction” or “recession” is imminent. It suggests that investors must continue to monitor and manage portfolio risk to participate in a bullish market. Therefore, if the “confidence dichotomy” eventually impacts the market, investors should consider following some risk management protocols to help shield portfolios from unexpected volatility increases.
If you are long equities in the current market, rebalancing risk is manageable.
- Tighten up stop-loss levels to current support levels for each position.
- Hedge portfolios against major market declines.
- Take profits in positions that have been big winners
- Sell laggards and losers
- Raise cash and rebalance portfolios to target weightings.
Remember, our job as investors is pretty simple – protect our investment capital from short-term destruction so we can play the long-term investment game. Accordingly, our thoughts on this are.
- Capital preservation is always the primary objective. If you lose your capital, you are out of the game.
- Seek a rate of return sufficient to keep pace with the inflation rate. Don’t focus on beating the market.
- Keep expectations based on realistic objectives. (The market does not compound at 8%, 6% or 4%)
- Higher rates of return require an exponential increase in the underlying risk profile. This tends to never work out well.
- You can replace lost capital – but you can’t replace lost time. Time is a precious commodity that you cannot afford to waste.
- Portfolios are time-frame specific. If you have a 5-year retirement horizon but build a portfolio with a 20-year time horizon (taking on more risk), the results will likely be disastrous.
Feel free to reach out if you want to navigate these uncertain waters with expert guidance. Our team specializes in helping clients make informed decisions in today’s volatile markets.

Have a great week.
Research Report

Subscribe To “Before The Bell” For Daily Trading Updates
We have set up a separate channel JUST for our short daily market updates. Please subscribe to THIS CHANNEL to receive daily notifications before the market opens.
Click Here And Then Click The SUBSCRIBE Button
Subscribe To Our YouTube Channel To Get Notified Of All Our Videos
Bull Bear Report Market Statistics & Screens

SimpleVisor Top & Bottom Performers By Sector

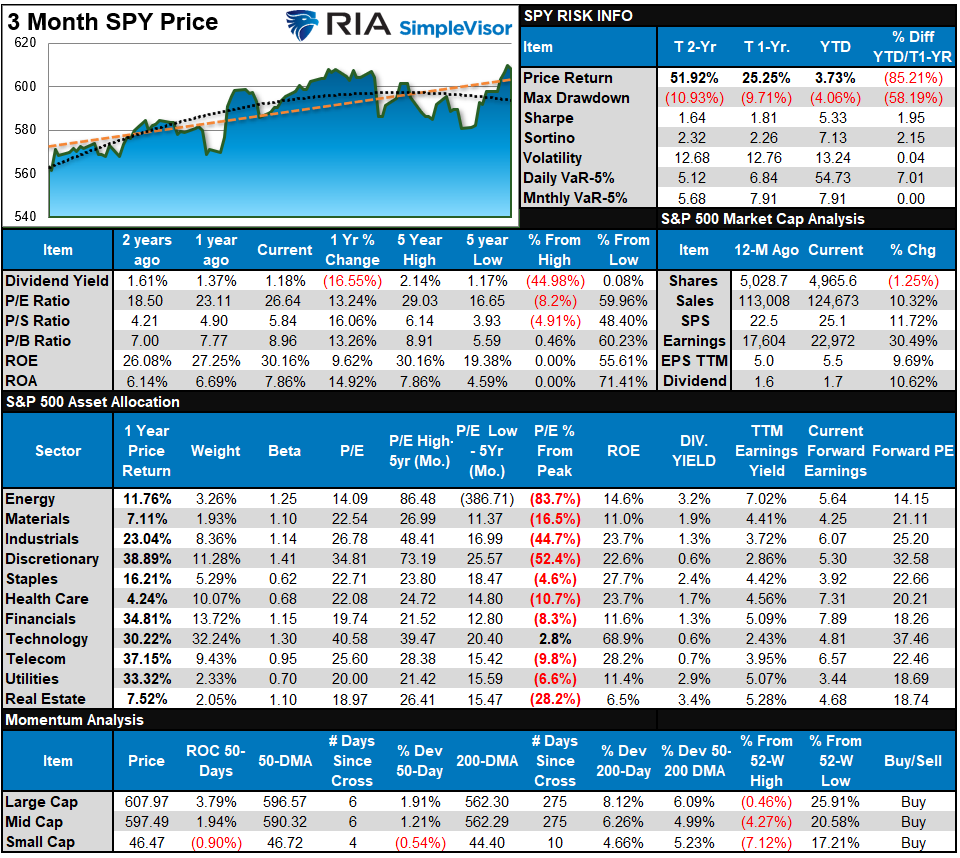
S&P 500 Weekly Tear Sheet
Relative Performance Analysis
In last week’s newsletter, we noted that the market was primed for a furious rally. That occurred this past week, with markets printing a new all-time high following the inauguration. However, that move has pushed most markets and sectors back to overbought territory and could limit the upside soon. That said, we remain amid earnings season, which has been good so far, and buybacks are resuming. Both could support higher prices over the next month, so investors should not be overly bearish on the markets now. Continue to manage risk accordingly.

Technical Composite
The technical overbought/sold gauge comprises several price indicators (R.S.I., Williams %R, etc.), measured using “weekly” closing price data. Readings above “80” are considered overbought, and below “20” are oversold. The market peaks when those readings are 80 or above, suggesting prudent profit-taking and risk management. The best buying opportunities exist when those readings are 20 or below.
The current reading is 80.60 out of a possible 100.

Portfolio Positioning “Fear / Greed” Gauge
The “Fear/Greed” gauge is how individual and professional investors are “positioning” themselves in the market based on their equity exposure. From a contrarian position, the higher the allocation to equities, the more likely the market is closer to a correction than not. The gauge uses weekly closing data.
NOTE: The Fear/Greed Index measures risk from 0 to 100. It is a rarity that it reaches levels above 90. The current reading is 76.63 out of a possible 100.

Relative Sector Analysis

Most Oversold Sector Analysis

Sector Model Analysis & Risk Ranges
How To Read This Table
- The table compares the relative performance of each sector and market to the S&P 500 index.
- “MA XVER” (Moving Average Crossover) is determined by the short-term weekly moving average crossing positively or negatively with the long-term weekly moving average.
- The risk range is a function of the month-end closing price and the “beta” of the sector or market. (Ranges reset on the 1st of each month)
- The table shows the price deviation above and below the weekly moving averages.
Last week, we noted that:
“This week, we did indeed see a rather furious rush back into equities, which has now pushed several sectors (noted in red) above their normal risk ranges for the month. Notably, the sharp drop in rates this past week led to a sharp rise in rate-sensitive sectors such as Utilities and Real Estate. This technical bounce is likely just that. Take profits and rebalance risk as needed."
That furious rush into equities continued this week following the inauguration, pushing many sectors and markets (noted in red) above their normal monthly risk ranges. Notably, the bullish trend remains intact with the break out to new highs. Continue holding equity exposures as current levels, but rebalance sectors and markets that are grossly deviated from long-term means.

Weekly SimpleVisor Stock Screens
We provide three stock screens each week from SimpleVisor.
This week, we are searching for the Top 20:
- Relative Strength Stocks
- Momentum Stocks
- Fundamental & Technical Strength W/ Dividends
(Click Images To Enlarge)
RSI Screen

Momentum Screen

Technically Strong With Buy Rating

SimpleVisor Portfolio Changes
We post all of our portfolio changes as they occur at SimpleVisor:
No Trades This Week
Lance Roberts, C.I.O., RIA Advisors
The post Inauguration Sends Confidence Surging Higher appeared first on RIA.
Full story here Are you the author? Previous post See more for Next postTags: Featured,newsletter


