The days of slowing and falling money supply growth rates are over.
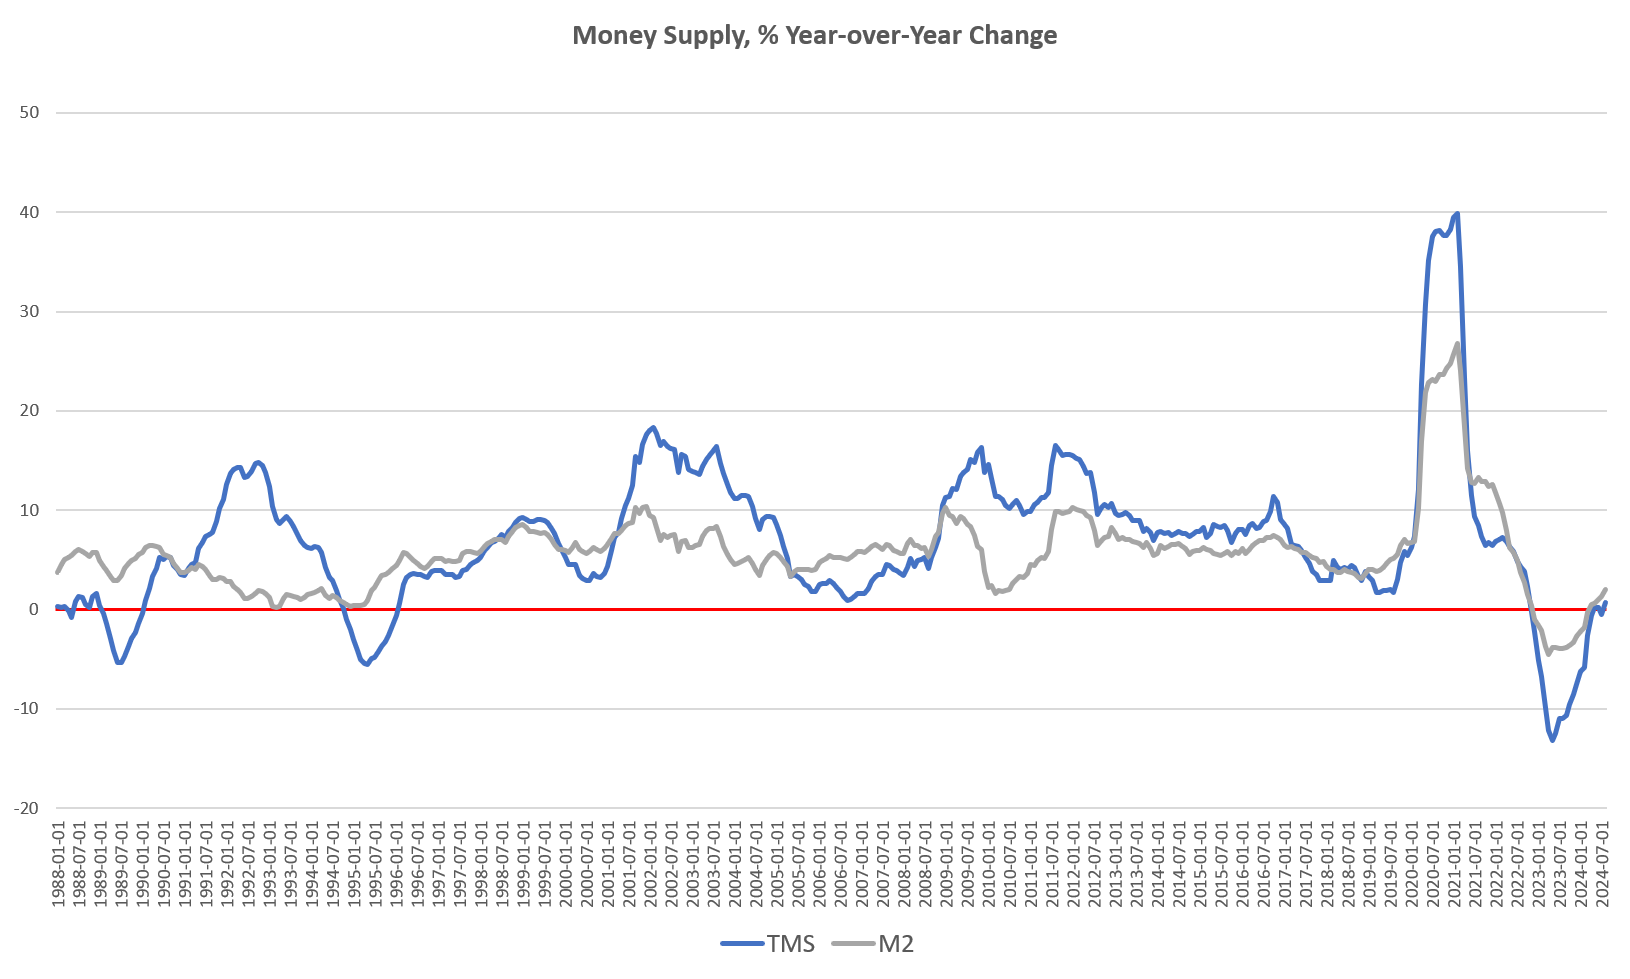
Money-supply growth accelerated, year over year, in August by the largest amount in 23 months, and August was the third month in four months that the money supply has grown, year over year.
The current trend in money-supply growth suggests a significant turnaround from more than a year of historically large contractions in the money supply that occurred throughout much of 2023 and 2024. Since April 2023, year-over-year growth in the money supply has slowly inched upward, and the money supply appears to be, for now, in a period of stabilization overall.
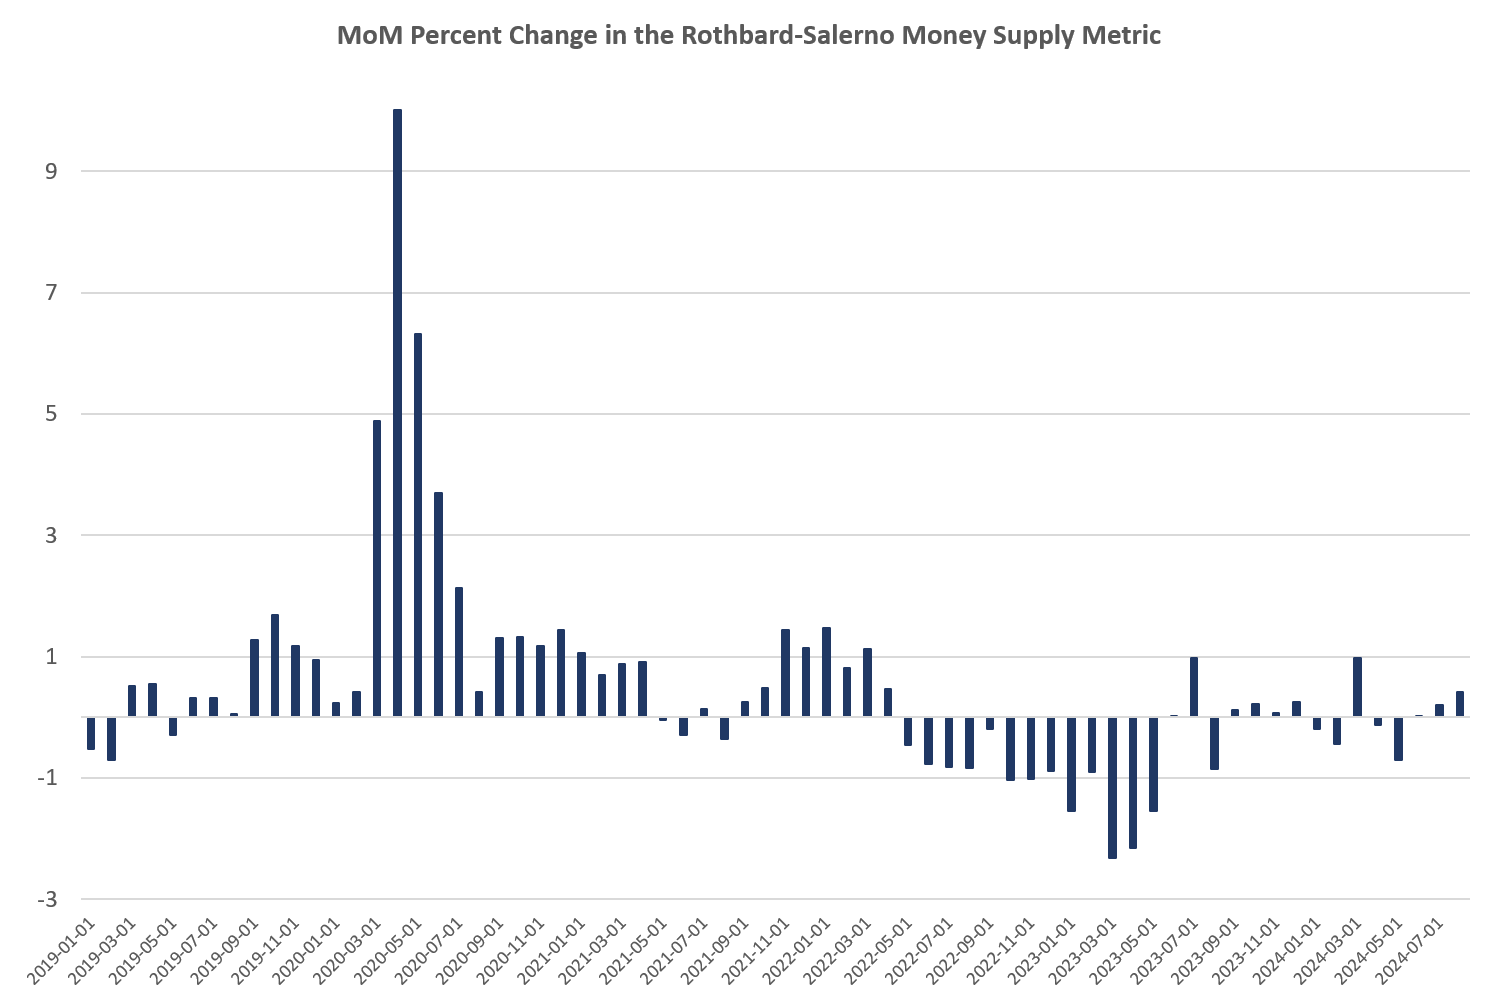
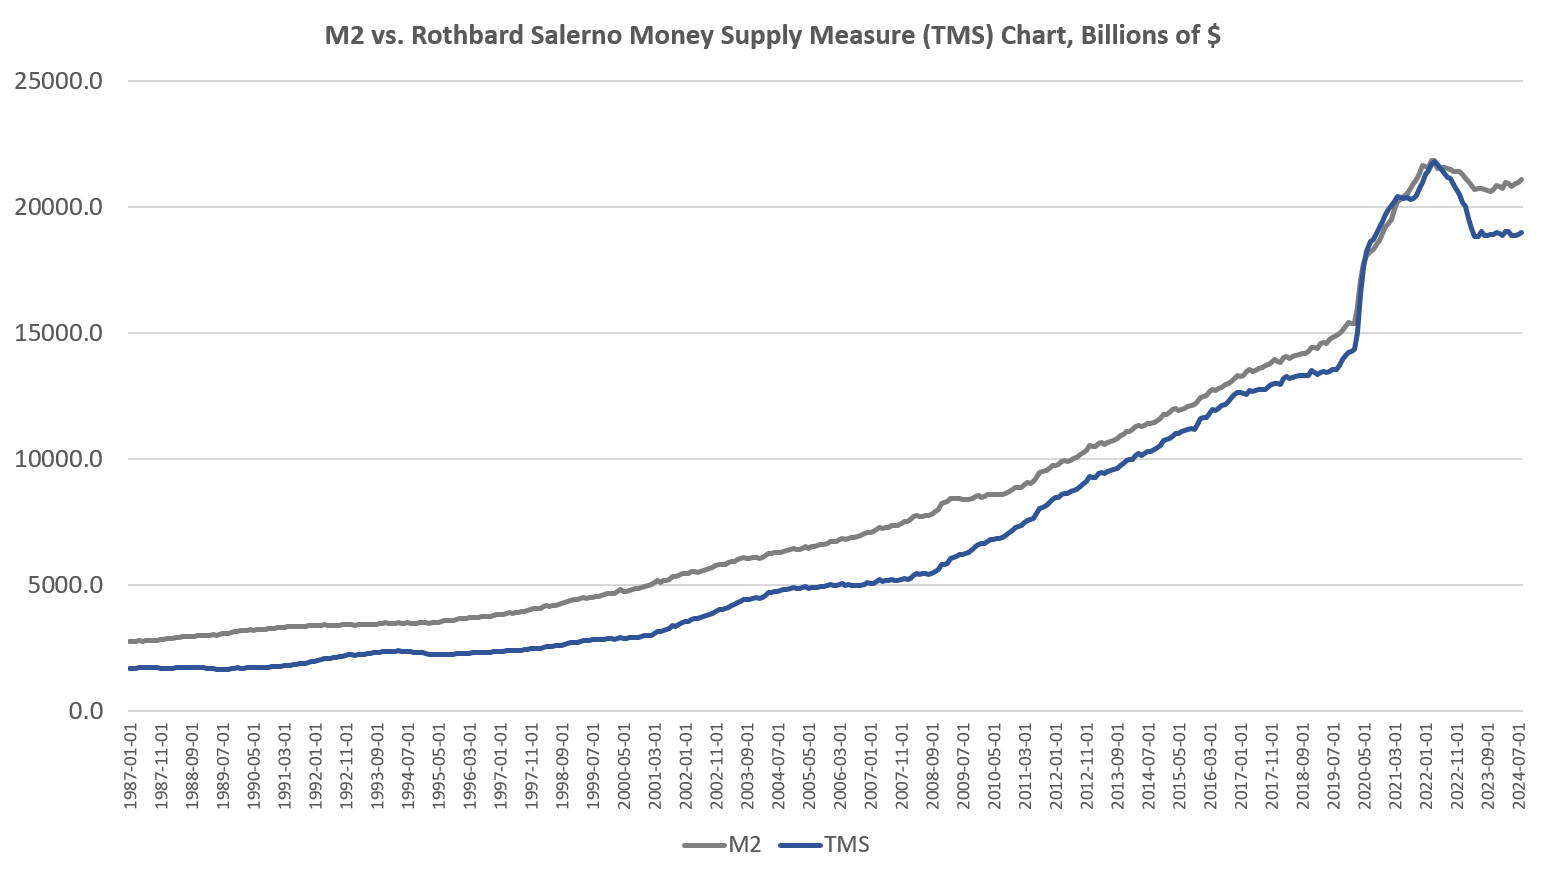
Looking to month-to-month growth, the money supply has been largely flat for 17 months, coming in between $18.8 trillion and $19 trillion with only small variations, month after month.
The positive money-supply growth of recent months ends an eighteen-month period, from late 2022 to mid 2024, during which the money supply repeatedly contracted, year over year. In August, YOY growth in the money supply was at 0.75 percent—the highest since October 2022. August’s growth rate is up from July’s decline of 0.5 percent, and was a sizable reversal from August 2023’s YOY decline of 10.9 percent.

Moreover, the month-to-month change from July to August was positive by 0.4 percent, which was up from the previous month’s change of 0.2 percent. In month-to-month measures, money supply growth has been positive during eight of the last twelve months, further suggesting that the new trend in money supply is either flat or returning to sustained upward growth.

The money supply metric used here—the “true,” or Rothbard-Salerno, money supply measure (TMS)—is the metric developed by Murray Rothbard and Joseph Salerno, and is designed to provide a better measure of money supply fluctuations than M2. (The Mises Institute now offers regular updates on this metric and its growth.)
In recent months, M2 growth rates have followed a similar course to TMS growth rates, although TMS slowed faster than M2 throughout 2022 and 2023. M2 has also rebounded faster than TMS. In August, the M2 year-over-year growth rate was 2.0 percent. That’s up from July’s growth rate of 1.3 percent. August’s growth rate was also up from August’s 2023’s rate of -3.9 percent. Moreover, M2 also shows more month-to-month growth than TMS, with M2 increasing by 0.56 percent from July to August this year.
Money supply growth can often be a helpful measure of economic activity and an indicator of coming recessions. During periods of economic boom, money supply tends to grow quickly as commercial banks make more loans. On the other hand, two or three years before a recession begins, we tend to see periods during which money supply growth slows or turns negative.
It should be noted that the money supply does not need to actually contract to signal a recession. As shown by Ludwig von Mises, recessions are often preceded by a mere slowing in money supply growth. But the drop into negative territory we’ve seen in recent months does help illustrate just how far and how rapidly money supply growth has fallen. That is generally a red flag for economic growth and employment.
All that said, recessions tend not to become apparent until after the money supply has begun to accelerate again after a period of slowing. This was the case in the early 1990’s recession, the Dot-com Bust of 2001, and the Great Recession. This may be the trend we are seeing now.
We are now in a period of accelerating money supply growth following a trough, and if trends follow previous cycles, this is more evidence that a recession is not far off.
It is also important to note that, in spite of last year’s sizable drops in total money supply, the trend in money-supply remains well above what existed during the twenty-year period from 1989 to 2009. To return to this trend, the money supply would have to drop another $3 trillion or so—or 15 percent—down to a total below $15 trillion. Moreover, as of August, total money supply was still up more than 30 percent (or about $4.6 trillion) since January 2020.

Since 2009, the TMS money supply is now up by more than 185 percent. (M2 has grown by 145 percent in that period.) Out of the current money supply of $19 trillion, $4.6 trillion—or 24 percent—of that has been created since January 2020. Since 2009, more than $12 trillion of the current money supply has been created. In other words, nearly two-thirds of the total existing money supply have been created just in the past thirteen years.
With these kinds of totals, a ten-percent drop in the money supply only puts a small dent in the huge edifice of newly created money.
This should not surprise us since the Fed can always be expected to intervene to prevent any declines in overall money supply over anything more than the short term.
For example, after months of insisting the price inflation was “transitory” in 2022, the Fed finally admitted that price inflation levels had become politically problematic and began interventions to rein in price-inflation growth. This is when we begin to see those month-to-month declines in the money supply during the second half of 2022. The only reason the Fed did this was because middle- and lower-income voters don’t like noticeably and rapidly rising prices. That is, the Fed’s hand was forced by political realities.
By late 2023, however, the Fed pivoted to preventing any more declines in the money supply, and ever since then, we have seen money-supply growth temporarily hover around zero percent on average.
This is not the behavior of a “hawkish” Fed. This is the behavior of a wait-and-see Fed which is hoping it can make current price inflation politically palatable without triggering sizable disruptions to labor markets. It is an election year, after all.
Thus, the Fed held the federal funds rate at 5.5 percent for fourteen months, hoping the economy would somehow reset and begin a new boom period. That didn’t happen as proven by the fact the Fed felt it had to cut the target rate in September of this year. Naturally, the Fed did not frame the rate cut in this way, The Fed said it was merely cutting rates to ensure continued solid employment data into the future.
Of course, this is exactly what the Fed would say. The Fed never admits the economy is in trouble until after a recession has already started. After all, in 2008 the Fed Chairman—Bernanke at the time—was still claiming there was no recession on the horizon months after the Great Recession had already begun.
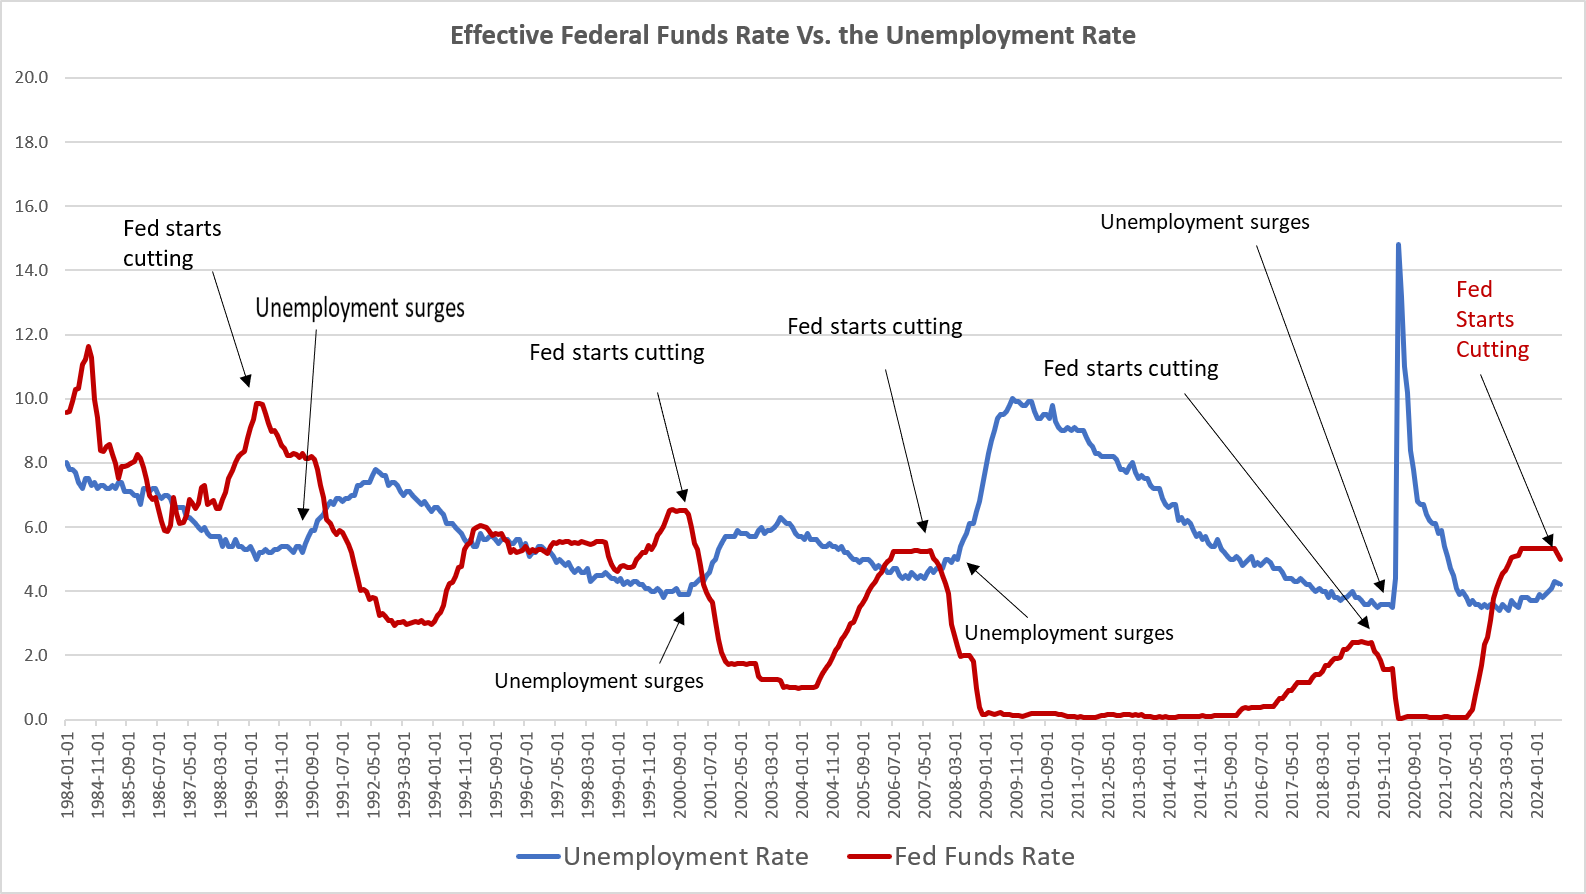
In practice, when the Fed begins a new cycle of rate cuts after a period of holding rates steady, a recession is virtually guaranteed. The Fed cuts rates when it sees recessions approaching.
We can see this this phenomenon play out if we observe the target federal funds rate along side employment trends. Rate cuts are harbingers of job losses. The Fed cuts rates in hopes that more easy money will lessen the pain in the short run.

Going forward, we should expect to see the money supply head back up. Without active Fed intervention in favor of easy money, of course, the opposite would happen. The money supply would fall as loan defaults caused fiat money to disappear. That would lead to falling prices, which would benefit many people, such as first-time homebuyers. But, the Fed is allergic to falling prices, so can expect the Fed to intervene repeatedly as economic news becomes worse. The money supply will then quickly grow once again.
Here is a shortened and simplified video version of the article:
Full story here Are you the author? Previous post See more for Next postMoney-supply growth accelerated, year over year, in August by the largest amount in 23 months. The Fed now fears a recession, so expect more money growth going forward as the Fed tries to blow new bubbles. For graphs and more, see: https://t.co/en43NuOcGj pic.twitter.com/MNQHjVn5wr
— Ryan McMaken (@ryanmcmaken) October 19, 2024
Tags: Featured,newsletter


