| “Crypto’s Crash,” says some financial news headlines. The reality is Bitcoin, Ethereum and others are down about 10-15% in the last few days. The word “crash” may seem appropriate to describe the sharp decline, except 10%+ moves in a matter of days is the norm, not the exception for crypto.
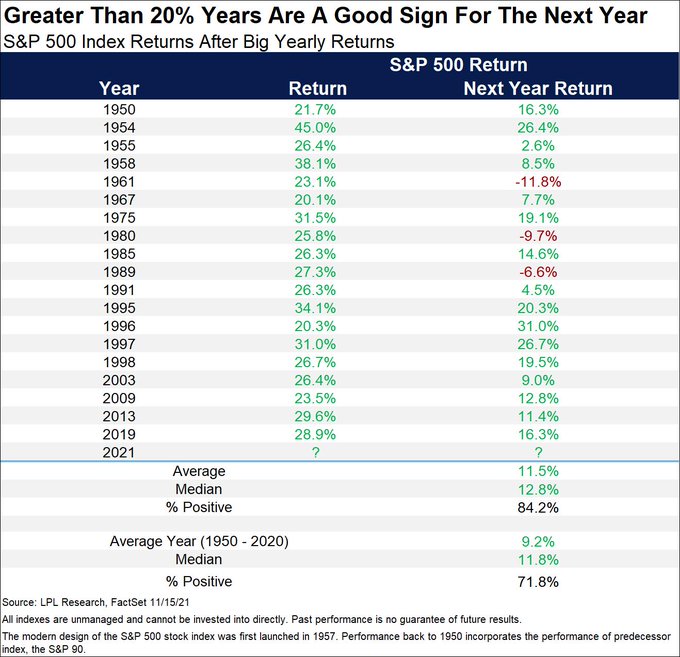
Ignoring the crypto crash, the S&P 500 went higher. The index is up over 25% this year. Despite such an outsized gain, the table below from LPL Research argues we should be optimistic for 2022. Of course, it’s worth noting some of these outsized returns were coming off of major bear market lows such as 1975, 2003, and 2009. What To Watch TodayEconomy
Earnings Pre-market
Post-market
|
|
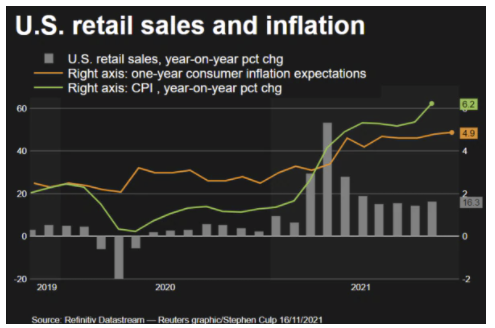
Stronger Than Expected Retail SalesDespite weakening confidence, consumers spent a lot of money last month. Retail Sales rose 1.7%, up from 0.7% last month and well above the 1.0% consensus. While the number was great, there are a couple of factors that may be overstating it. Retail Sales are nominal, meaning it doesn’t capture inflation. As such, consumers may be buying a similar number of goods but paying more for them. Second, we believe many people are ordering Christmas gifts early due to concerns about supply lines and shortages. If this is the case, sales for November and especially December may end up being weaker than expectations. One last point, Hanukah starts on the Sunday after Thanksgiving this year, which is also driving earlier than normal demand. |
|
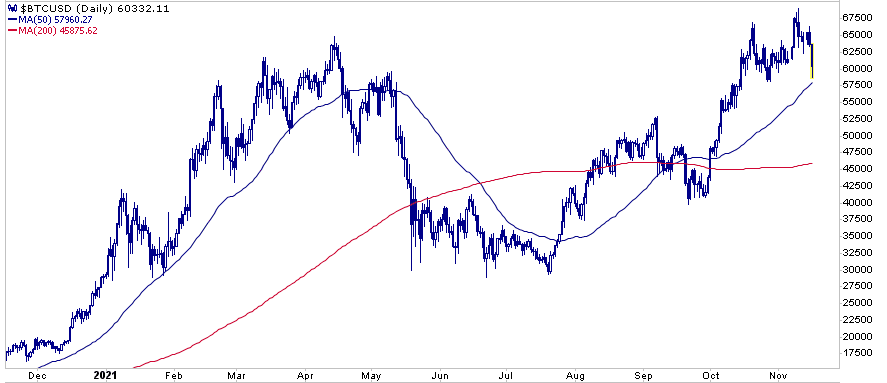
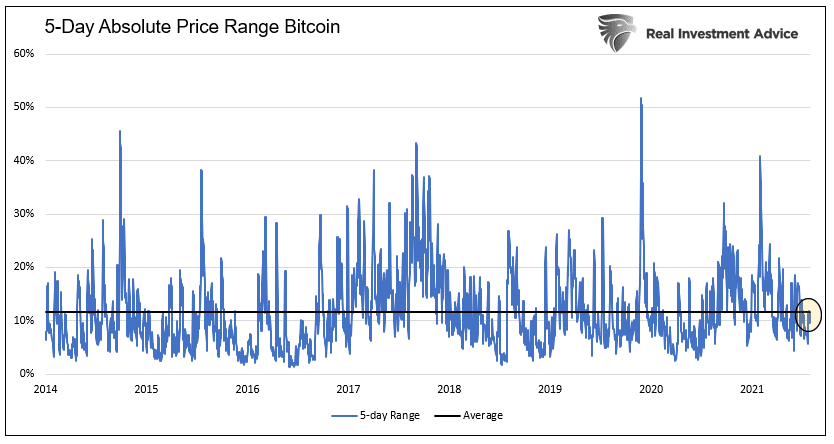
Bitcoin Correction or Just an Average Move?As the first graph shows Bitcoin is down about 11% over the last few days. While a double-digit percentage move is quite often significant for most assets, it is fairly commonplace for Bitcoin. In fact, the five-day average price range using the high and the low for each five-day period since 2014, is 11.65%. The second graph circles the recent five-day range, highlighting just how average it is. |
|
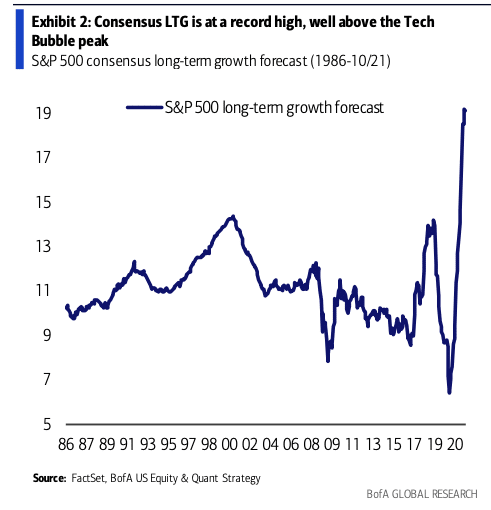
Lofty Earnings Expectations“The attractive P/E to LTG ratio, or ‘PEG ratio’, of the S&P 500 is due to lofty growth expectations, not low valuations… LTG rates are better contrary than positive indicators… today’s level would suggest losses of -20% over the next 12 months” – BofA Bottom line- implied long-term earnings growth of nearly 20% is well above any level witnessed since 1986, including 1999. It’s also more than double any actual growth rate over the period. Now consider, profit margins will be under pressure due to rising prices and wages, the Fed is removing accommodations, and economic growth will normalize. Given these headwinds, the implied growth forecast seems like pie in the sky. An adjustment of growth expectations is likely to make investing much more difficult in 2022 than this year. |
|
Diversification Ain’t What it Used to BeThe graph below, courtesy of Jim Bianco, shows the diversification benefits of a passive portfolio are rapidly fading as the five largest stocks now garner nearly 25% of the contribution to the S&P 500. While many investors may think they are diversified because they indirectly own 500+ stocks, such is not mathematically accurate. Yes, they own a piece of 500+ stocks, but the returns are heavily based on five stocks. |
Tags: Featured,newsletter


