All debt-fueled speculative bubbles pop, even as cheerleaders claim otherwise.
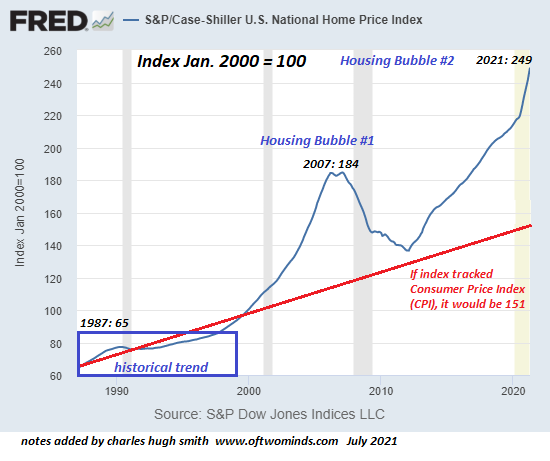
| The expansion of Housing Bubble #2 is clearly visible in these two charts of house valuations, courtesy of the St. Louis Federal Reserve database (FRED). The first is the Case-Shiller Index, which as you recall tracks the price of homes on an “apples to apples” basis, i.e. it tracks price movements for the same house over time. Note that this is an index chart where the index is set at 100 as of January 2000. It is not a chart of median housing prices.
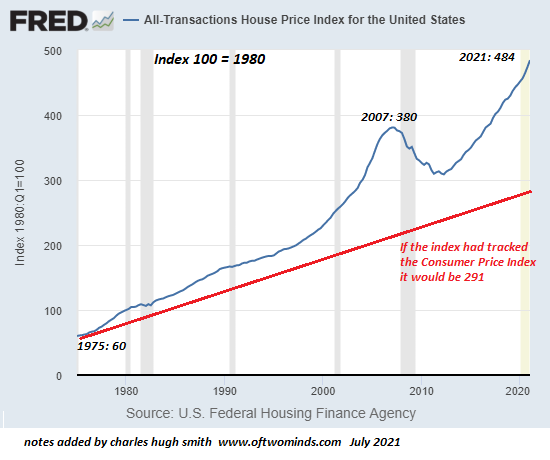
The second chart is also a housing price index chart courtesy of the U.S. Federal Housing Finance Agency. (Shoutout to the USFHFA, never came across your work before.) The red line marks where house prices would be if they had tracked the Consumer Price Index (CPI), i.e. inflation as measured by the Bureau of Labor Statistics. You’ll notice that the last time the Case-Shiller Index touched this baseline was 1998, almost a quarter-century ago. On the FHFA index, it hasn’t touched it since the mid-1970s, 45 years ago. You’ll notice that housing would have to drop by 40% to touch the baseline. Yes, this is officially “impossible,” because the Fed has our back in every bubble and housing never goes down because the demand is forever rising. |
U.S. S&P/Case-Shiller, 1990 - 2020 |
| Nice, but when you turn an asset class into a casino of speculators and financiers playing with Fed-spewed “free money,” you’re not dealing with shelter, you’re dealing with gambling chips. You’ll notice that the Federal Reserve’s massive manipulation–oops, sorry, intervention— in response to the Asian-Contagion of 1997-1998 began inflating an unprecedented bubble in housing that rose to spectacular heights on the back of Fed policies (lowering interest rates, etc.) and institutionalized fraud on a global scale in the casino’s subprime mortgage table.
You may recall that $300 billion of designed-to-default subprime mortgage pools almost took down America’s entire financial system and with that teetering, the entire global financial system ($100 trillion at the time). I’ve often pointed out the remarkable symmetry of speculative bubbles popping. Housing Bubble #1 took about four years to reach absurd valuations and about four years to plummet towards the baseline–a decline that the Federal Reserve stopped by effectively socializing the mortgage market and manipulating mortgage rates into a steady slide lower. |
U.S. House price Index, 1980 - 2020 |
| This manipulation has inflated Housing Bubble #2 as mortgage rates fell beneath the rate of inflation (as measured by any quasi-realistic metric). In other words, lenders are losing money on every mortgage, every month, as their yield is less than zero once adjusted for inflation.
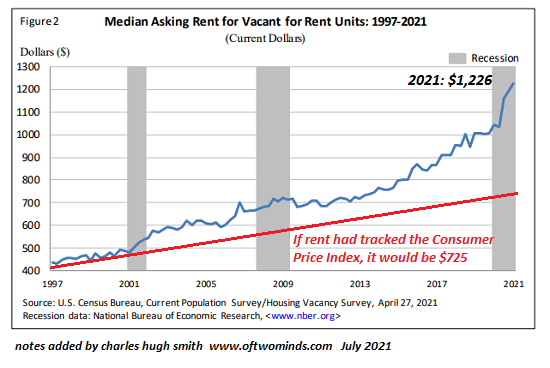
The idea that issuing mortgages that lose money is perfectly sound and sustainable is, well, financial madness. It may be fun to originate mortgages that lose money from Day One and sell them to a Norwegian pension fund or other bagholder, but over time people will catch on that losing money is not a winning strategy in the long term. Housing Bubble #2 has naturally blown a bubble in rents, as the third chart shows. If I just paid 100% more for a rental than it was worth a few years ago, of course the rent should double, too, to cover my higher costs. To touch the baseline, rents would also have to drop 40%. yes, I know, that’s “impossible” because the Fed has our back, population is growing, and so on. |
Median Asking Rent for Vacant for Rent Units, 1997 - 2021 |
Fear of Missing Out (FOMO) is a reliable feature of every debt-funded speculative bubble and Housing Bubble #2 has a palpable FOMO frenzy feel.
But housing has an interesting feature: if the number of people occupying a dwelling increases, the population can grow by millions without needing even one additional house. Interestingly, The number of people in the average U.S. household is going up for the first time in over 160 years (Pew Research). There are 331 million U.S. residents and about 126 million occupied dwellings, so that’s about 2.6 people per housing unit.
A consequential number of the 82.5 million owner-occupied homes in America are currently occupied by one or two people. If the number of people living in those homes rose, the demand for additional housing would slacken considerably.
There are a consequential number of unoccupied homes in the U.S. as detailed on Page 4 of Residential Vacancies and Homeownership, Q1 2021 (Census.gov) Many of these may be in places few people want to live, others may be abandoned and in need of renovation, but nonetheless it seems there are at least 5 million unoccupied dwellings in the U.S. that are “held off the market” for various reasons (3.8 million units) or only in “occasional use” (2 million dwellings that are not vacation “seasonal” homes or short-term rentals, as those are separate categories).
New York City has 3.5 million housing units and Los Angeles has 1.5 million housing units, so 5 million unoccupied dwellings is a large number. With more work being done remotely, and the price of housing at absurd levels in many urban areas, it’s not difficult to imagine an increase in the number of residents per dwelling and a slow migration to housing sitting empty.
I built a micro-house back in 1978, and the trend is accelerating. A great many young people cannot afford a McMansion and will never be able to afford one, and many have no interest in debt-serfdom. Micro-houses in low-cost rural areas are a solution that adds housing units but not in the conventional high-cost manner.
All debt-fueled speculative bubbles pop, even as cheerleaders claim otherwise. There are a great many people with vested interests in Housing Bubble #2 expanding forever, but history suggests a return to the baseline is more likely than a speculative bubble expanding forever. Demand is contingent, mortgage rates are contingent, demographic flows are contingent, the number of occupants per dwelling is contingent, and the rise of cheap alternatives to conventional housing is an under-appreciated trend.
And that’s how “impossible” reverses to “inevitable.”
Full story here Are you the author? Previous post See more for Next postTags: Featured,newsletter


