If you were waiting for a correction in stock prices to put some money to work, you got your chance last week. The Dow Jones Industrial Average was down nearly 1000 points at the low Monday and closed down 725, a loss of a little over 2%. The S&P 500 did a little better but closed down 1.5%. It looked like the beginning of a beautiful correction, one for which we were way overdue. The reason everyone gave for the selloff was fear of the Delta variant, of which new cases and hospitalizations have been rising rapidly, especially in places where vaccine take up has been weak. If that was indeed the case, the surge was apparently vanquished by Tuesday morning or at least fear of it. Stocks took off Tuesday on the news that building permits fell 5.1% in June and never looked back.
The market surged more Wednesday as mortgage applications were reported to have fallen by 4% the previous week. The surge continued on Thursday as the Chicago Fed National Activity index fell to 0.09 and jobless claims surged to 419,000. The market ended the week on a high note as the Markit Services Flash index printed 5 points below the consensus expectation.
So, you got your chance to buy the dip but it lasted a little over one trading session. Basically, you had to be buying the low Monday afternoon to get much if any benefit from the drawdown. The reason that is true has nothing at all to do with the economic stats I randomly chose for the above paragraph. It also had nothing to do with the Delta variant (I’m still not sure whether to capitalize that). The cause of the short dip could have been anything. There is no way to determine what exactly millions of traders were thinking at the time they were pushing the sell button on Monday. Mostly because it is rarely one thing that convinces someone they are taking maybe a bit more risk than they ought. It is an accumulation of information from disparate sources, some of them not even market or economic related. Or it’s just plain fear of loss, selling because others are selling. The cause of the rally is a bit easier to determine though. To use a cliche, there were more buyers than sellers. By a lot. Well, to be more exact the buyers felt more urgency to buy than the sellers did to sell. By a lot. It seems that now, in 2021, investors have finally forgotten what 2008 felt like. Or they’re young enough that the only thing they remember clearly from that year is Ironman. Or Spongebob. Now that every dip of the last decade or more has been bought, now that everyone has learned that you can’t wait to buy, it’s everybody in, the water’s fine.
Investors have been throwing money at the markets for the last year, stocks and bonds and houses, oh my. Most of it is going into ETFs rather than mutual funds and a good chunk is going into the wild west of cryptocurrencies. If you put any money into crypto and you don’t get ripped off you aren’t doing it right. But in it is going. There is a huge stash of cash out there and if you can’t buy a car and you can’t get a reservation at any hotel anywhere anyone would want to go and the waiting list for a freaking couch is 9 months, what are you going to do? Let your cash sit in the bank at 0.1%? I think not. Or at least a lot of other people think not. Besides you know you don’t want to go to another Thanksgiving dinner and listen to that idiot cousin of yours who’s making bank in defi. No, it’s time to get in and stake your claim. How do these option things work again?
Let’s be frank. Or someone. Stocks are expensive. Not just a tad overpriced or maybe a little aggressive based on estimates. No, we’re talking historically expensive. As in more expensive than they’ve been since, well, pretty much ever. Maybe not as expensive as some stocks were during the South Sea Bubble or the Mississippi Bubble. But expensive. I won’t bore you with the details because you, our readers, know that’s the truth. But a lot of people have no idea. They don’t know what the forward P/E is for the S&P 500. They don’t know the price to sales ratio. They don’t know the Shiller P/E. How could the fundamentals possibly matter if most people participating in the markets don’t know what they are? And I don’t mean they don’t know the Shiller P/E is 38. I mean they have no idea what a P/E is much less a Shiller P/E.
Is it possible that economic growth and company sales and earnings could grow fast enough to justify today’s high prices? Sure it is and I don’t know anymore about the future than you do. But I can tell you that earnings estimates out to the end of 2022 sure don’t justify today’s prices. It’s earnings season now and I keep hearing about how great they are and it is true that the numbers are a lot higher than last year. At the onset of a pandemic. When the economy was essentially shut down. Yes, estimates are that earnings will be up 72% from the same quarter last year. Compared to last quarter, Q1 2021? Not so much. If earnings come in as expected, they will be down about 3% from last quarter. Q4 21 vs Q4 20 earnings will be up about 30%. Next year? At today’s estimates, about 14%. That does not seem sufficient to justify the current appetite for stocks. Okay, maybe the economy will grow faster than expected and earnings will too and all this will work out. But if that turns out wrong? Well, hell, it’ll probably keep going up anyway since people will be looking to 2023 by then. There’s always next year.
Don’t get me wrong. I’m enjoying the ride and our portfolios, with a healthy allocation to commodities and real estate (both of which have done better than stocks this year by a good margin) have done better than most. It is difficult getting new money in the market but I still find areas, sectors, markets, companies that are reasonably priced. Of course, they aren’t the popular things or they wouldn’t be cheap enough for me to buy but I’ve never been much for fashion anyway. But most people in this market today have no idea what they are buying. And I include a lot of people in my industry who are buying ETFs based on little more than the name. Biotech good. Banks bad. Tech good. Europe bad. Electric cars good. Oil bad. It’s the cave man market. Og build portfolio.
I’ve been doing this for 30 years and I have never seen an appetite for risk like we see today. Actually, looking at fund flows, the appetite is for investing. Stocks and bonds are attracting large amounts of new money but bonds are still leading by a wide margin. If the Fed’s goal was to push people out of the banks and into the market, well, mission accomplished. And there are plenty of people who think that was the goal and it is a good thing for asset prices to rise. Matt Yglesias wrote that very article last week:
Asset Price Inflation Is Not A Thing
I understand his argument and I get his reasoning. Asset prices going up is not a bad thing in and of itself. And I know the mantra from the Fed that you can’t recognize a bubble in real time and the only thing to do is mop up after it bursts. Which I find to be a very convenient argument from an institution almost everyone agrees has more to do with today’s rising asset prices than any other. Is there anyone, other than Jerome Powell, who doesn’t believe that monetary policy influences asset prices? If we agree on that, I have a pretty big problem with Mr. Yglesias’s argument. Because if you believe that monetary policy moves asset prices and you believe that doesn’t matter as long as consumer prices are well behaved, then you also must believe there are no really bad consequences to high asset prices. Of course, the Fed will have to mop up – clean up on aisle 5! – but that’s just a technicality, right? Ahem. Sustained high asset prices is exactly how we end up with financial crises. Minsky? Minsky? Is there a Hyman Minsky in the house?
So I think I’ve covered the fact that large cap US stocks are very pricey. The rest of the US market falls more in the not exactly cheap category but maybe okay if growth comes in as expected.. Midcaps trade for about 19 times next year’s estimates and are expected to grow earnings at 17.5%. That compares to 23 times and 16.7% growth for the S&P 500. Small cap valuations fall somewhere in the middle of those two. House prices are kind of nuts if you ask me but I’m a homeowner so by Yglesias’s reasoning, screw you Millennials I got mine.
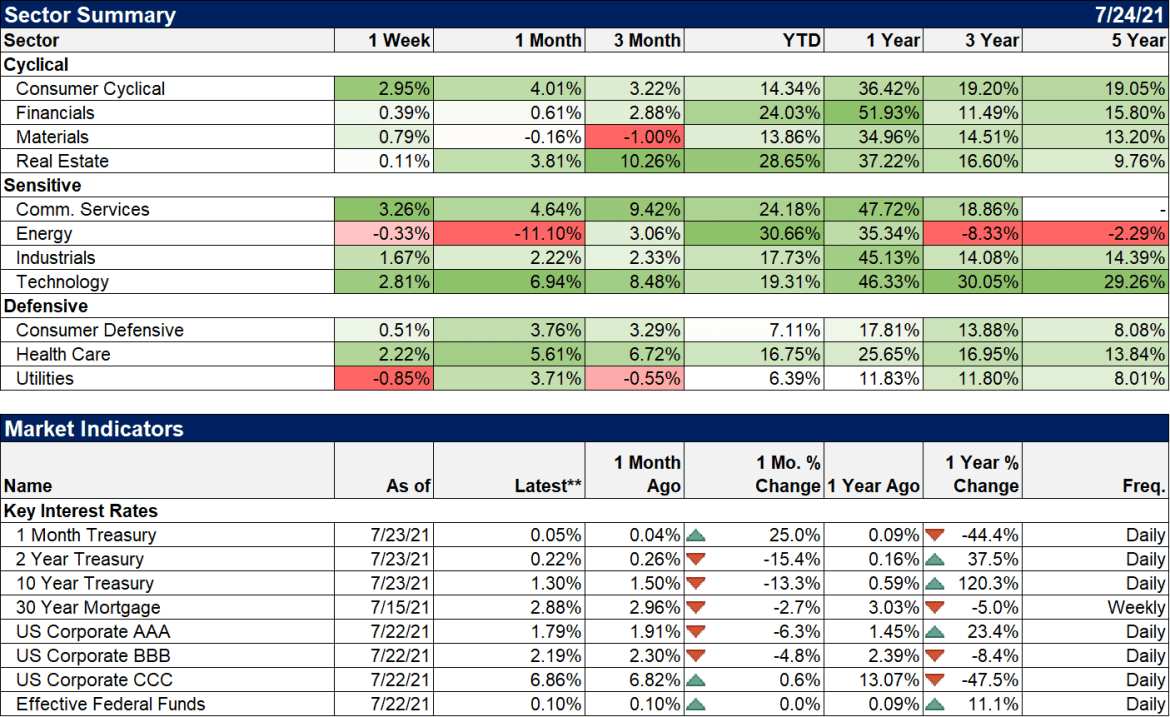
Stocks weren’t the only asset class on a roller coaster. The 10 year Treasury note traded at a low yield of 1.13% and a high just over 1.30%, which doesn’t sound like much but at these levels is pretty significant. But by week’s end the 10 year yield changed by less than 2 basis points from the previous week. TIPS yields fell more, investors wondering if Powell will be as wrong about “transitory” as he has about so much else. So, inflation expectations at the 10 year horizon rose to 2.35% which isn’t exactly heart stopping. The dollar had a big week too, up all of 0.25% and still in the lower end of the range it’s been in for six years. EM stocks had a bad week anyway and I’m so very glad we sold those a few months back. Jeff Snider has been seeing some stress in dollar markets and dollar shortages always hit EM first so maybe a warning there. Commodities were up 2%, concentrated mostly in industrials like copper although natural gas had a huge week, up 10%. Gold was down a bit so the copper/gold ratio rose by 2.5%, a positive economic sign that points to higher rates if it continues.
| Right now, I’d describe the environment as one of growth but back at trend so less than the first two quarters of the year. I suspect the slowing we anticipated, and that has become obvious over the last couple of months, has run its course but I’ll need more evidence to confirm that. As I said, not much has changed and our portfolios haven’t either. We continue to hold more cash than usual and await, yes, a correction, to more reasonable prices before reducing it. And if it goes higher from here, our cash pile seems likely to grow because yes, Matty, Asset Price Inflation is Very Much A Thing.
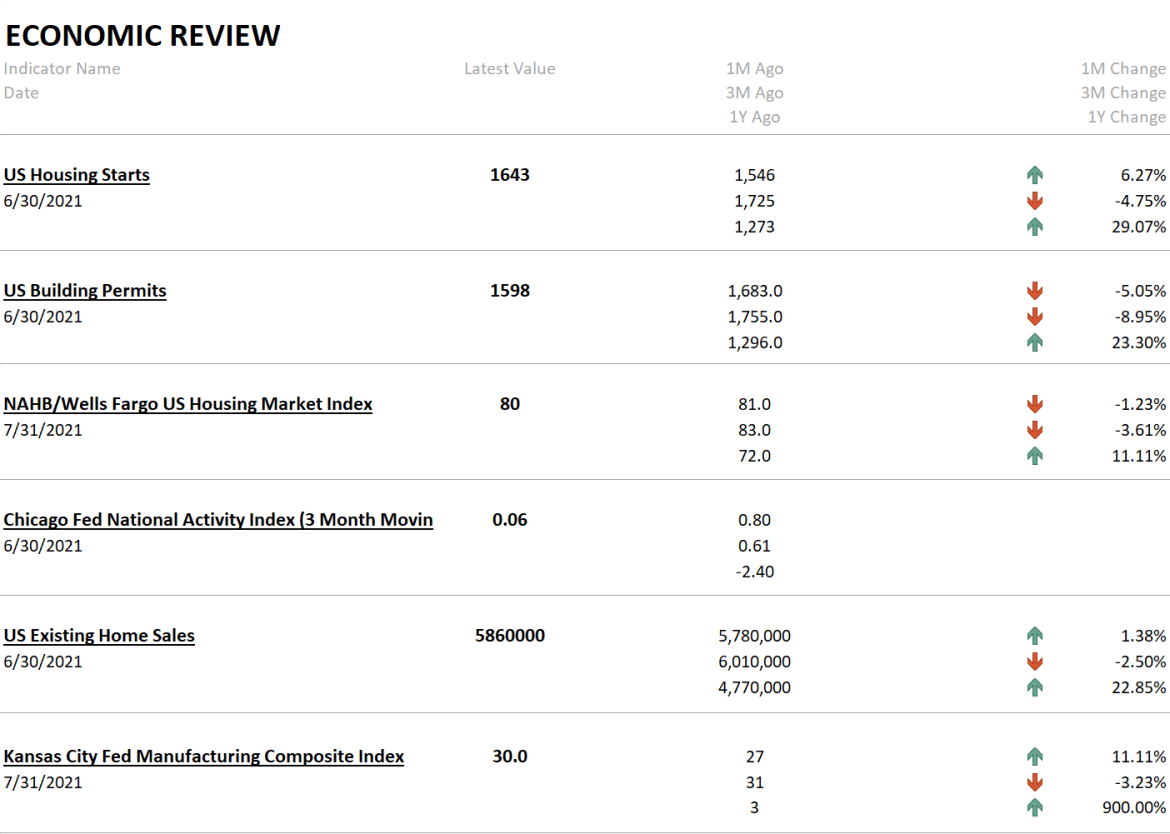
Last week’s data was mostly about housing and the picture couldn’t be more confusing. Housing starts and existing home sales were up but permits were down hard. The KC manufacturing survey stayed strong. The CFNAI, as mentioned above, did fall back to 0.09 while the 3 month moving average fell to 0.06. That is about as close to trend growth as you’re going to get. What is trend? Well, before COVID it was about 2.2%. Now? I don’t know and neither does anyone else because COVID changed and continues to change everything. But officially I don’t think the number has changed. Trend growth isn’t great but after a decade of it, it surely can’t be called calamitous. |
|
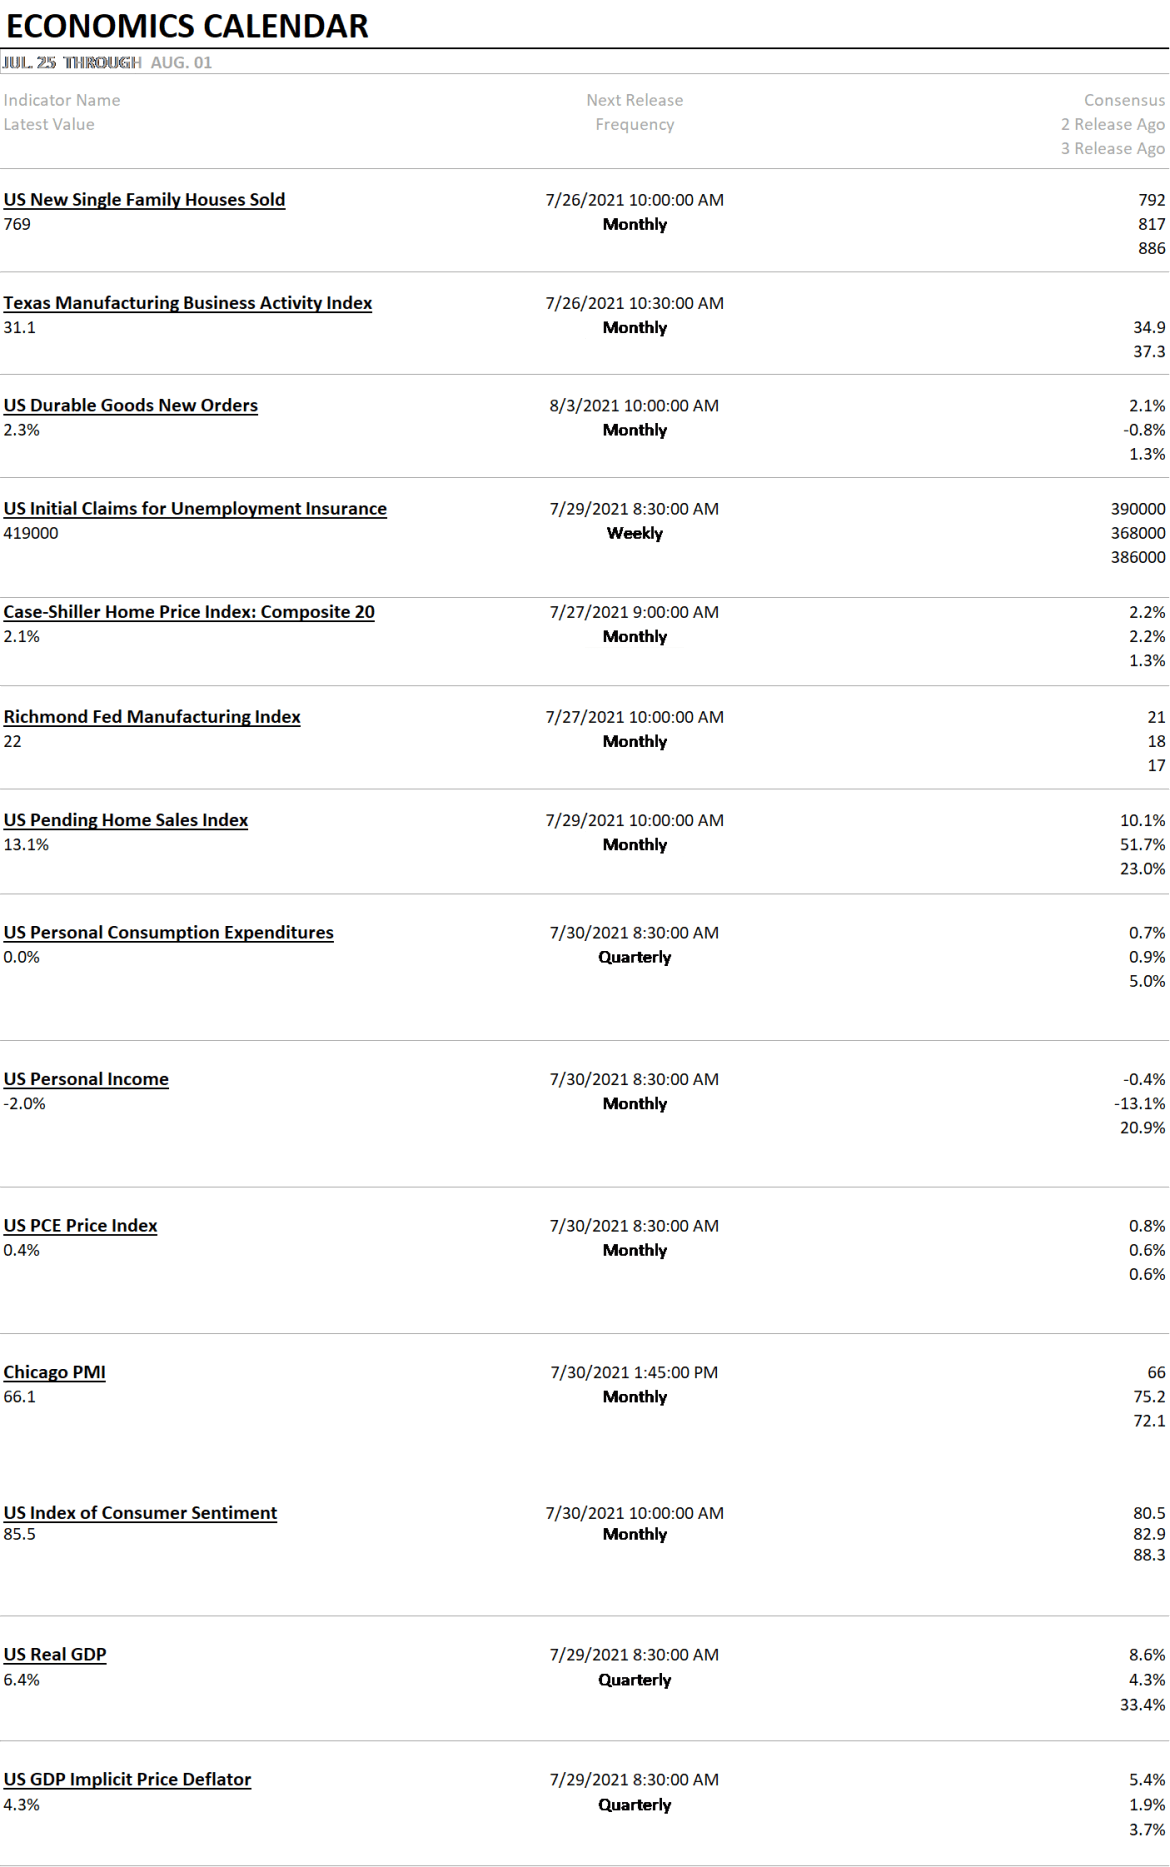
| This week brings a plethora of data from new home sales to durable goods orders to personal income and consumption to Q2 GDP. I don’t expect any big upside surprises in any of those. | |
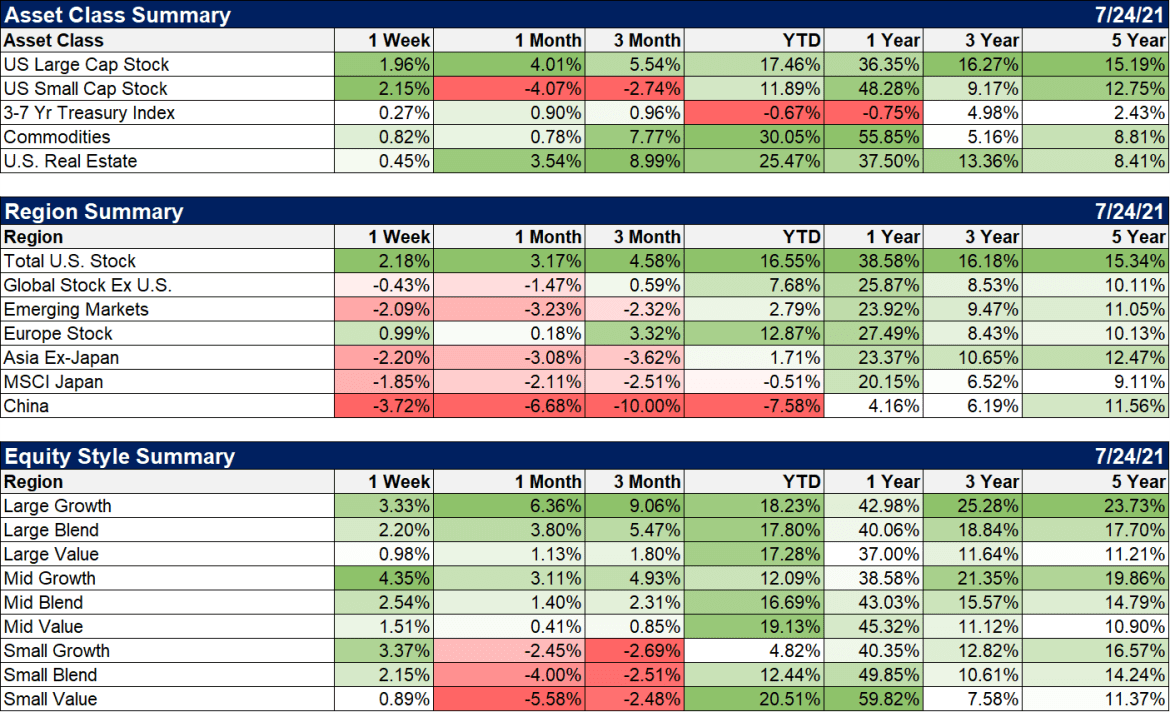
| Remember how value was leading growth and that was going to be the new trend? Good times, eh? Actually it is only large cap where growth has retaken the lead for YTD. Mid and small cap value continues to outperform. Watch the dollar for a clue about whether that is sustainable. A lower dollar probably spurs value again while a stronger buck puts a tailwind to growth. Because of the sectors involved in each that is basically re-opening (value) vs oh crap, delta is kicking our behind (growth). International markets were mostly down last week with the exception of Europe. China’s self inflicted wounds in their tech sector had their markets leading the downside charge. I’ll have more about China and what that might mean soon. | |
| Financials, real estate and energy continue to lead the way YTD but over the last 1 and 3 month periods, real estate is the obvious winner. Health care had a good week but I think we’re going to need to see some positive news on earnings to justify more gains.
US stocks are expensive and the degree of speculation in the US and globally is at an extreme. That doesn’t mean the market is about to crash. It doesn’t necessarily portend anything. But what it does mean is that risk is high right now and even a small shock could have a big impact on asset prices. Valuation fundamentals are not a timing tool but they are a good way to look at risk. The current price to sales ratio of the S&P 500 is over 3, an all time high. The long term average is around 1.5. I think anyone can do the math on that one. |
Full story here Are you the author? Previous post See more for Next post
Tags: Alhambra Portfolios,Alhambra Research,Bonds,cfnai,commodities,currencies,earnings,economic growth,economy,Featured,Federal Reserve/Monetary Policy,Jerome Powell,jobless claims,Markets,newsletter,Real Estate,stock market,stocks,valuations


