| Anyone who follows Alhambra knows that we keep an eye on the dollar. It is a very important part of our process of identifying the economic environment. A rising dollar, when combined with a falling rate of growth, can be a lethal combination. That was the situation in March and of course during the financial crisis of 2008. So the recent rally is something that has got our attention. For now, though, we don’t see any significant stresses in the system that would produce that kind of liquidity driven event.
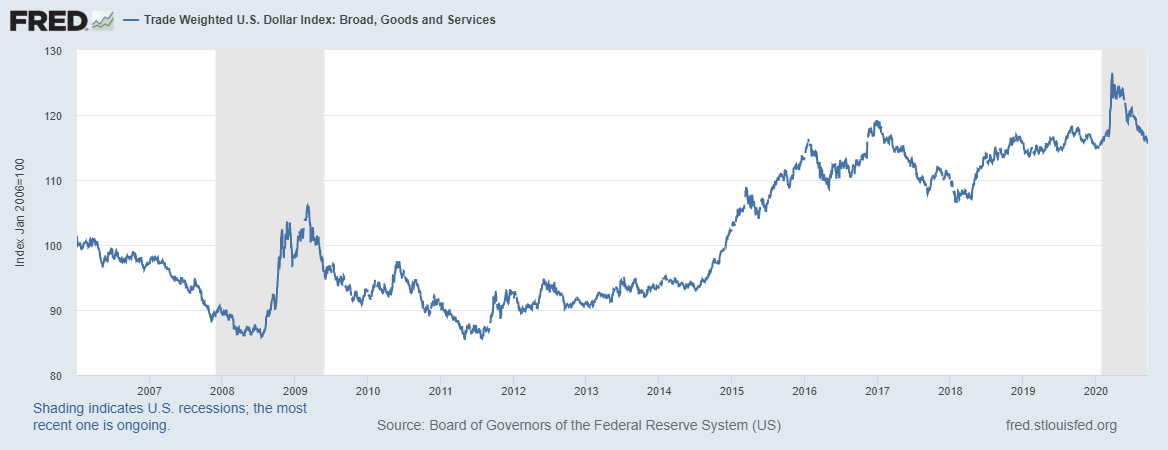
The dollar has been in a short term downtrend since the spike and peak in the heart of the COVID panic back in March. The vast majority of that decline was compressed in a roughly 2 1/2 month period starting in mid-May and ending in early August. |
Trade Weighted U.S. Dollar Index, 2007-2020 |
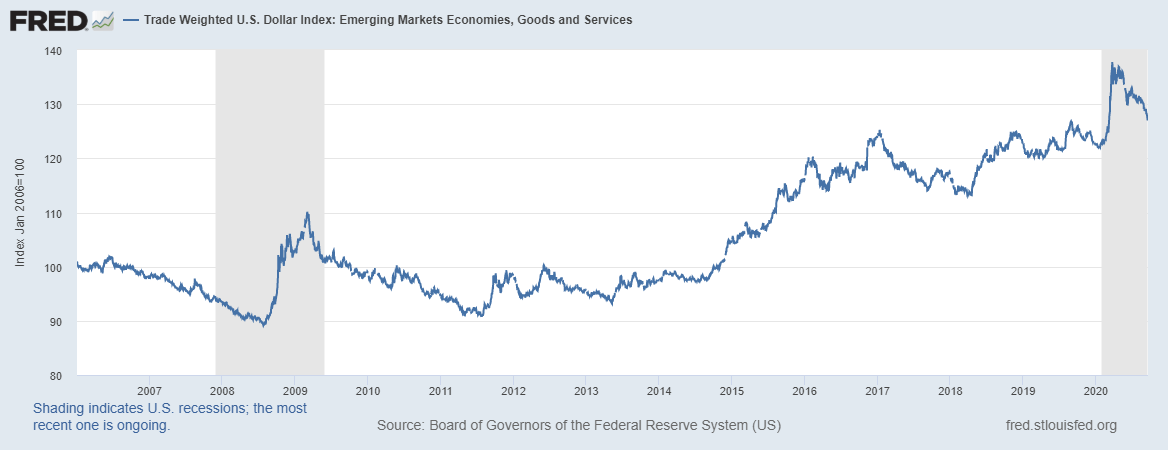
| But that decline has done nothing to change the long term trajectory of the dollar. The trend has been relentlessly higher since 2014 no matter what dollar index you prefer. From July 2014 to the peak on March 23 this year the broad trade weighted dollar index (not the DXY) rose 35.5% while the trade weighted EM dollar index rose 41.5%. More important was the rapid squeeze higher during the onset of the COVID shutdowns. From mid-February to the peak in March the broad dollar index rose 8.5% and the EM index rose 12%.
The spike in the dollar in February and March has largely been reversed with the recent weakness. But as I’ve said over the last few months as we’ve observed this move, the strong dollar environment is still largely intact. The broad dollar index is today at about the same level as the beginning of 2016. It has been both higher and lower during that time but where we are today is about 24% higher than where we were in mid-2014. The EM index is about 30% higher. That is, by anyone’s definition, a strong dollar. |
Trade Weighted U.S. Dollar Index, 2007-2020 |
The recent dollar rally is minor in comparison to the spike in March. The broad index is up about 2.5% from the lows while the EM index is up 3%. It has also been a more gradual rise than what we saw in March. This does not appear, at least at present, to be anything more than a correction of the short term trend. The dollar was oversold and the short dollar trade was crowded. A correction was inevitable and I warned about it in the Market Monitor earlier this month:
|
Gold |
| I expect a bounce from here but I am not looking for a big move. We don’t see any real stress out there right now that makes us believe another dollar squeeze is in the works. But neither do we see any big catalysts that might push the dollar down rapidly.
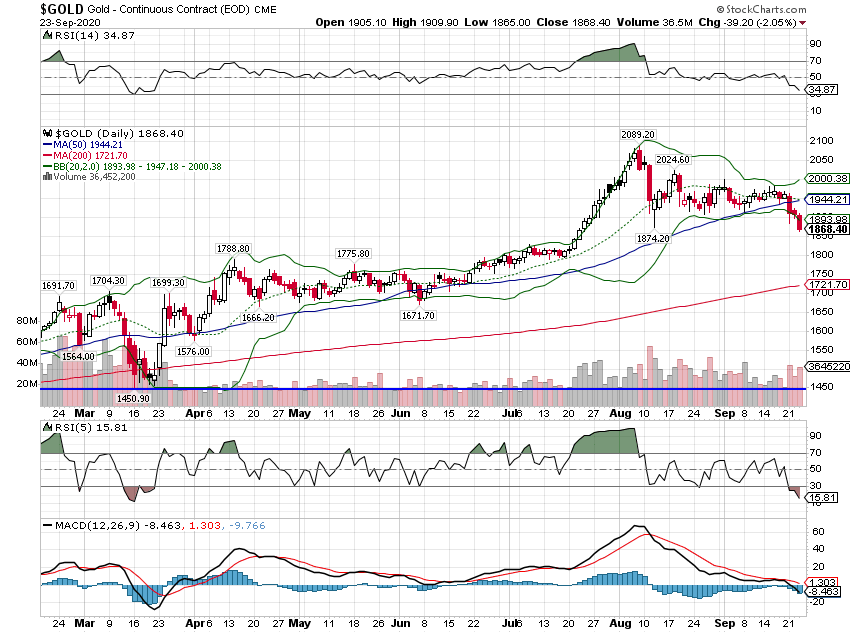
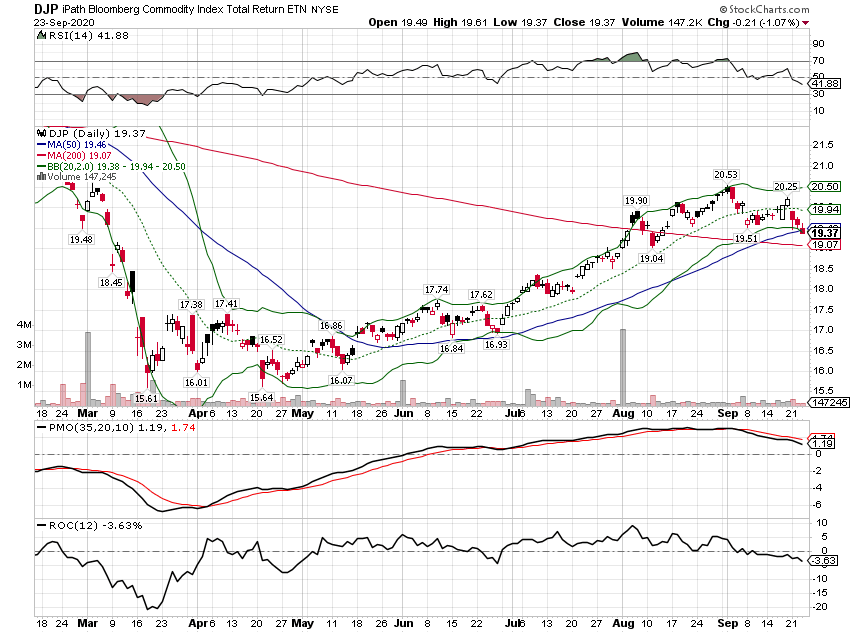
The short-term trend for the dollar is down and I think portfolios should continue to be positioned to benefit from weakness – for now. But measured from almost any time frame other than the panic peak in March tells a different story. The dollar has been and remains fairly strong against other global currencies. And so, with the dollar moving a bit higher, we’ve seen the weak dollar trades correct as well. Gold has corrected by 6.6% this month and about 10% from its peak. Could it fall more? Absolutely and if the dollar continues to rally it probably will (although it isn’t really about the dollar per se; see below). My short term target for the dollar is up another 2% or so in the short term and I would expect gold to fall another 5% or so if that happens. The general commodity indexes have also come down from their recent highs but the drop hasn’t been as dramatic as gold. Whether commodities come down more is at least as much about why the dollar is rallying as whether it does. If the perception is that the US economy is improving on an absolute basis, commodities will probably be bid. If it is merely that the US is improving relative to the rest of the world or just getting worse, then probably not. |
iPath Bloomberg Commodity Index Total Return |
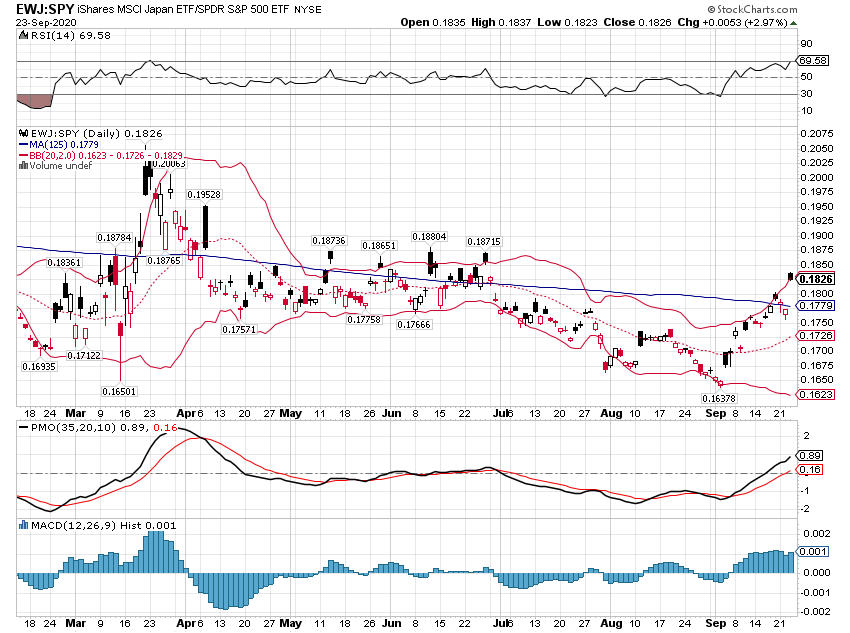
| The dollar rally is also affecting the relative performance of foreign stocks versus their US counterparts but not much. The S&P 500 is down 4.6% over the last month and 9.5% since its early September peak. Over the last month European stocks have outperformed the S&P 500 by about 0.5%, EM by 2% and Japan by a whopping 7.1%. The outperformance since the beginning of September is even larger. So, at least for now, the weak dollar stock plays we have in place continue to outperform. |
iShares MSCI Japan / S&P 500 ETF |
| One question I haven’t addressed is why the dollar is rallying. As I said in the Market Monitor and above, we don’t see any big stress out there that has us worried about a big spike a la March. In truth, it is impossible to determine a “cause” of a move this small. All we can really do is observe other markets to see if we can find some kind of confirmation across markets. In this case, I would point to real rates as providing some insight. The 10 year TIP yield has moved from -1.08 to -.94 since September 1 which lines up pretty neatly with the peak in the stock market. There is also a very solid inverse correlation between real rates and gold prices. A rise in real rates is perfectly consistent with a fall in gold.
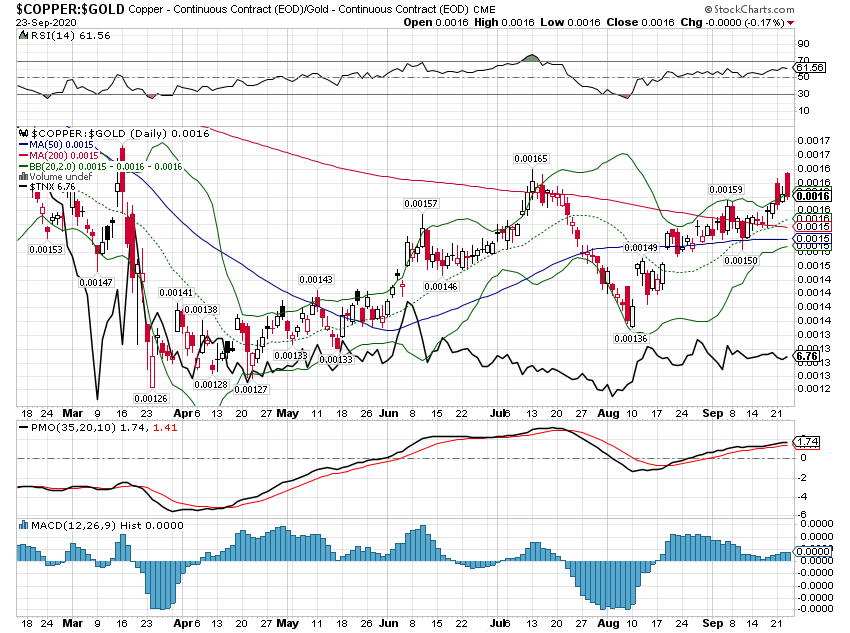
What makes real rates rise? I have always looked at real rates as indicative of real growth expectations. So, real rates rising means real growth expectations are rising. It sure isn’t much but we do see some other markets that seem to back up that view. Most obvious is that the value indexes, which tend to have more cyclical or economically sensitive stocks, have outperformed during this correction too. The S&P 500 value index has outperformed the S&P 500 growth index by 5.2% since the beginning of September. This isn’t a very big move though and that analysis is speculative at best. There has been no corresponding move higher in nominal rates so inflation expectations have fallen a little over the last month. But again, these are small moves and may not mean much of anything. One more potential clue is that copper has continue to outperform gold during this correction. The copper/gold ratio has been a reliable indicator of growth in the past and I see no reason to think that has changed. However, again, nominal interest rates are not responding as we would expect with a rising copper/gold ratio. Nevertheless, copper has outdone gold by 6.9% over the last month and 3.4% since the beginning of September. I see no other way to interpret that other than a rise in growth expectations. |
Copper / Gold ratio |
Why have growth expectations risen? That is hard to say but the economic data being released, while not that great, has been better than expected. In particular, there are two areas that point to better growth. First is housing where existing and new home sales are at the highs of the cycle. I do not like the implications of that for long term growth but in the short term it is a positive for GDP. Second is inventories where inventory/sales ratios have fallen well below where they were prior to the onset of the COVID shutdowns. That is usually seen as a potential positive for future production but whether that plays out is likely iffier than the bulls want to believe.
So there is some cross market confirmation of rising growth expectations but any change so far is minor. There is no reason to start doubting our general outlook which continues to be that on the other side of this virus mess lies an even slower growth trend than the 2% path that prevailed for years pre-virus. There will be a big bounce this quarter but that is a function of the depth of the hole we dug with the shutdowns. How long it lasts probably depends, at least to some degree, on how the virus proceeds. On that I have no insight and frankly I don’t think anyone else does either.
The recent market moves appear to be nothing more than a minor rotation based on slightly better growth expectations. Or it may just be that some the recent trends – such as the dollar downtrend – had gone too far and traders are protecting their profits. Whatever the reason, none of these moves has changed any of the big trends.
Full story here Are you the author? Previous post See more for Next post
Tags: Alhambra Research,Bonds,commodities,copper/gold ratio,currencies,Featured,Gold,Japan,Markets,newsletter,stocks,US dollar


