


Joseph Y. Calhoun
My articles My siteAbout meMy videosMy books
Follow on:LinkedINTwitterSeeking AlphaAmazon
|
Our Fortress strategic asset allocation includes 5 distinct asset classes: |
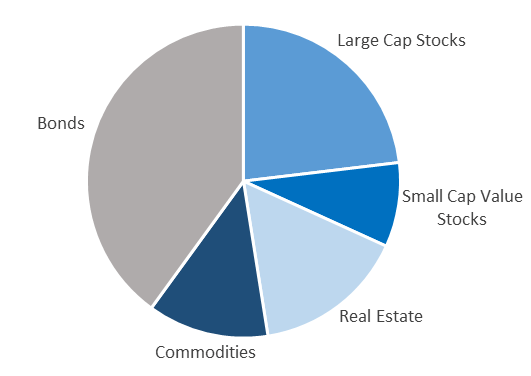 . |
| The Fortress allocation has historically produced better risk-adjusted returns than the traditional 60% stocks/40% bonds allocation. |
Bond Allocation - Click to enlarge |
| The bond allocation is varied to adjust the risk of the portfolio. A Fortress allocation with 20% bonds has produced a higher return with lower standard deviation (volatility) than the 60/40 portfolio. In a world where bond yields are at or near all-time lows, we think that ought to be of interest to investors.
Our approach has lagged in performance over the last 10 years, which isn’t surprising since our portfolios put an emphasis on preserving purchasing power. In a world of low inflation – deflation in some areas – it isn’t surprising that holding gold and commodities in your portfolio produced a lower-than-historically-average return. In a world that also includes – ironically in light of those low interest rates – massive government deficits and debt – we think that is a price worth paying. |
 . |
| We think you will eventually – maybe sooner than you think – need that protection very much.
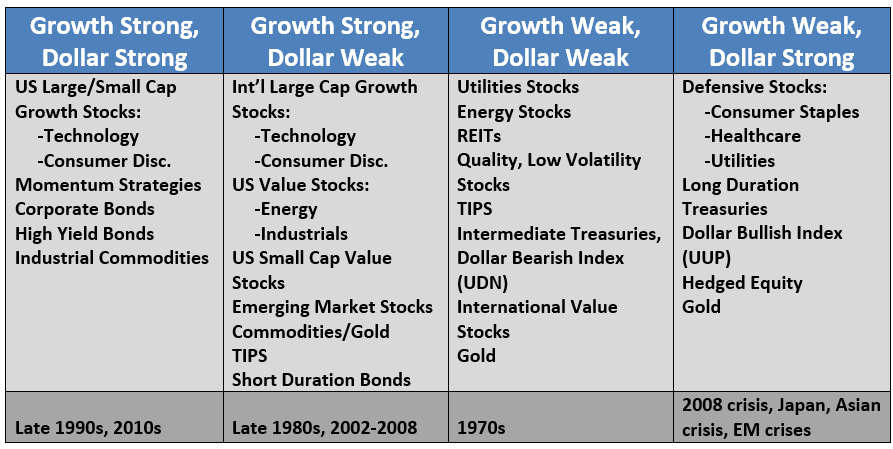
We make tactical changes to this Fortress Strategic allocation to produce our Citadel portfolios. We don’t think it makes sense to venture too far from the baseline of the strategic portfolio but we do think tactical changes can add value if they follow a logical methodology. We use, among other tools, macro-economic research to tactically adjust our portfolios: The most important factors for asset allocation are growth and the trend of the dollar. The uncertainty around those two variables these days is not unprecedented, but the only other comparable time was 2008. That might seem disconcerting at first, but remember that we did recover from 2008. It wasn’t a very robust recovery and it took a long time but we did recover. And we’ll recover from this virus too. Economic Policy Uncertainty Index |
US Economic Policy Uncertainly Index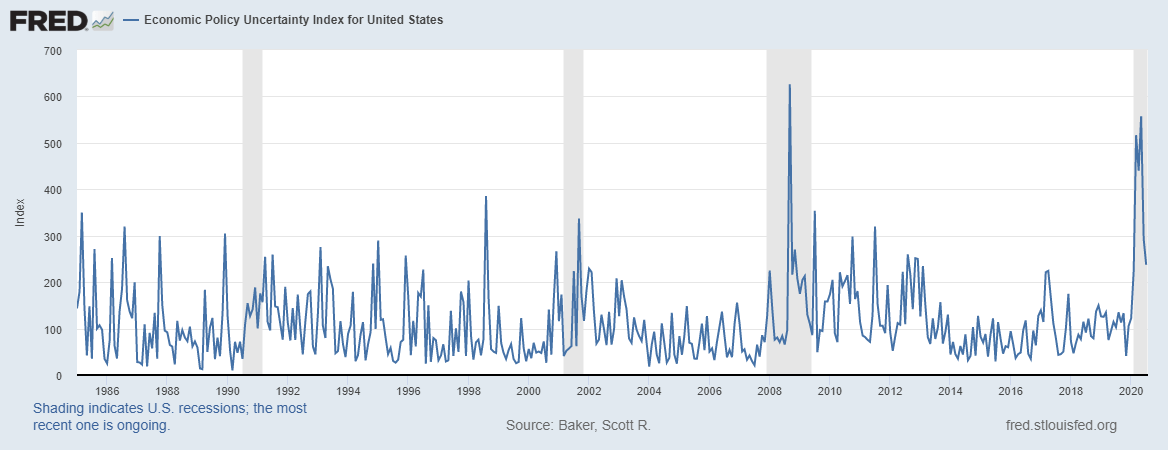 - Click to enlarge |
| Our tactical changes are informed by the economic environment as shown above, but identifying the environment properly can be challenging. As I’ve said many, many times, we aren’t in the business of predicting the future, because that is an impossible task, but we are trying to interpret the present and that isn’t as easy as it sounds. But it is worthwhile because the payoff for getting the big trends right can be enormous.
The dominant themes of the last decade are consistent with what we expect from a strong dollar environment outside of recession:
Those trends are a result of a (mostly) strong dollar environment with fairly steady growth. |
US Dollar Index - Cash Settle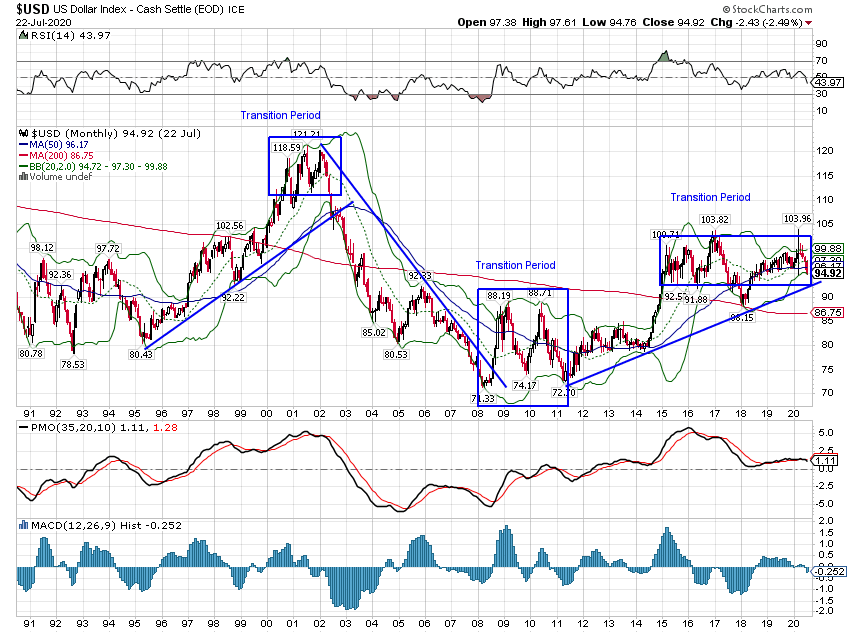 - Click to enlarge |
| Growth has waxed and waned over the last decade but until recently it just oscillated around a 2% trend.
The dollar has been generally strong but the rise was concentrated in a surprisingly short period of time in 2014 and 2015. Since that surge, the dollar index has mostly traded in a range with a couple of forays outside the box. But a relatively strong and stable dollar is actually a pretty good investment environment as long as you own the right things, those being the things in that list of dominant themes of the last decade. Since the panic phase of the virus recession passed, the dollar has been weakening back to the bottom of the range that has prevailed since 2015: We don’t know yet whether this short-term trend will turn into an intermediate one, and eventually a long-term one. But the move has been sufficiently powerful that we have made tactical changes to take advantage of it. We look to momentum in markets to confirm the dollar trend so we are not all-in on a weak dollar outcome. There are still strong dollar trends in place in some areas as shifts like this aren’t generally uniform. There are plenty of reasons, as our Jeff Snider is fond of pointing out, to believe this short-term downtrend will be just that – short-term. But a 9% drop in the space of four months cannot be ignored. |
US Dollar Index - Cash Settle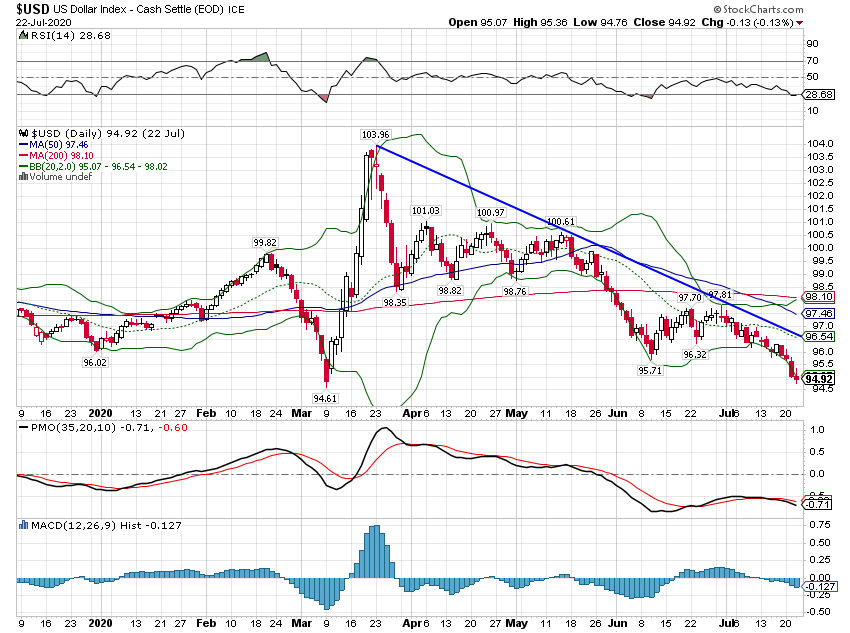 - Click to enlarge |
Current Tactical Positioning |
iShares MSCI/S&P 500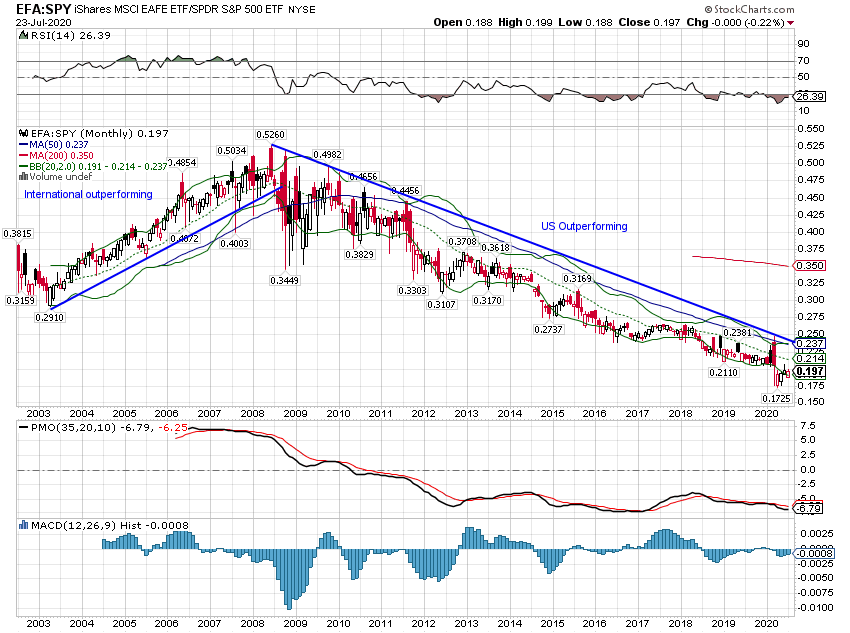 - Click to enlarge |
Large Company StocksBenchmark = S&P 500 Tactical Positioning:
International outperforms in a weak dollar environment while the US wins in the strong dollar story. The US outperformance trend that has been in place since 2008 is intact: |
iShares MSCI/S&P 500- Click to enlarge |
| But international has outperformed more recently. We think this is as much about the perception of the course of the virus as the actual relative performance between the US and the rest of the world. The perception is that Asia and Europe have done a better job of containing the virus and that their economies will recover sooner. The difference so far is not very large: |
iShares MSCI/S&P 500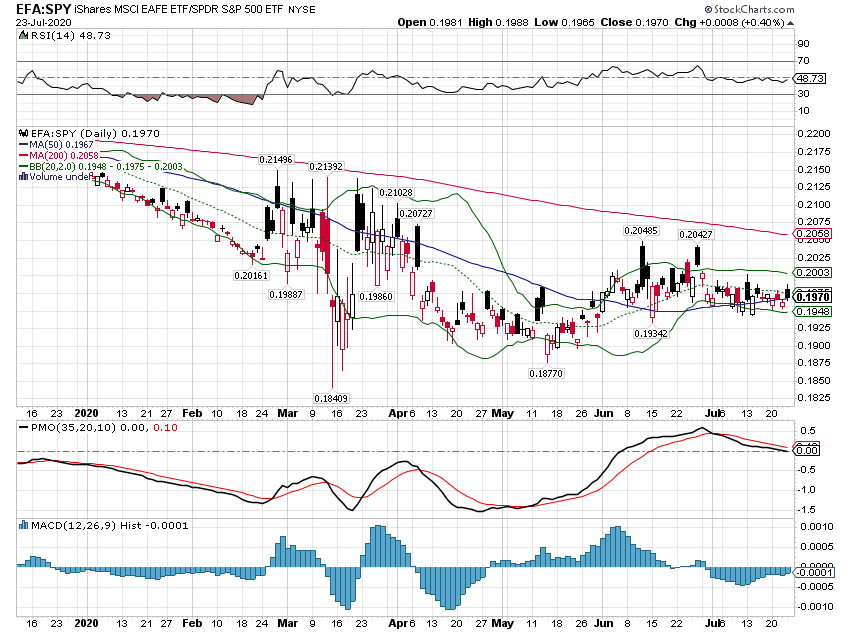 - Click to enlarge |
| Value tends to outperform during weak dollar periods and growth outperforms in strong dollar period: |
iShares S&P 500 Value/iShares S&P 500 Growth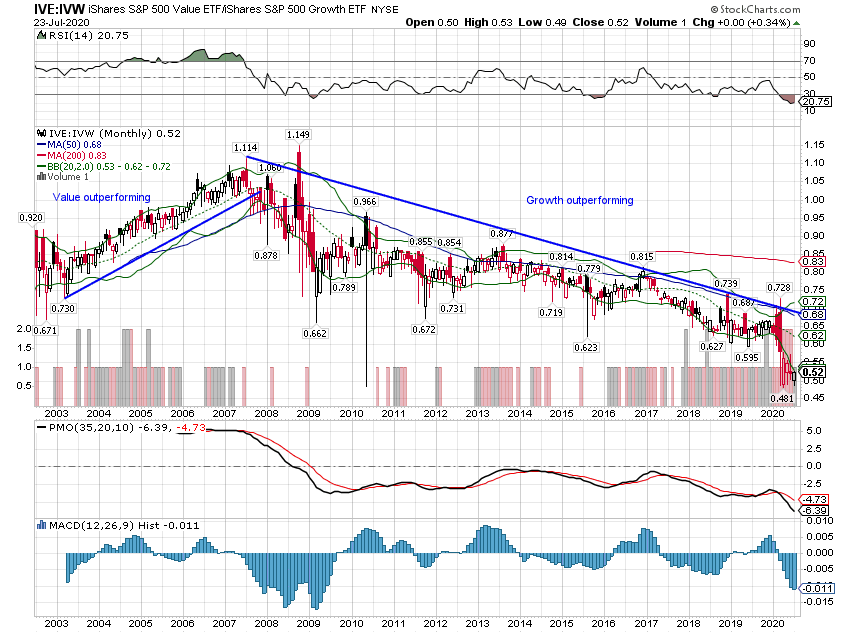 - Click to enlarge |
| But this period of dollar weakness has not produced any change in trend: |
iShares S&P 500 Value/iShares S&P 500 Growth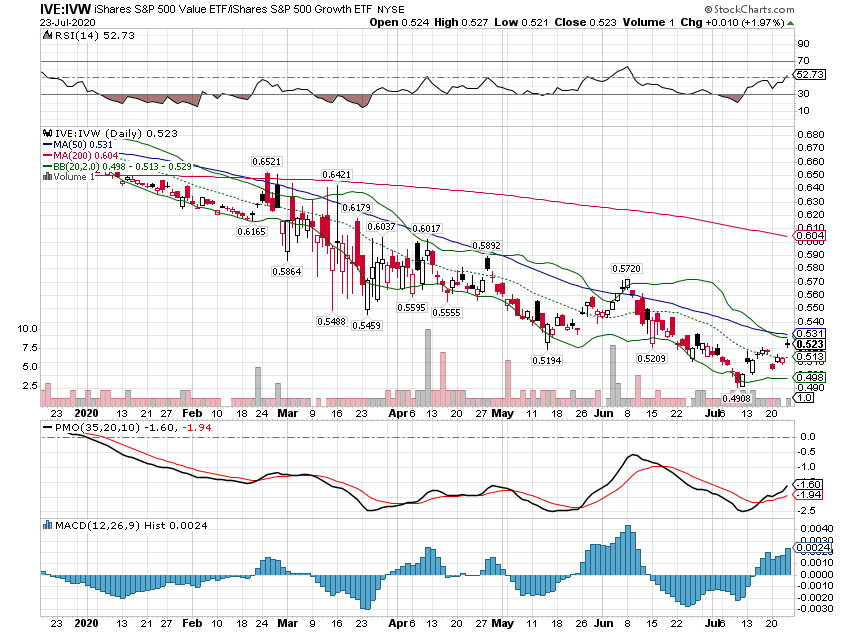 - Click to enlarge |
| The difference in performance between small and large caps is not as stark in weak and strong dollar periods, but small caps do outperform in a weak dollar environment. This is one of those very counterintuitive things that most people get wrong. The narrative is that large US companies get a lot of non-dollar revenue and should then benefit from a cheaper dollar (the same number of Euros translates into more dollars). The fatal flaw in the argument, I think, is that most of the products these companies sell outside the US are produced outside the US too. Their revenues may rise but so will their costs. |
iShares Russell 2000/S&P 500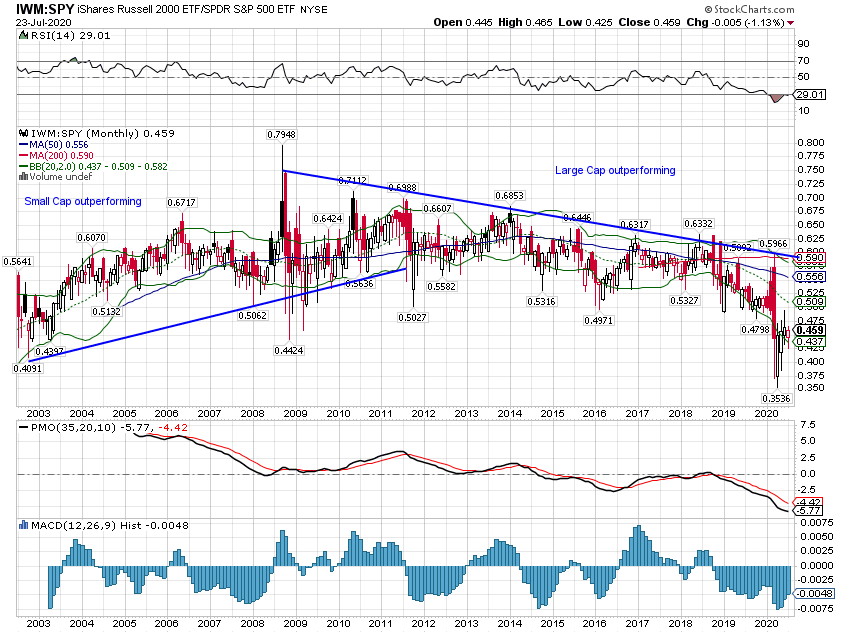 - Click to enlarge |
| As the dollar has weakened recently small-cap has outperformed: |
iShares Russell 2000/S&P 500 - Click to enlarge |
| Emerging markets also respond positively to a weak dollar: |
iShares MSCI Emerging Markets/S&P 500 ETF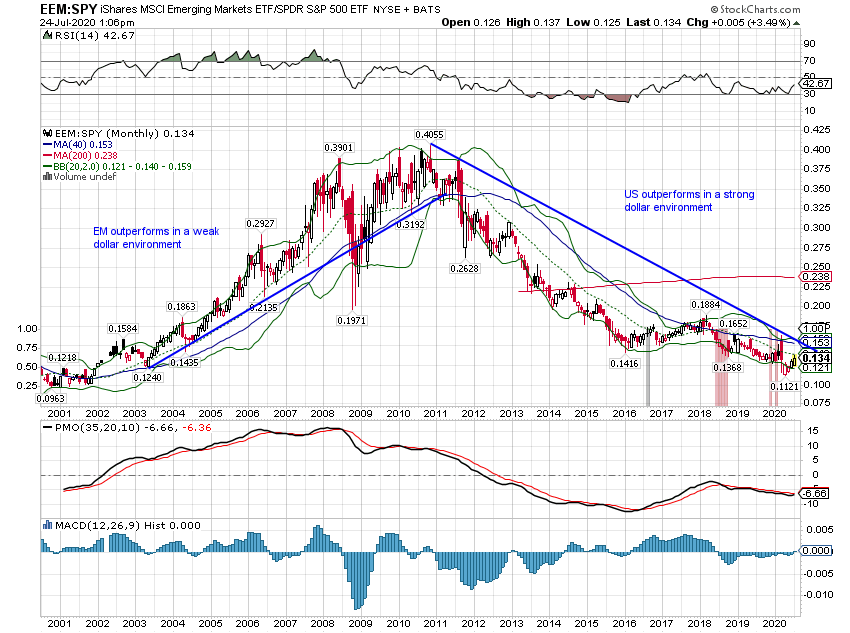 - Click to enlarge |
| …and have outperformed the S&P 500 recently: |
iShares MSCI Emerging Markets/S&P 500 ETF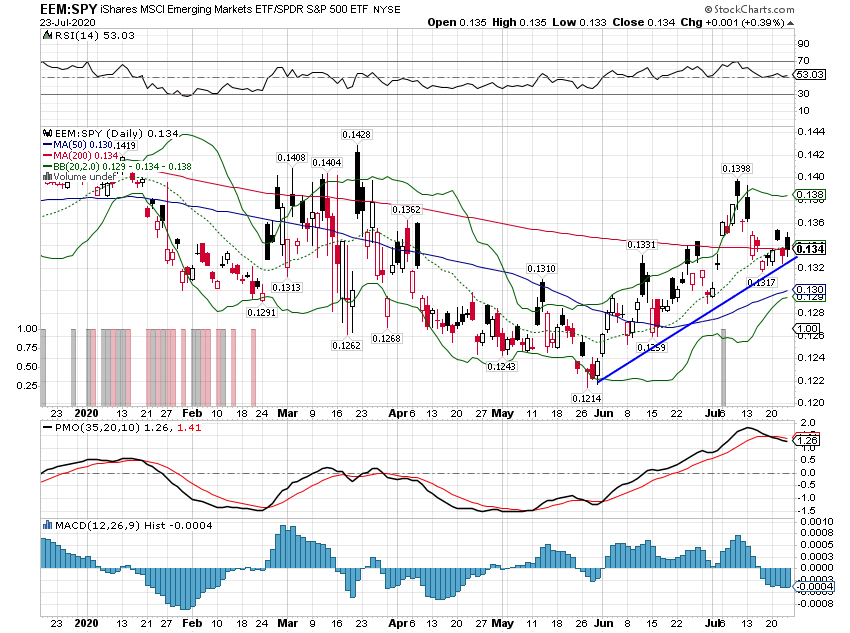 - Click to enlarge |
| But so far at least, the market is not showing a clear preference for EM over other developed international markets. We have not taken a position in EM yet – except for a quick, profitable trade in Latin America last month – because the added risk is not, so far, translating into added return. If the dollar downtrend becomes more entrenched that will probably change. |
iShares MSCI Emerging Markets/iShares MSCI EAFE ETF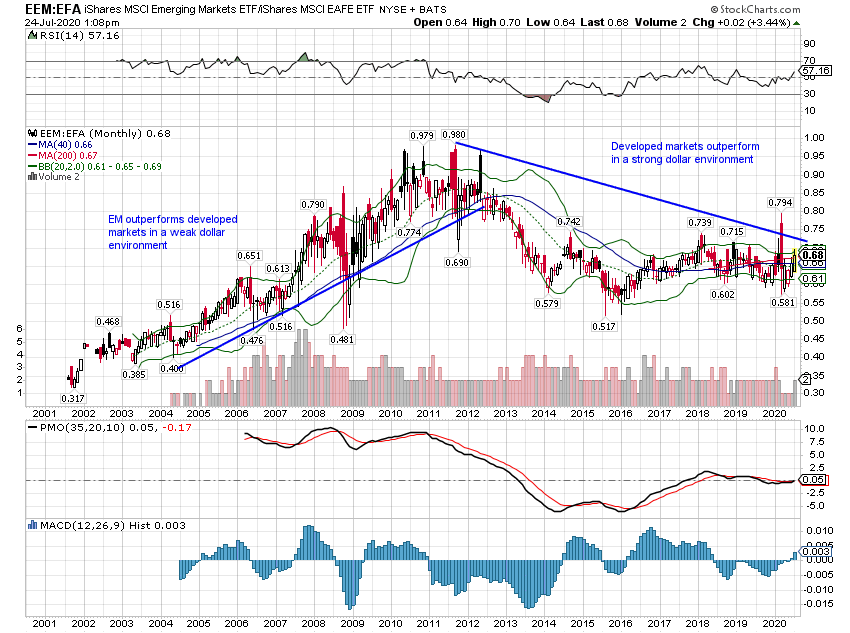 - Click to enlarge |
| Natural resource and materials stocks have moved higher as commodity markets have firmed. |
S&P Global Natural Resources/S&P 500 ETF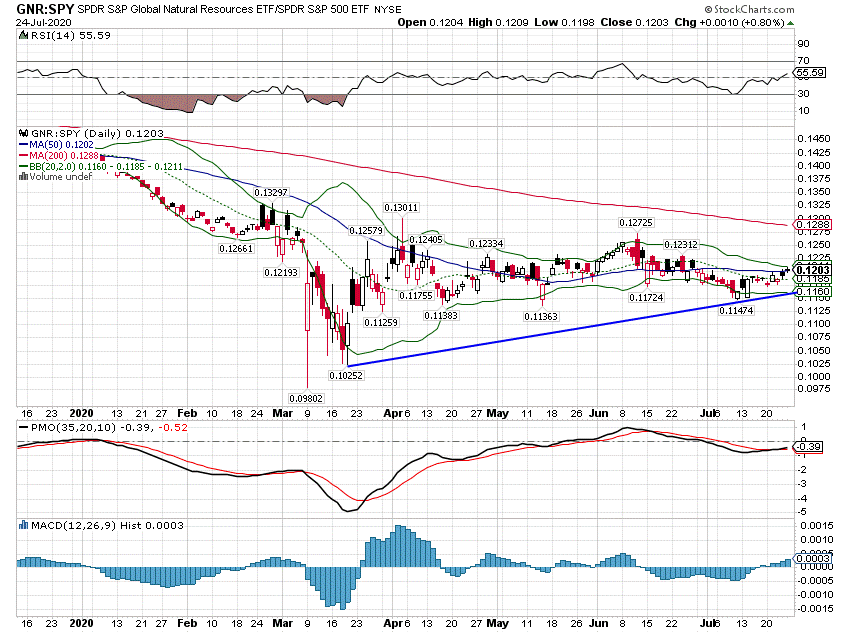 - Click to enlarge |
iShares Global Materials/S&P 500 ETF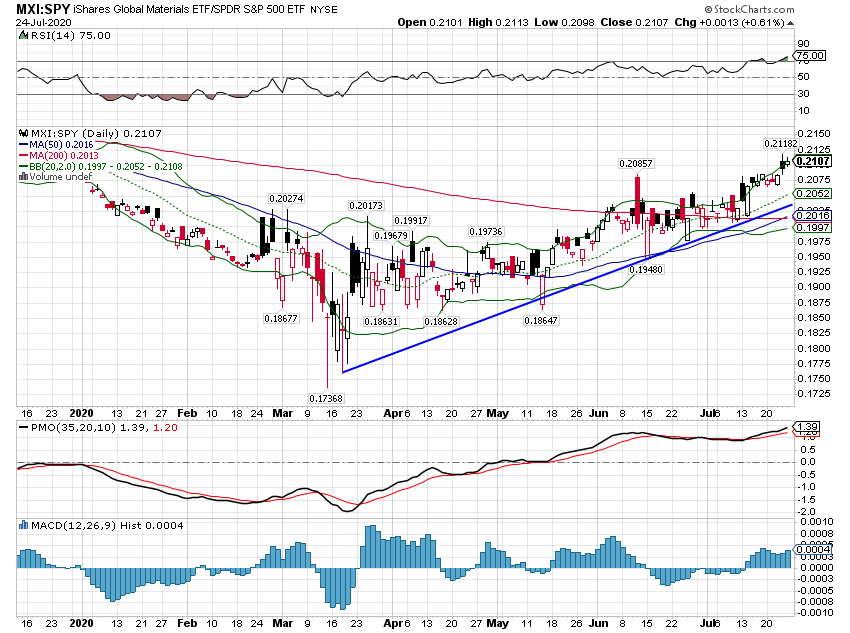 - Click to enlarge |
|
Small Company StocksBenchmark = Russell 2000 Tactical positioning
Small-cap has outperformed large-cap recently but we are concerned about the economic outlook and so are not willing to overweight small caps yet. |
iShares Russell 2000/S&P 500 ETF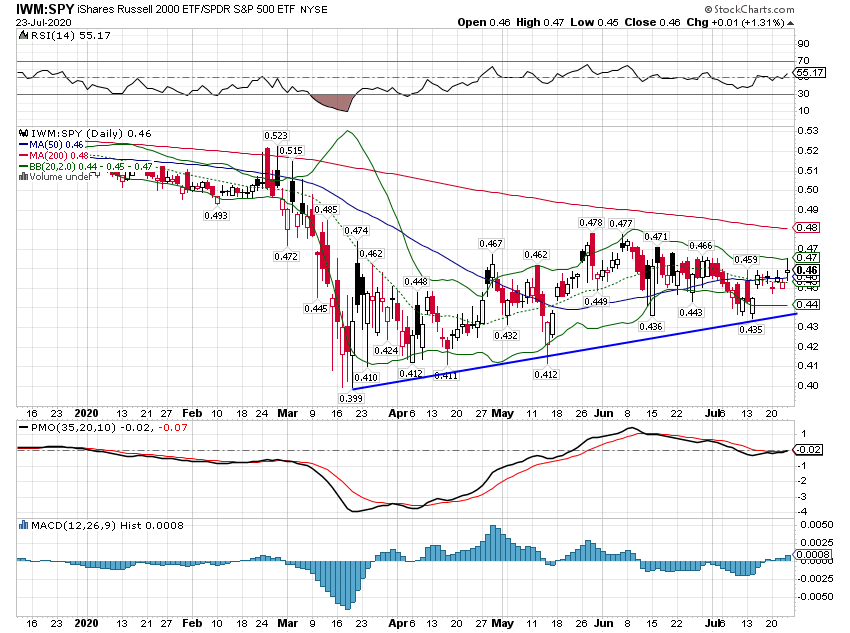 - Click to enlarge |
| International small-cap has been in a gentle uptrend vs US small-cap since late 2018. As a result, we have maintained our normal allocation to international SC: |
iShares MSCI EAFE Small Cap/iShares Russell 2000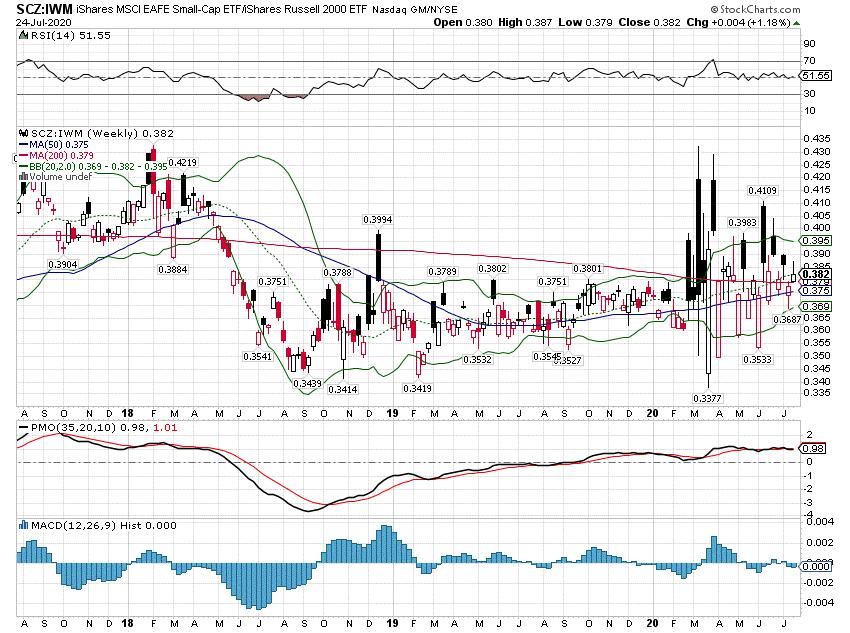 - Click to enlarge |
| Small-cap value tends to underperform small-cap growth in strong dollar periods and that has proven true this cycle as well. At some point, if the economic outlook stabilizes a bit, we will likely add SC value to raise the overall allocation to small companies. |
iShares Russel 2000 Value/iShares Russel 2000 Growth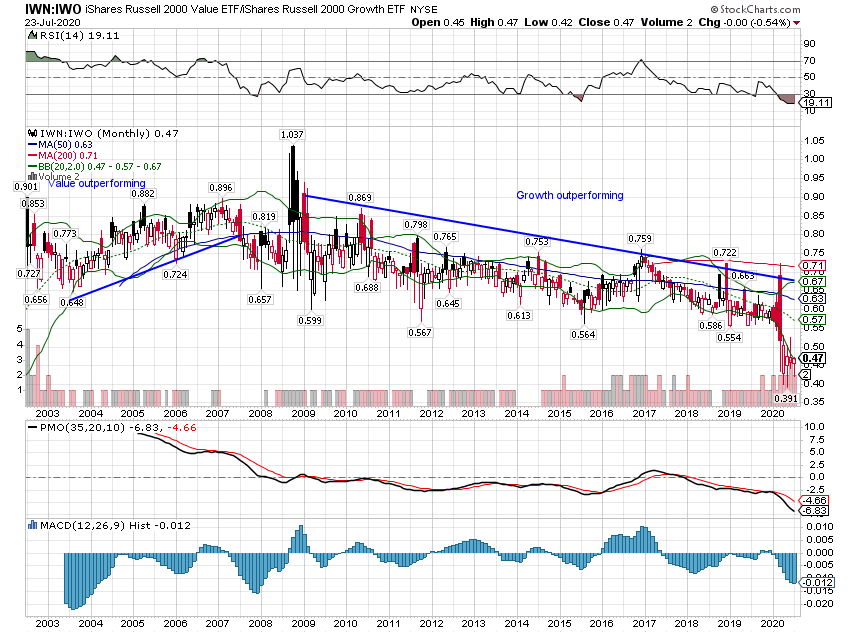 - Click to enlarge |
Real EstateBenchmark = DJ REIT Index Tactical Positioning:
We are currently underweight real estate in our portfolios. Of all the assets we follow, real estate has the greatest uncertainty right now. The long-term impact on real estate from the virus is hard to predict without knowing when the virus threat will be relieved. While office, hotel, and retail seem the most likely to see a large impact, even residential will be affected especially on a geographic basis. If the migration out of large cities continues, we may see a bifurcated market where small and mid-sized cities perform better than large cities. |
iShares US Real Estate/S&P 500 ETF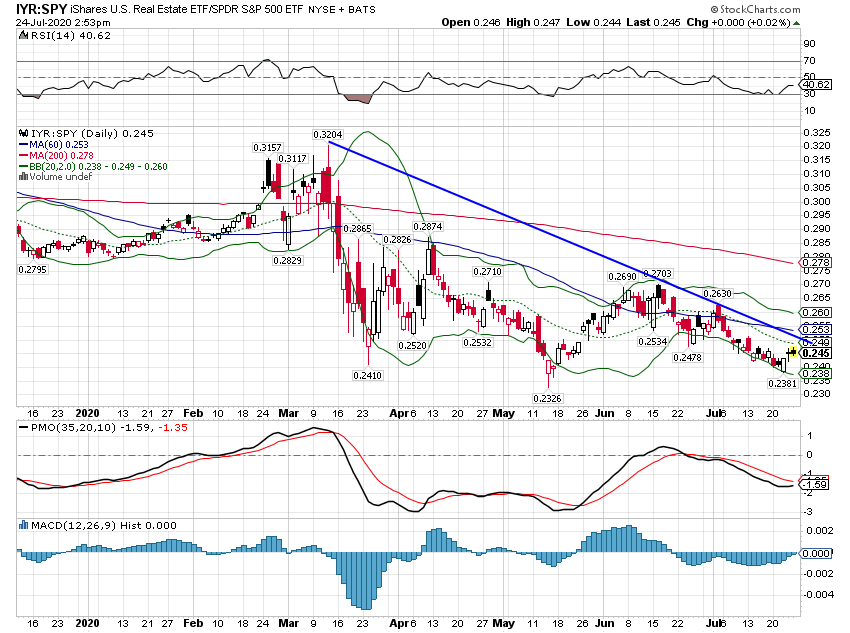 - Click to enlarge |
| How real estate changes in the coming years will likely offer some interesting investments, but we don’t think prices are cheap enough to warrant a full allocation right now. We are currently researching some individual companies that are less affected by the virus but have yet to make any significant investments.
The uncertainty is reflected in the performance of the REIT index ETF relative to stocks: Real estate does perform better in a weak dollar environment but right now the fundamentals of the industry outweigh the weak dollar. |
iShares US Real Estate/ S&P 500 ETF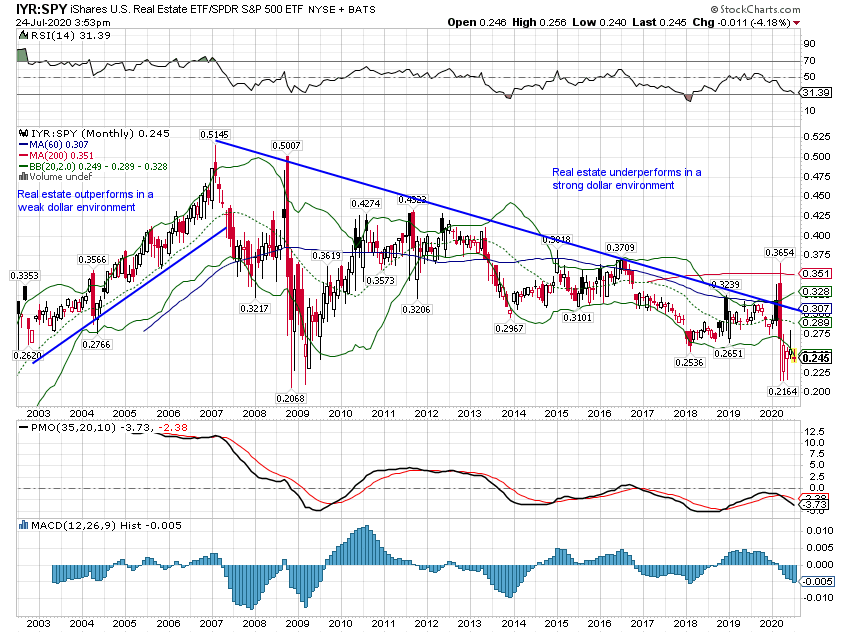 - Click to enlarge |
| International real estate has underperformed the US this entire cycle: |
Dow Jones International Real Estate/iShares US Real Estate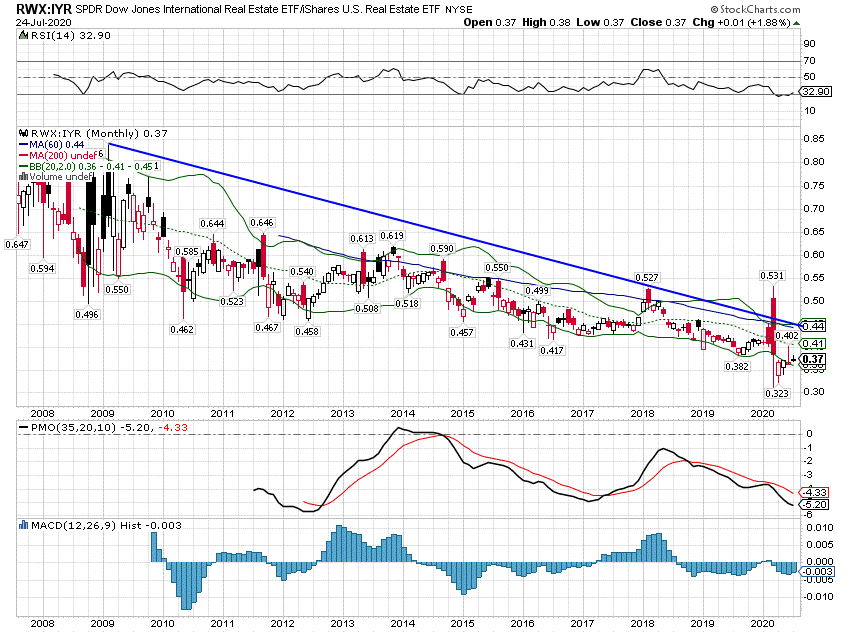 - Click to enlarge |
| It has performed relatively better recently but we think international real estate will face many of the same problems as the US: |
Dow Jones International Real Estate / iShares US Real Estate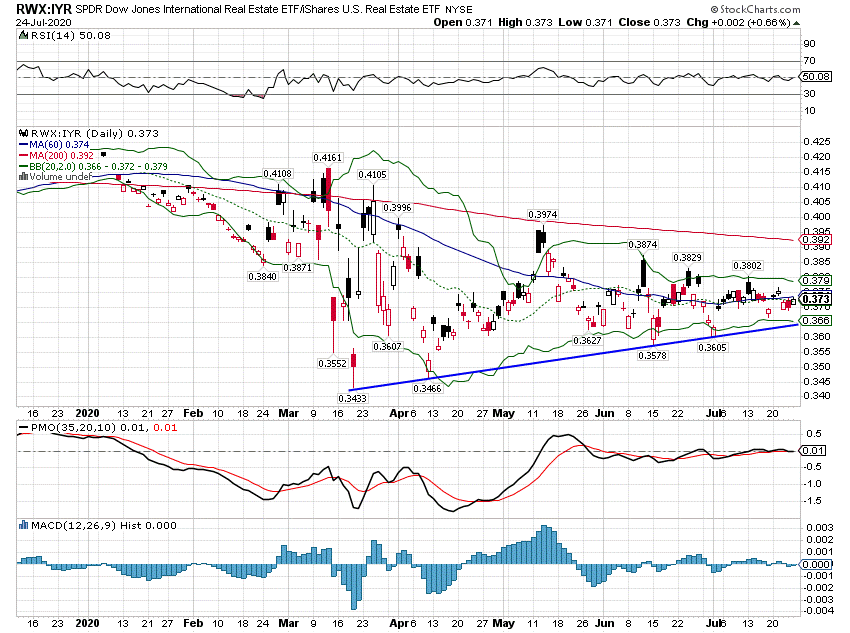 - Click to enlarge |
CommoditiesBenchmark = GSCI Tactical Positioning:
Commodities tend to outperform during weak dollar periods while stocks take the lead in strong dollar periods. A weak dollar isn’t necessary for outperformance (look at 1999) but it is certainly a help. |
S&P GSCI Commodity Index/S&P 500 Large Cap Index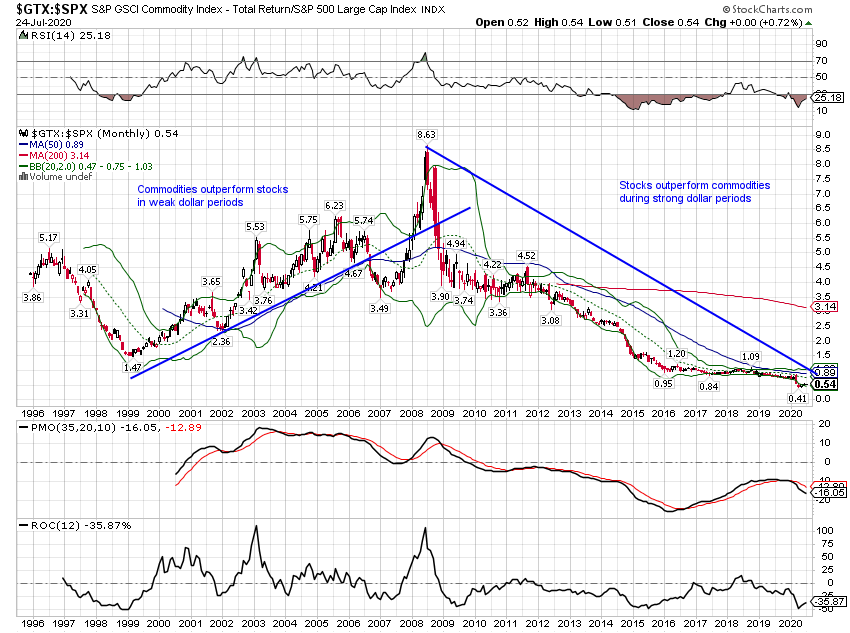 - Click to enlarge |
| Commodities have outperformed slightly since late April but the outperformance hasn’t been all that significant. |
S&P GSCI Commodity Index/S&P 500 Large Cap Index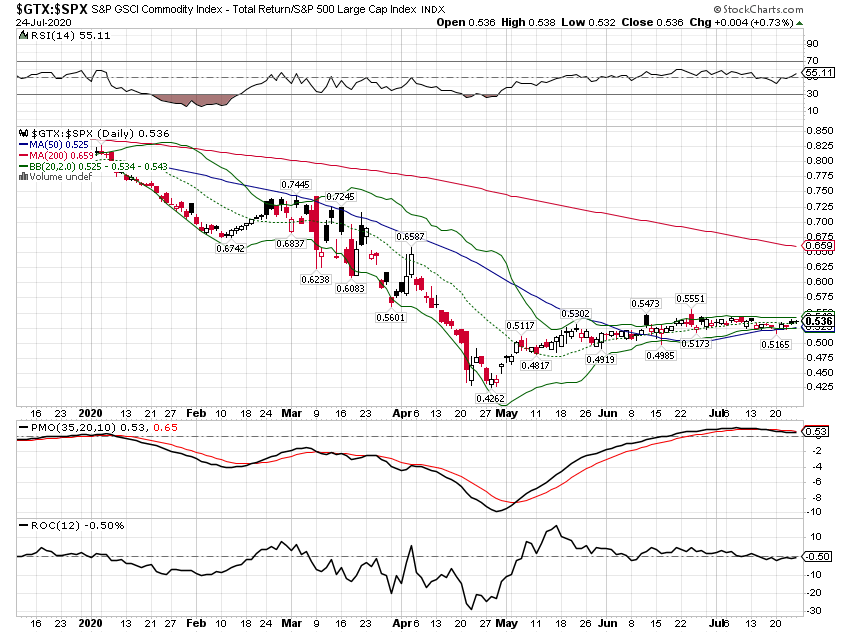 - Click to enlarge |
| Gold is a special situation in the commodity complex and it also outperforms in a weak dollar environment: |
Gold/S&P 500 Large Cap Index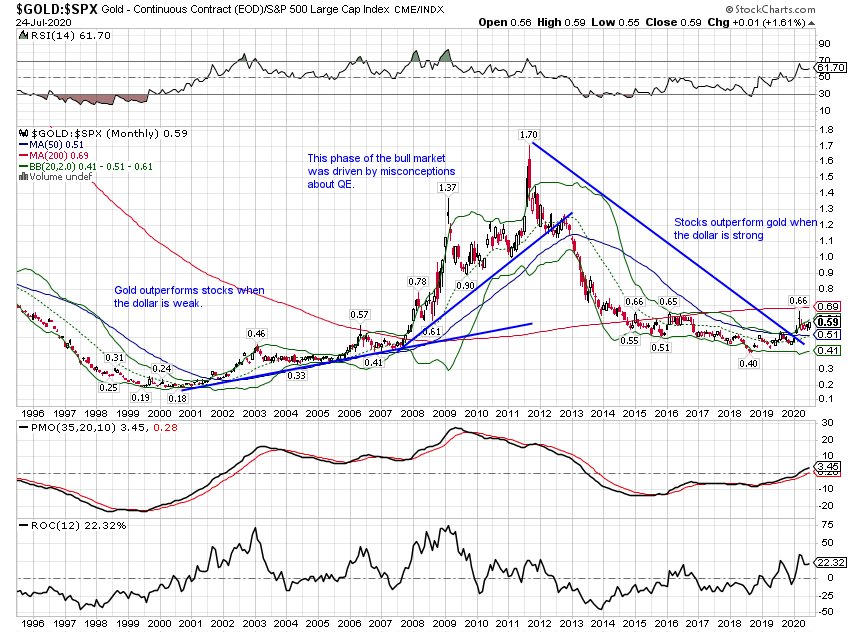 - Click to enlarge |
| In the above chart, it is interesting that momentum shifted to gold in mid-1999, almost three years before the dollar finally peaked. Gold appears to have anticipated the dollar weakness. That could be significant since we’ve seen the same recently. Gold has outperformed stocks since late 2018: |
Gold/S&P 500 Large Cap Index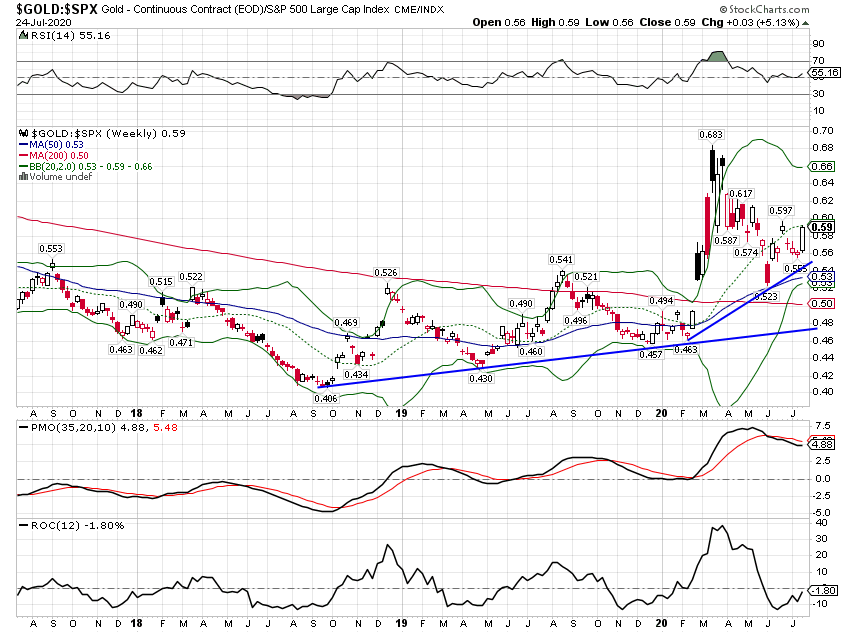 - Click to enlarge |
| Gold outperformed stocks and the general commodity indexes during the heart of the virus crisis and our portfolios were overweight at the time. Our baseline model is to split our commodity allocation equally between gold and a general commodity index. During the crisis, we had 75% of the commodity allocation in gold. We shifted back to equal weight in April. Over the last few days, as gold has approached its all-time high, gold has started to outperform again. A shift back to overweight gold will likely depend on the economic data over the coming weeks. If growth continues to flag, gold will likely continue to outperform: |
Gold/S&P 500 Large Cap Index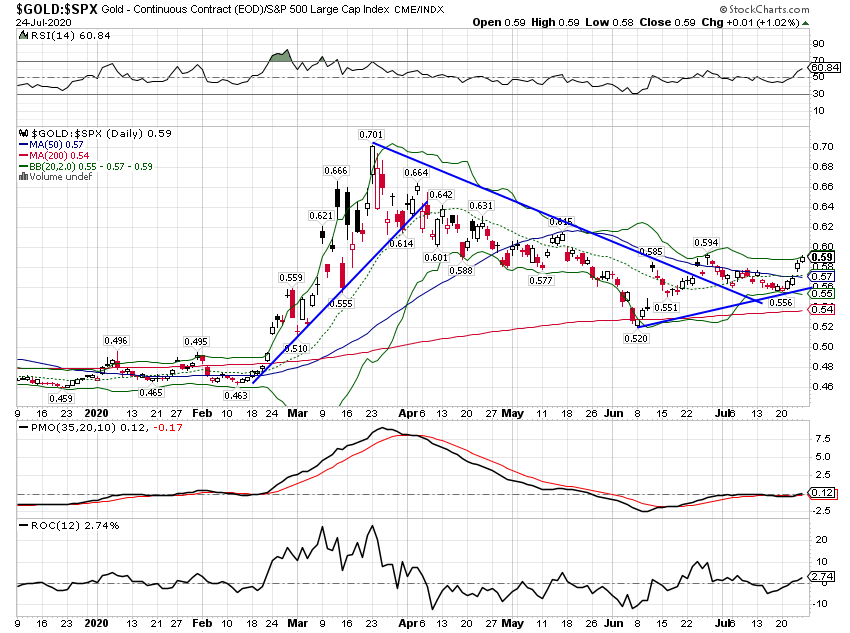 - Click to enlarge |
| We have gotten a number of questions recently about silver which has outperformed gold recently. Gold has been in a strong uptrend versus silver since 2011 and this recent surge in silver hasn’t changed that. It may eventually and we have seen multiple-year periods in the past where silver outperformed. But for now, we do not believe a big shift from gold to silver is warranted. |
Gold/Silver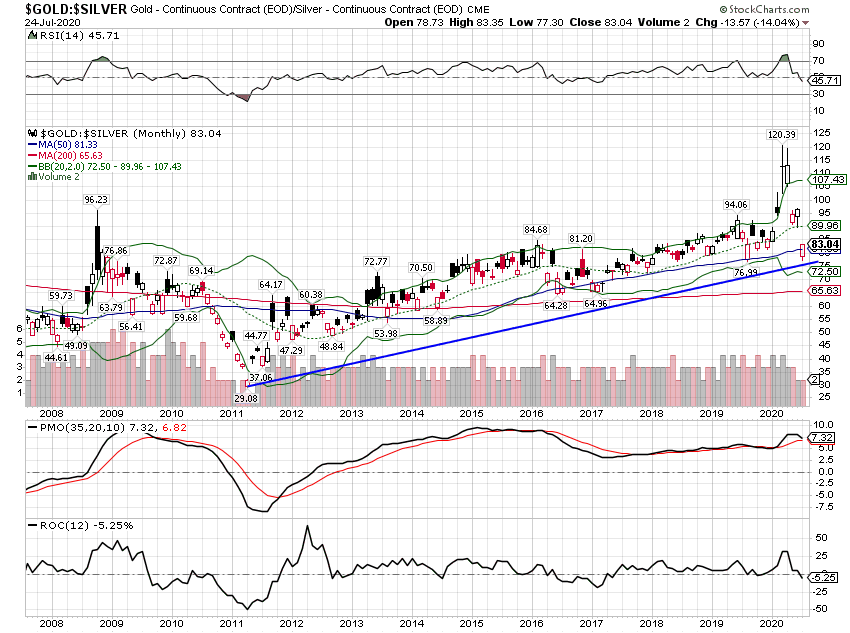 - Click to enlarge |
| We are actually more interested in other industrial metals like platinum and copper. Copper has outperformed gold recently: |
Cooper / Gold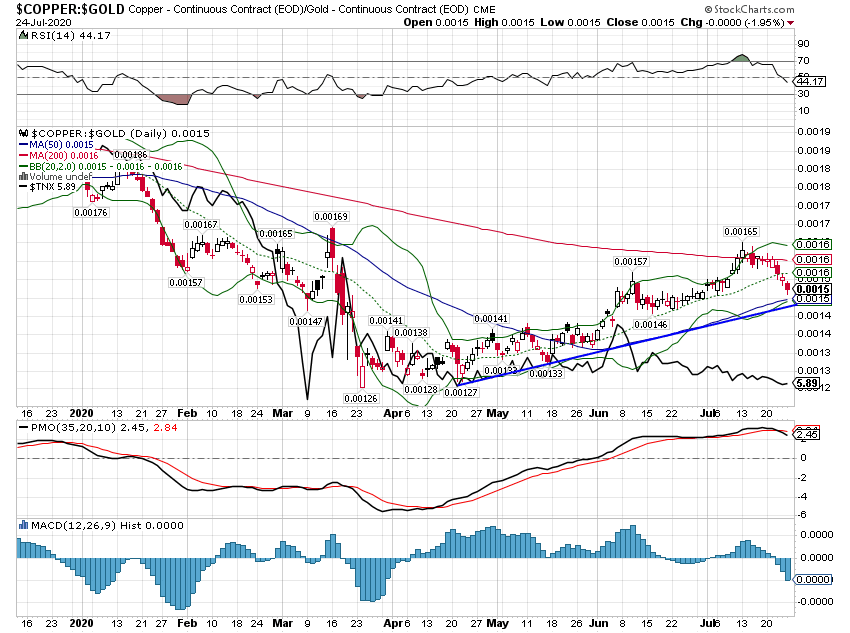 - Click to enlarge |
| Copper is at a multi-decade low relative to gold: |
Cooper / Gold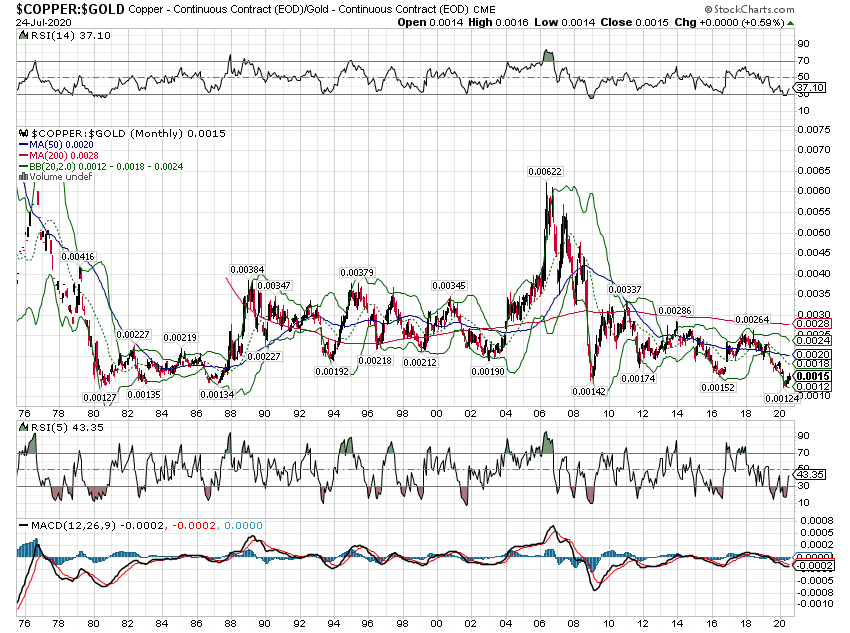 - Click to enlarge |
| As is Platinum: |
Platinum/Gold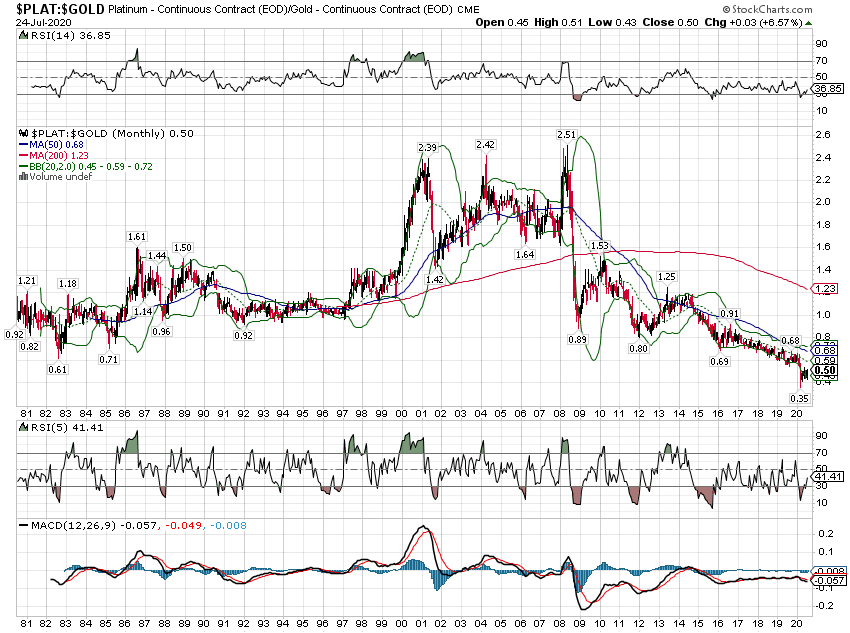 - Click to enlarge |
| But while gold has been getting all the press, platinum has been quietly outperforming:
We have not taken positions in either of these yet as they are very sensitive to changes in the economic outlook. We’d like to see some progress on the virus and the fiscal package Congress is working on before taking a position. |
Aberdeen Standard Physical Platinum/Gold Trust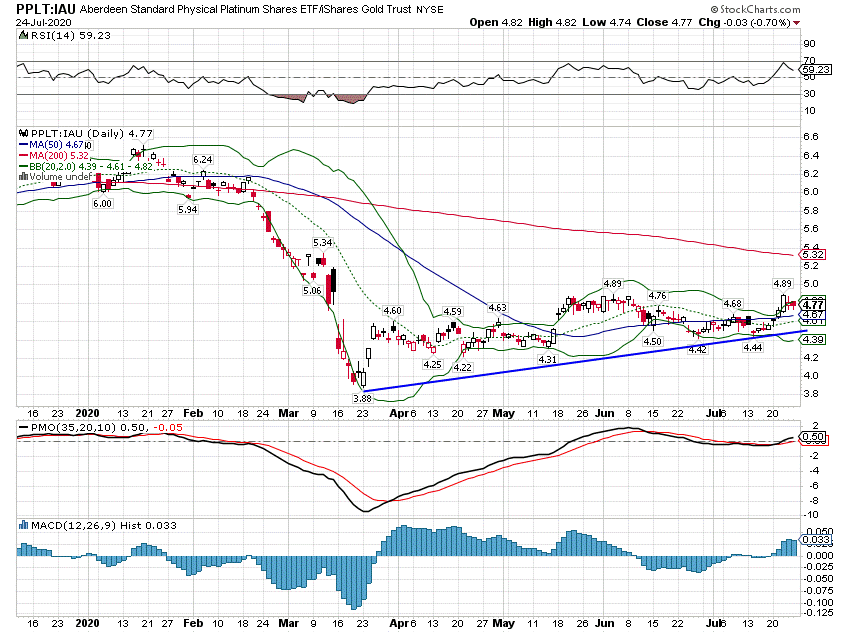 - Click to enlarge |
BondsBenchmark = 3 -7 Year Treasury Index Tactical Positioning:
The majority of our bond allocation is in the benchmark but we have maintained a position in TIPS for several years and continue to do so. Long-duration Treasuries at this point look like return-less risk. The only upside for bonds is the potential for a real-life depression and negative yields. We won’t rule that out but we don’t think it should be the base case. |
Ishares TIPS Bond ETF/Ishares 3-7 Year Treasury Bond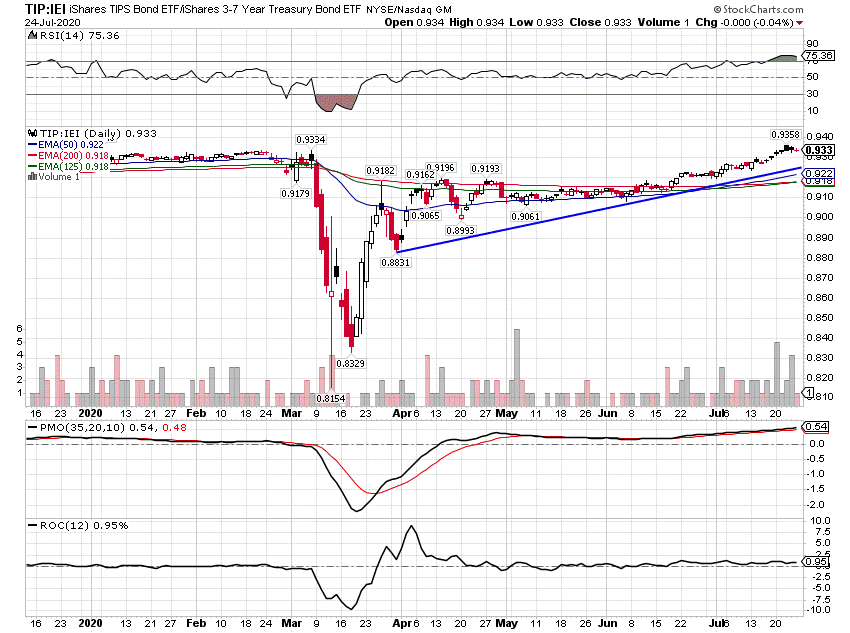 - Click to enlarge |
AddendumTechnology vs Everything Else The NASDAQ has vastly outperformed the S&P during this strong dollar period. It underperformed in the previous weak dollar period. The underperformance during the weak dollar period is not solely due to the dot com bubble aftermath either. NASDAQ bottomed in late 2002 but underperformed until the post-2008 crisis period. |
Invesco QQQ Trust/SPDR S&P 500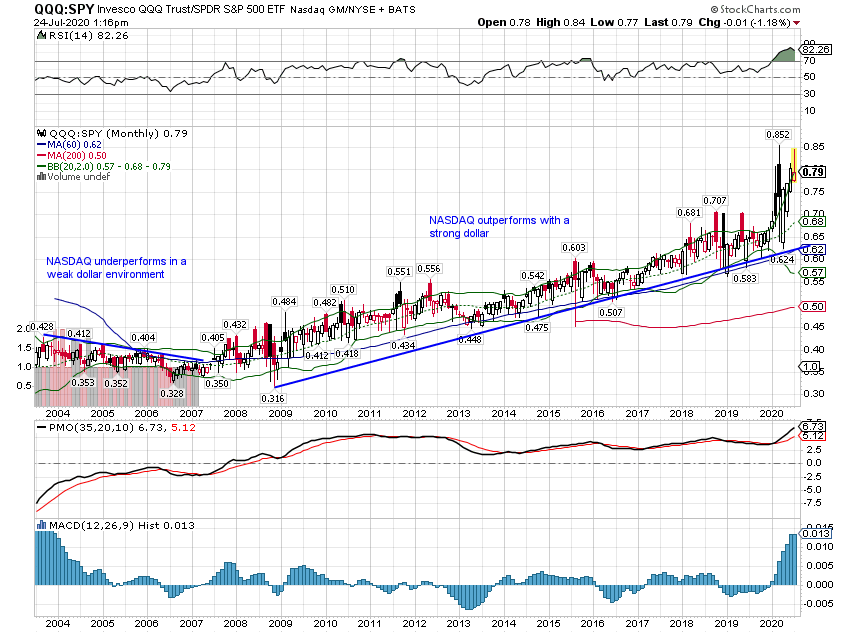 - Click to enlarge |
| What should be of most concern to investors is the extreme nature of the recent outperformance. We haven’t seen any comparable extreme since 2000. |
Nasdaq Composite/S&P 500 Large Cap Index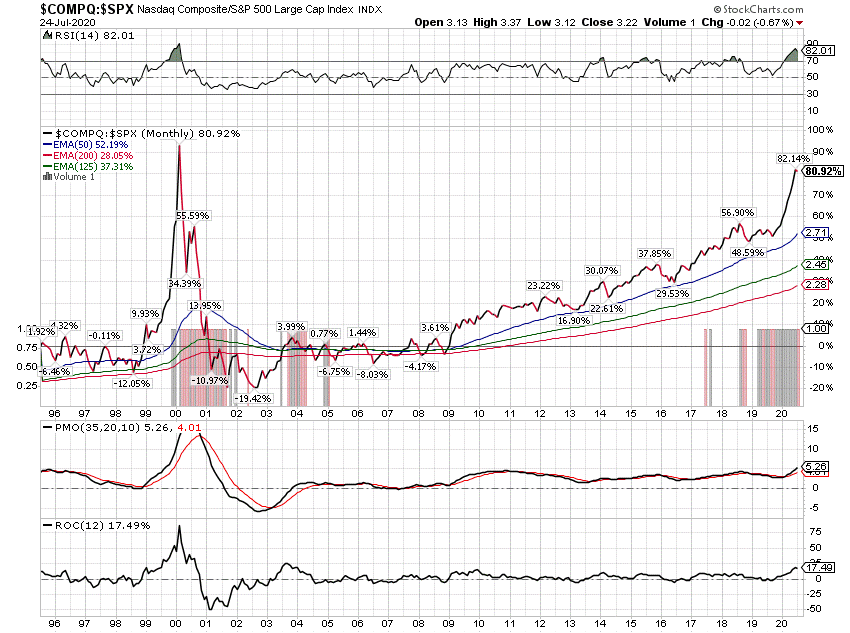 - Click to enlarge |
| This trend is so strong that it hasn’t been affected by the recent dollar weakness. We have seen some pullback over the last couple of weeks but technically that looks pretty meaningless. Out specific technology exposure is mostly in our individual stock portfolios where we have owned Apple, Microsoft, and Sony for a number of years. We recently reduced our allocation to technology by rebalancing Apple and Microsoft back down to their target allocations and by selling some other positions. |
Invesco QQQ Trust/SPDR S&P500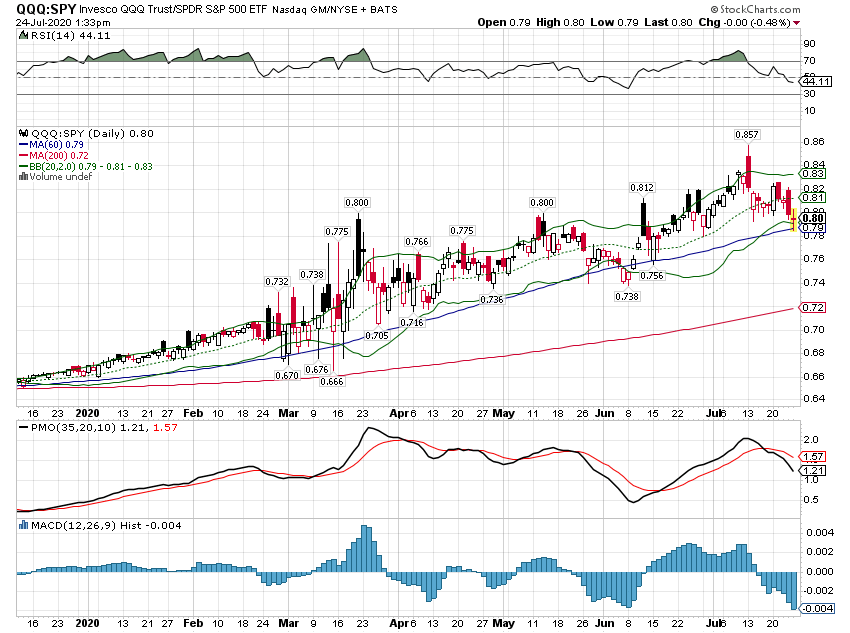 - Click to enlarge |
| We are not ones to shout “Bubble” every time we see some group of assets massively outperform. The bubble label gets tossed around way too much, in our opinion. And while the level of outperformance is nearly as extreme as 2000, the fundamental story is different. Most prominently, the dominant tech firms that make up the NASDAQ are very, very profitable, a sharp contrast with the late 90s dot com era.
However, there is a limit to all things and we think this one is getting close. If nothing else, they face some math problems. If Google and Facebook were to continue to grow their ad businesses, at their current pace they would, in just a few years, capture more ad dollars then are currently being spent. Factoring in a historical growth rate just delays that by a short time. In any case, assuming any growth in advertising spending at this point seems wildly optimistic. These companies will have to find other sources of revenue if they are to maintain their current growth rate. And that is something, for all their technical expertise, they haven’t been able to do yet. |
Fortress Portfolio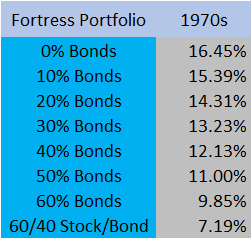 - Click to enlarge |
Conclusion
As I said at the top, our tactical positioning depends on the economic growth and dollar trends. Most of these tactical changes are based on the short-term dollar trend. The economic trend is harder to determine right now, but with real interest rates making new lows on a daily basis, it seems safe to say that real growth expectations are not exactly ripping higher.
Based on the demand for inflation protection – gold and TIPS – it would seem that investors’ focus is more on prices. Lousy growth and rising inflation may tickle the memory of a few older investors but it is a condition that most of today’s investors have never experienced. I feel quite sure that if I were to try and warn the younger generations about the malaise of stagflation I’d get a hearty round of Ok Boomer.
The point is that the economic growth trend may not matter as much as the dollar trend. The return data on the Fortress model from the 1970s shows robust performance, much better than the 60/40 portfolio. Keep in mind too that the Fortress strategic allocation is an all US portfolio and international stocks outperformed US stocks in the 70s.
The dollar trend obviously affects your returns directly. If you own European stocks and the Euro rises versus the dollar, the return from the currency adds to the return from your stocks. But it also has economic effects as well which shouldn’t be underestimated. Capital still flows pretty freely in today’s world and there is no surer way to attract capital than to have an appreciating currency. And where capital flows, so does growth, although some would probably say that’s backward (JET, I’m looking at you). I have some thoughts on that but it really doesn’t matter from the investor’s viewpoint. What matters is that capital and growth go together.
The economic environment today is weak dollar and rising growth (subject to very rapid change). The acceleration to the upside (second derivative) of the economic recovery is weakening but the trend is still toward improvement, however slight. We don’t know how long this period will last so the tactical positions here are, by definition, short-term. If we learn nothing else from the virus crisis it should be that things can change in a hurry.
Full story here Are you the author?Tags:


