


| The dollar remains under pressure, due in large part to the Fed’s aggressive efforts to inject stimulus. We see dollar weakness persisting near-term. From a longer-term perspective, we note that the greenback remains largely rangebound and is unlikely to fall below its 2018 lows. |
Dollar Index, 2015-2020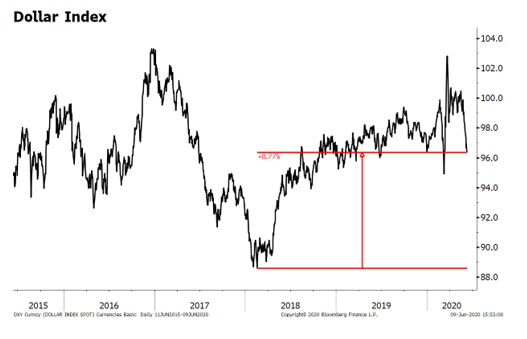 - Click to enlarge |
| RECENT DEVELOPMENTS
There is a growing debate as to the root causes of recent dollar weakness. Is it the burgeoning national debt? The poor US economic outlook? Political risk from widespread social unrest here in the US? Improved risk appetite and less of safe-haven dollar bid? All of these (and perhaps more) have likely contributed to the dollar’s swoon. Being old-fashioned as we are, however, we believe that relative monetary policy stances are still the major driver of currency movements. One glance at the balance sheets of the Fed, ECB, and the BOJ tells us all we need to know about the relative magnitude of their actions. The Fed’s balance sheet has grown 70% since the end of February vs. 18% for the ECB and 8% for the BOJ. Simply put, the Fed has been much more aggressive with its QE than any of its counterparts. We believe that has been the main weight on the greenback this year. As we saw during the financial crisis, the Fed was similarly aggressive, and the dollar came under pressure in the initial stages of QE. Once other central banks played catchup, the dollar recovered. This dynamic may play out again this time. The ECB has expanded its QE already and is likely to do so again this fall. Similarly, the BOE is likely to expand its QE at its next policy meeting June 18 and will likely increase it again in the fall as well. |
Balance Sheets, USD Trln, 2007-2020 - Click to enlarge |
| DOLLAR OUTLOOK
The Fed announced open-ended asset purchases on Monday March 23. It’s not a coincidence that the dollar peaked the previous Friday, with DXY putting in a cyclical top near 103. Since then, DXY has fallen around 6.5%. The euro bottomed on March 23 near $1.10635 and has since climbed nearly 7%. Sterling has done even better, climbing nearly 12% from its March 20 low near $1.1410. Yet it’s worth noting that despite the recent weakness, the dollar remains largely in trading ranges that have held since early 2017. For DXY, that means a range of 88.253-102.99. This translates into ranges of $1.0635-$1.2555 for the euro, $1.1410-$1.3010 for sterling, and around 105-114 for the yen (netting out the March flash crash to near 101). Believe it or not, current levels are petty much right in center of these ranges. Where do we go from here? Well, the momentum is clearly against the dollar right now and so we expect markets to test the bottom half of these ranges. That would also fit in with our fundamental view that the dollar tends to underperform in the early stages of QE before recovering in the medium-term. We will resist the urge to make any bold calls for a dollar bear market. Rather, the dollar remains rangebound until those 2018 lows are broken. If the dollar does remain under pressure against the majors as we expect, EM currencies should also benefit. |
Euro and Pound vs. Dollar, 2017-2020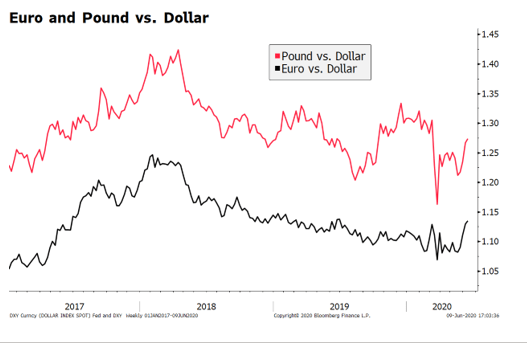 - Click to enlarge |
| A BRIEF HISTORY LESSON
We note the dollar typically does poorly at the onset of each round of QE before recovering. Looking back to the financial crisis, the Fed first started Quantitative Easing (QE) in November 2008 when it announced plans to purchase $600 bln of agency mortgage-backed securities (MBS). DXY fell around 12% over the next month but then recovered to trade even higher by March 2009. QE1 was extended in March 2009 with another round of agency MBS purchases worth $750 bln as well as $300 bln worth of longer-dated US Treasuries. DXY fell around 17% over the next eight months but then recovered nearly all its losses by June 2010. In October 2017, the Fed started to shrink its balance sheet by letting maturing debt run off. Previously, the Fed had reinvested maturing debt back into new paper. The balance sheet shrunk at an average of $32 bln per month until August 2019 bringing the overall size down from $4.46 trln to $3.76 trln. At that point, growing turmoil in the repo markets signaled that the balance shrinkage had gone too far. In September 2019, the Fed began asset purchases again but took pains to emphasize that this was not QE. We believe that at that time, the relative growth rates of the Fed’s balance sheet became a factor behind dollar weakness. That has continued with the Fed’s aggressive moves this year that has nearly doubled the balance sheet to $7.1 trln at the end of May (and counting). |
DXY and Selected Fed Moves, 2008-2020 - Click to enlarge |
Full story here Are you the author?
Tags: Articles,developed markets,Emerging Markets,newsletter


