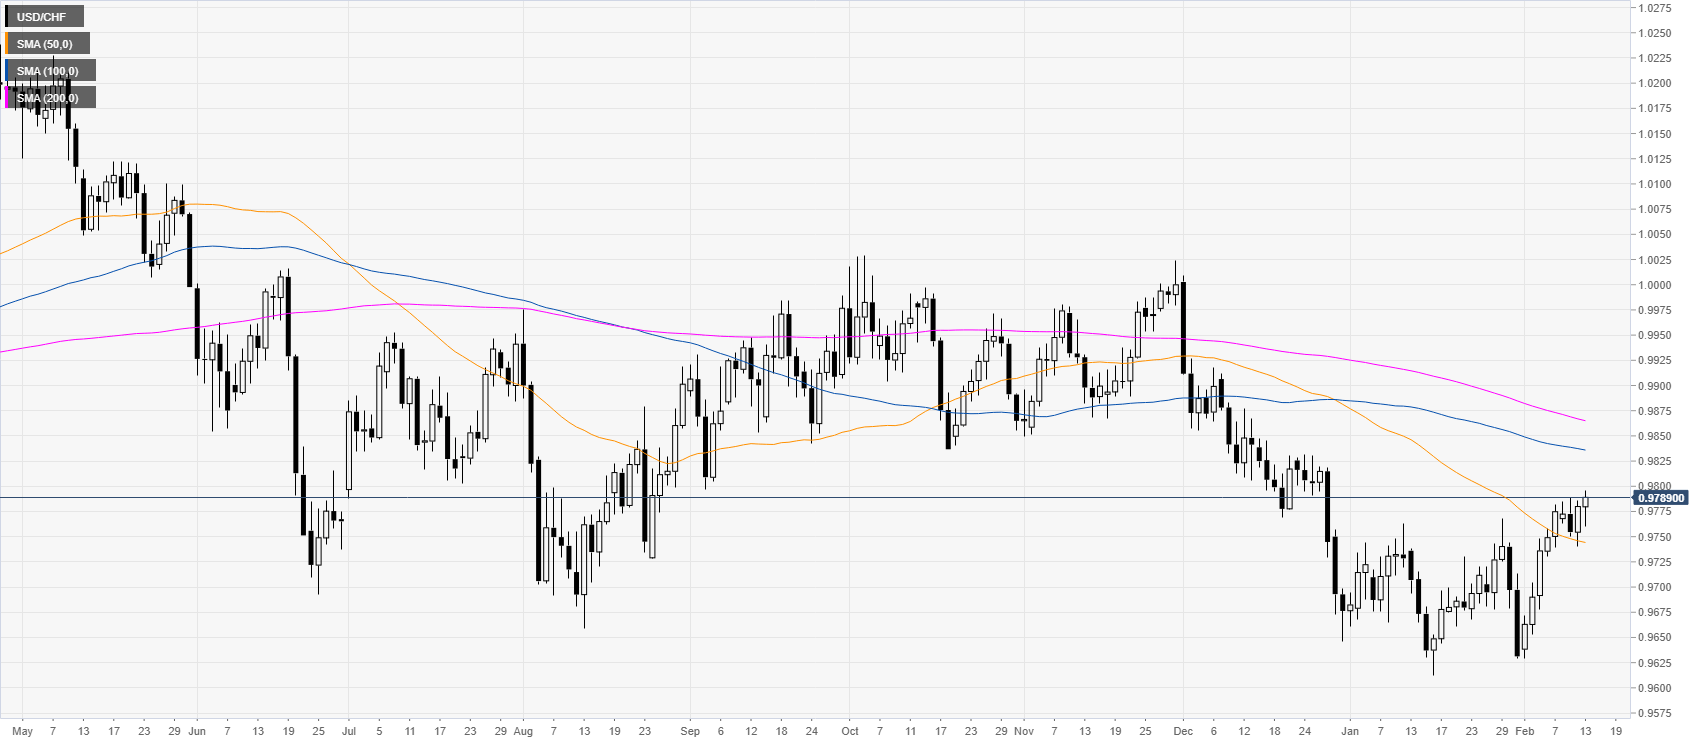
USD/CHF daily chartUSD/CHF is printing new 2020 highs while the quote is trading below the 100/200-day simple moving averages suggesting an overall bearish momentum. |
USD/CHF daily chart(see more posts on USD/CHF, ) |
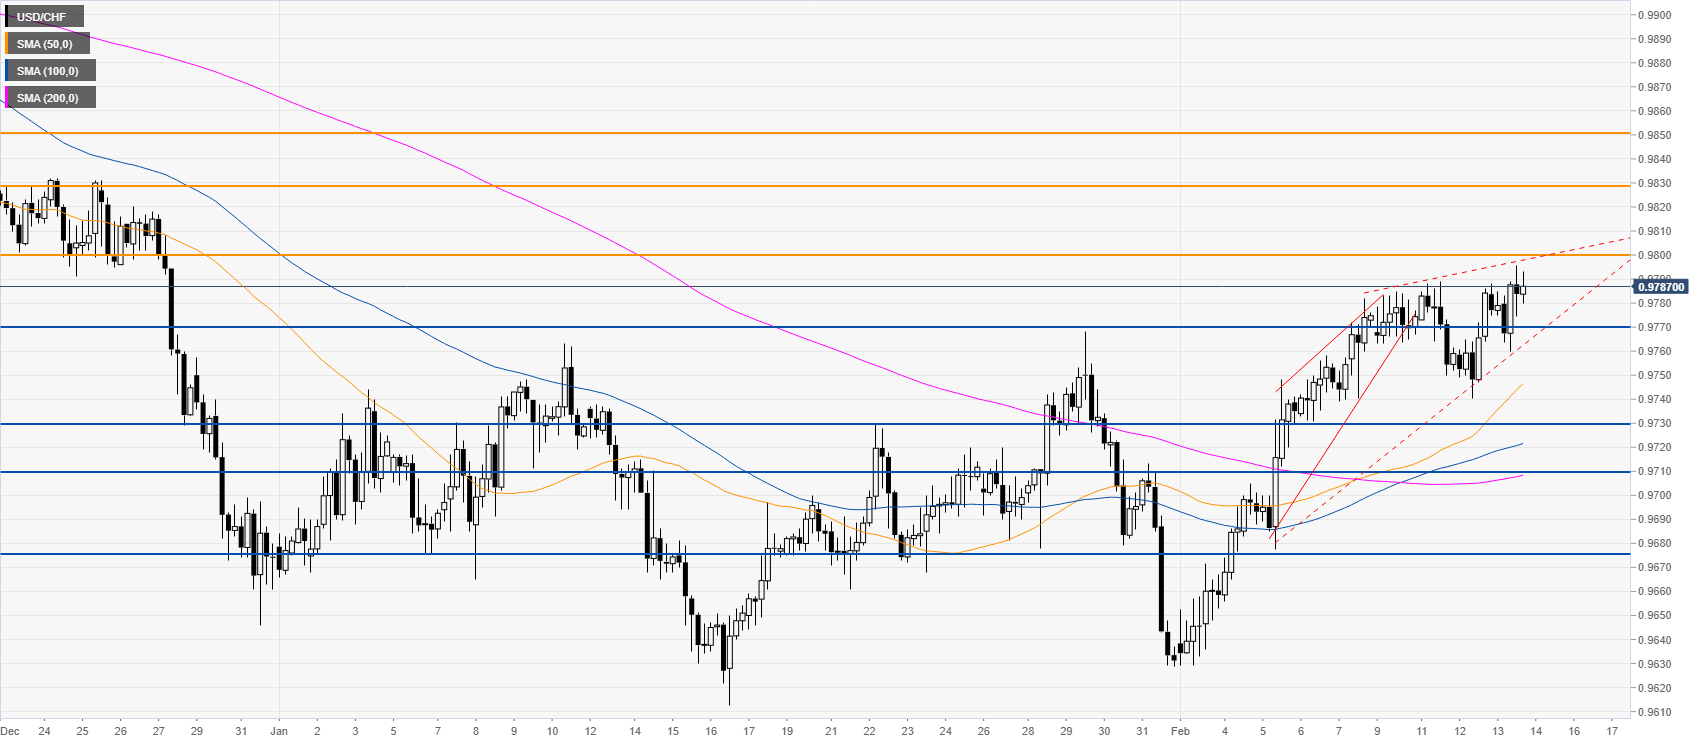
USD/CHF four-hour chartAfter USD/CHF broke below the rising wedge pattern the market made a retest of the high creating a higher high by a few pips just below the 0.9800 figure. The spot is also trading within a larger rising wedge pattern which can be seen as potentially bearish if the bears start to show some signs of conviction. In fact, bears want to weaken the market and trade below the 0.9770 level to drive the quote below the last swing low towards the 0.9730 and 0.9710 price levels. However, a daily break above the 0.9800 figure might invalidate the bearish scenario and lead to an acceleration towards the 0.9830 and 0.9850 price levels. |
USD/CHF four-hour chart(see more posts on USD/CHF, ) |
Resistance: 0.9800, 0.9830, 0.9850
Support: 0.9770, 0.9730, 0.9710
Full story here Are you the author? Previous post See more for Next post
Tags: newsletter,USD/CHF


