


- EM FX has rallied sharply in recent weeks, helped by growing optimism that we’ve seen the worst of the US-China trade war
- Given our more constructive outlook on EM, we believe MSCI EM FX should eventually test the 1657.50 high from July
- We see continued divergences within the asset class
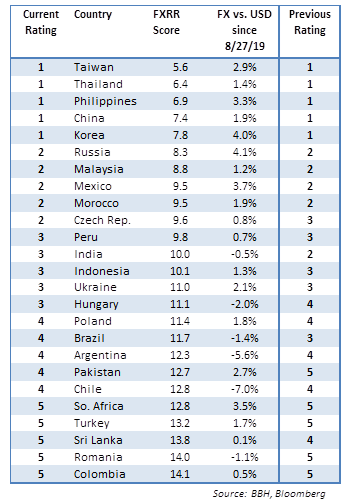
- Our 1-rated (strongest fundamentals) grouping for Q4 2019 consists of TWD, THB, PHP, CNY, and KRW
- Our 5-rated (weakest fundamentals) grouping for Q4 2019 consists of ZAR, TRY, LKR, RON, and COP
- Our next EM FX model update for Q1 2020 will come out in January
EM FX OUTLOOK
EM FX has rallied sharply in recent weeks, helped by growing optimism that we’ve seen the worst of the US-China trade war. MSCI EM FX basically retraced the entire sell-off resulting from President Trump’s escalation of the trade war with China in early August but ran out of steam in early November as doubts about a Phase One deal crept into the markets.
MSCI EM FX rallied nearly 4% from the September 3 low to the November 5 peak. It has since given up a quarter of those gains. The 200-day moving average near 1631 should provide some near-term support. Looking further out, we remain confident that a Phase One deal will be struck in the coming weeks. This should give renewed fuel for the rally in EM FX.
Given our more constructive outlook on EM, we believe MSCI EM FX should eventually test the 1657.50 high from July. That basically matches the January and March highs. A break of this triple top would be significant and could open up a larger move toward the June 2018 high near 1678 and then May 2018 highs near 1695 and 1701.
Despite the recent rally, most EM currencies are still weaker against the dollar so far in 2019. The worst performers YTD are the high beta group ARS, CLP, TRY, HUF, and BRL. On the other hand, the best performers include RUB, THB, PHP, IDR, and MXN. The main point we are making is that investors must be choosy within EM. Why?
We see continued divergences within the asset class. On top of idiosyncratic political risk, we also believe it is very important for investors to continue focusing on country-specific fundamentals. Hedging out currency risk has become much more important because we strongly believe that this current dollar rally has legs.
| SUMMARY
Our EM FX model is meant to assist global investors in assessing relative FX risk across countries in the EM universe. A country’s score reflects the relative fundamentals. This in turn should tell us something about the likelihood that its currency will outperform the rest of our EM universe over the next three months. With global financial markets likely to remain volatile, we continue to recommend focusing on fundamentals as opposed to high carry. Our 1-rated (strongest fundamentals) grouping for Q4 2019 consists of TWD, THB, PHP, CNY, and KRW. This is the same group as the previous quarter. Note that six of the ten top currency picks for Q4 2019 are in Asia. This grouping lines up with our long-held view that Asia is best-placed fundamentally in the current environment. Three of the top ten are from EMEA (CZK, MAD, and RUB), while MXN is the lone representative from Latin America. Our 5-rated (weakest fundamentals) grouping for Q4 2019 consists of ZAR, TRY, LKR, RON, and COP. PKR improved from 5 to 4, which pushed LKR down from 4 to 5. Note that four of the worst ten currency picks for Q4 2019 are in EMEA, four are in Latin America, and two are in Asia. There were other notable movements. CZK improved from 3 to 2, which pushed INR down from 2 to 3. Lastly, HUF improved from 4 to 3, which pushed BRL down from 3 to 4. Our next EM FX model update for Q1 2020 will come out in January. However, we will provide monthly performance updates throughout Q4. |
 . |
MODEL PERFORMANCE
Since our model was last updated on August 27, virtually every EM currency has strengthened. During this time, those currencies with VERY STRONG (1) fundamentals have gained an average of 2.7%, while those with STRONG (2) fundamentals have gained an average of 2.1%. This compares to an average loss of -2.6% during the same period for those with WEAK (4) fundamentals and an average gain of 1.5% for those with VERY WEAK (5) fundamentals. Lastly, an average gain of 0.7% was posted by those with NEUTRAL (3) fundamentals.
For this past quarter, currency performances have largely reflected underlying fundamentals. Still, we note that there were outliers in many groups. Of note, relatively strong performances for ZAR (3.5%) and TRY (1.7%) boosted the performance of the 5 group. Other than that, our model worked quite well in identifying the strong and weak links in the EM chain this past quarter.
MODEL DESCRIPTION
Our FX model covers 25 countries, with each country’s score determined by a weighted composite ranking of 15 economic indicators that are each ranked against the rest of our model EM universe for each category. Categories are external debt/GDP, real interest rates, short-term debt/reserves, import cover, external debt/exports, current account/GDP, export growth, GDP growth, nominal M3 growth, budget deficit/GDP, inflation, percentage deviation of the spot rate from Purchasing Power Parity (PPP), political risk, and banking sector risk. We have replaced FDI/GDP with a country’s Net International Investment Position (NIIP/GDP). A country that is typically ranked first in many of the categories will end up with a low composite score (the lower the score, the better the fundamentals).
The 10 countries that are at the top of our table have VERY STRONG (rated 1) or STRONG (rated 2) fundamentals relative to our EM universe, while the 10 at the bottom have WEAK (rated 4) or VERY WEAK (rated 5) fundamentals. Those five in the middle have NEUTRAL (rated 3) fundamentals. These scores do not imply a greater return for those countries with a higher ranking. Rather, our models simply seek to identify those currencies that are backed up by better underlying fundamentals compared to their EM peers. We stress that the composite rankings contained in this model are a relative measure, not an absolute one.
Furthermore, we are making no assertions about the actual currency returns to investors, as that will involve differences in yield across all the currencies. We are simply identifying which currencies have strong fundamentals and which have weak fundamentals.
We have tweaked our models to better conform with MSCI methodology. We have moved SGD and ILS to our new DM FX model and eliminated EGP from this EM FX model due to its pegged nature. Replacing them in this EM FX model are UAH, MAD, and PKR.
Full story here Are you the author?Tags: Articles,Emerging Markets,newsletter


