


| The FOMC begins a two-day meeting today with the decision due out tomorrow afternoon. The Fed is widely expected to cut rates 25 bp for the third meeting in a row. What’s next?
RECENT DEVELOPMENTS US data have undeniably softened in September. Weakness in the manufacturing sector appears to have spread to the wider economy. ISM PMI, jobs, CPI, PPI, and retail sales all came in weaker than expected. So too have inflation expectations. October data is just starting to trickle out this week and so far, has been mixed. ADP jobs will be reported tomorrow, and October Chicago PMI will be reported Thursday. Friday sees October ISM manufacturing PMI, jobs data, and auto sales. As such, we should then have a much better idea of whether the slowdown is intensifying as we enter Q4. The Fed is widely expected to cut rates 25 bp for a third time in a row. While we had been on the fence about a cut, recent softness in the data has pushed us into the cut camp. We believe the Fed will deliver a hawkish cut. That is, it cuts rates 25 bp but the accompanying language will most likely imply that no further cuts will be seen until new information emerges. The Fed will certainly leave the door open to more easing if circumstances dictate, but we do not think it wants to encourage any notions of another cut at the December 11 FOMC meeting. Since there are no new staff forecasts nor Dot Plots, the statement and press conference will be key in shaping market expectations going forward. After Powell’s press conference, Fed speakers will fan out and Kaplan, Clarida, Quarles, Daly, and Williams all speak Friday. In that regard, the Dot Plots are as worthless as ever. The June Dot Plot suggested no cuts in 2019 and then the Fed went ahead and cut in both July and September. The September Dot Plot suggests no more cuts in 2019 and yet the Fed is poised to cut tomorrow. It also suggests tightening will be seen over the course of 2021. The next Dot Plot update will be at the December meeting and for what it’s worth, we expect it to suggest no cuts in 2020 with potential for tightening in 2021. |
Fed Funds Dot Plots, 2019-2022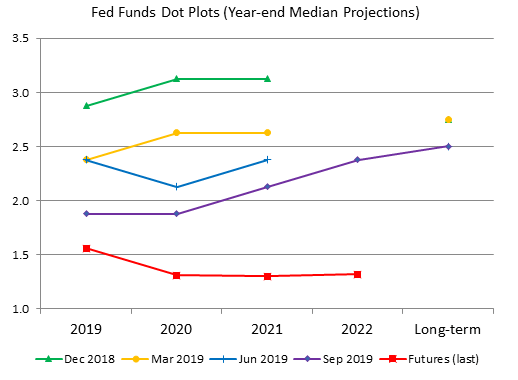 Source: Bloomberg - Click to enlarge |
| The Fed Funds futures strip is pricing in very low odds of another 25 bp cut in December. Looking further out, the implied yield on the January 2021 contract is currently 1.30%. This prices in one more 25 bp cut over the course of next year. Steady rates are then seen through 2022. While we disagree with both the Dot Plot and the Fed Funds futures strip, we suspect the latter is closer to the truth than the former.
Fed officials have remained upbeat on the US economic outlook whilst acknowledging building headwinds. We believe that the global tail risks for the US economy have fallen recently, and that the Fed will have to recognize this. The partial US-China trade deal has yet to be hammered out in full, but the risks of further escalation have eased. Elsewhere, the risks of a hard Brexit have fallen significantly after the EU agreed to an extension beyond October 31. We believe these recent global developments take pressure off the Fed to ease any further after this week’s cut. These are the tail risks that have bothered the Fed and they appear to be slimming. As a result, the US yield curve has turned positive again. At +25 bp, it is the steepest since March 5. Did we dodge a bullet? Markets are likely to remain on US recession watch, but we look at past curve inversions to conclude that we may avoid recession in 2020. Please see our recent piece “What is the US Yield Curve Telling Us?” for an in-depth discussion about the US yield curve. A BRIEF HISTORY LESSON Before the current “mid-cycle adjustment,” the Fed had made two similar moves in the 1990s. After hiking the Fed Funds rate from 3% to 6% over the course of 1994 and 1995, the Fed then turned around and cut rates three times over the course of 1995 and 1996 for a total of 75 bp to 5.25%. GDP growth (SAAR) had slowed from 4.7% in Q4 1994 to 1.4% in Q1 1995 and 1.2% in Q2 1995. As such, the Fed was clearly acting to offset this slowdown. Growth then picked up to 3.5% in Q3 1995 and 2.7% in Q4 1995. The Fed kept rates there until March 1997, when it hiked rates 25 bp to 5.5%. Rates stayed at 5.5% until September 1998, when the Fed cut rates again by 25 bp back to 5.25% and then followed up with two more back-to-back cuts to 4.75%. Why? Growth remained strong in 1996 and 1997, but the Fed had become increasingly worried about the potential fallout from the Asian crisis that fed into Russia’s default and then the collapse of Long-Term Capital Management. In the minutes to the September 1998 FOMC meeting, the Fed noted “The intensification and further spread of turmoil in international financial markets, notably since the outbreak of a financial crisis in Russia in mid-August, had spilled over into U.S. financial markets.” |
Fed Funds Rate, 1990-2015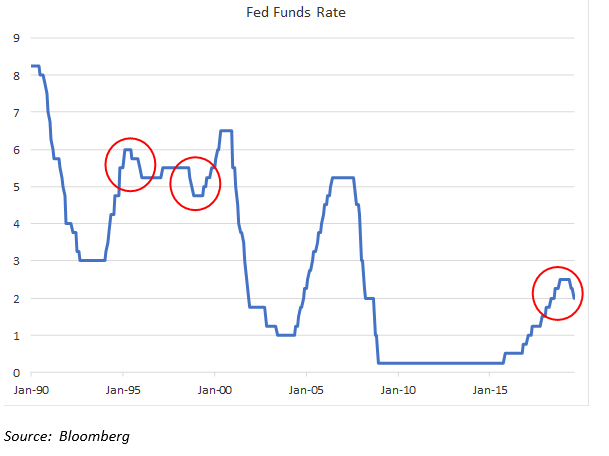 Source: Bloomberg - Click to enlarge |
| ECONOMIC OUTLOOK
The Chicago Fed National Activity Index remains the best indicator of US recession risk and it just came in worse than expected at -0.45 for September. That reading is the worst since April and drags the 3-month average down to -0.24 from -0.05 in August. This is not yet near the -0.7 recession threshold but it’s the first deterioration in CFNAI-MA3 since April and this trend bears watching. Note that CFNAI-MA3 fell to a low of -0.5 in April before rebounding. A value of zero shows an economy growing at trend. Positive values represent above trend growth, while negative values represent below trend growth. |
Chicago Fed National Activity Index, 2012-2019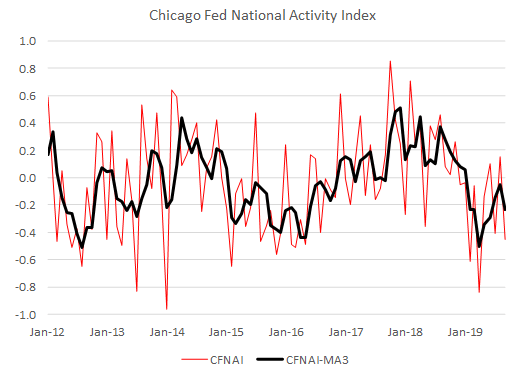 Source: Bloomberg - Click to enlarge |
| Despite some likely slowing in Q4, we believe the US economic outlook remains solid. Advance Q3 GDP data will be reported tomorrow, and Bloomberg consensus is at 1.6% SAAR vs. 2.0% in Q2. The Atlanta Fed’s GDPNow model is tracking 1.7% SAAR growth in Q3 vs. 1.8% previously, while the NY Fed’s Nowcast model is tracking 1.9% SAAR growth in Q3. All are still near trend (~2%). However, the Nowcast forecast for Q4 growth is tracking only 0.9% SAAR. If that were to hold true, this would be the slowest growth since Q4 2015. Yet some headwinds have eased, including a thaw in US-China trade tensions and the end of the GM autoworkers strike after forty days. As such, we think the early slowdown in Q4 is exaggerated.
The IMF forecasts US growth at 2.4% this year, 2.1% next year, and 1.8% in 2021. Clearly, the 2.9% growth posted in 2018 was unsustainable and due in large part to the one-time stimulus from the tax cuts. Similarly, the Congressional Budget Office (CBO) forecasts US growth at 2.6% this year, 2.1% next year, and 1.8% in 2021. The NY Fed has a recession probability model that’s based on the US yield curve. It is updated monthly and the latest reading for September fell back to 34.80% from the high of 37.93% in August. That was the highest since March 2008 and so the subsequent drop is welcome. Curve inversion has ended, and the slope has averaged +5 bp so far in October vs. -23 bp in September and -35 bp in August. As such, this should lead to a significant reduction in the recession probability for this month. |
US GDP Growth, 2012-2018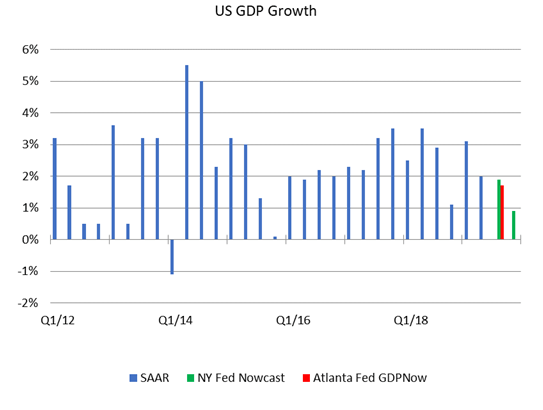 Source: Bloomberg - Click to enlarge |
INVESTMENT OUTLOOK
Bottom line: We continue to downplay US recession fears for the time being. Some of the recent high frequency US economic data have weakened, but our favorite indicator CFNAI says otherwise. We believe that markets are still overestimating the downside risks to the US. While much depends on the economic performance in H2 2019 and H1 2020, we think continued solid economic growth means US rates are unlikely to fall as much as markets are expecting. This is both dollar-positive and equity-positive. On the other hand, it is bond-negative as we see increasing likelihood of a larger move to the upside for yields at the long end. A bearish steepening is under way now and we believe that will continue.
Of course, this is all predicated on a continued economic expansion in the US. If the facts change and the economy slows sharply or goes into recession, then the Fed will have no choice but to adjust its expected rate path. But for now, the economy can cope with steady rates in December and beyond.
Full story here Are you the author?Tags: Articles,developed markets,newsletter


