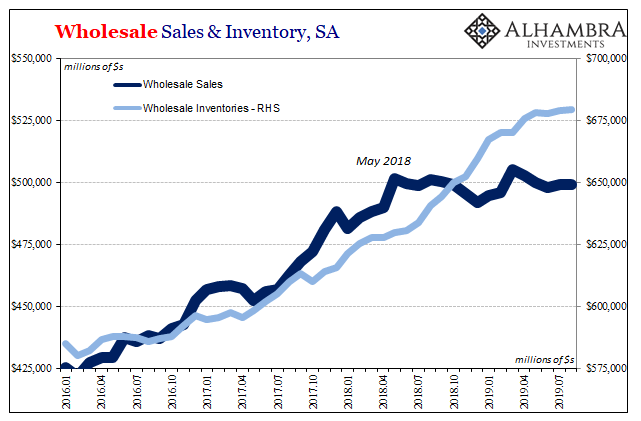
| It’s not surprising that the Census Bureau would report another weird sideways trend in wholesale sales. After all, the agency has already produced that kind of pattern in the related data for durable goods. For reasons that aren’t going to be explained, economic activity across the supply chain from producers to consumers has been curtailed. That hasn’t mean outright shrinking in seasonally adjusted forms, but it also doesn’t mean growth, either.
I’m guessing there will be less sideways once the next benchmark revision is released next year. Until then, we have the data we have. And according to that data, wholesalers are running out of patience. |
Wholesale Sales & Inventory, SA 2016-2019 |
| Today the Census Bureau reported its advanced figures for the inventory side of wholesale trade. More complete estimates along with preliminary calculations for wholesale sales will be published early next month.
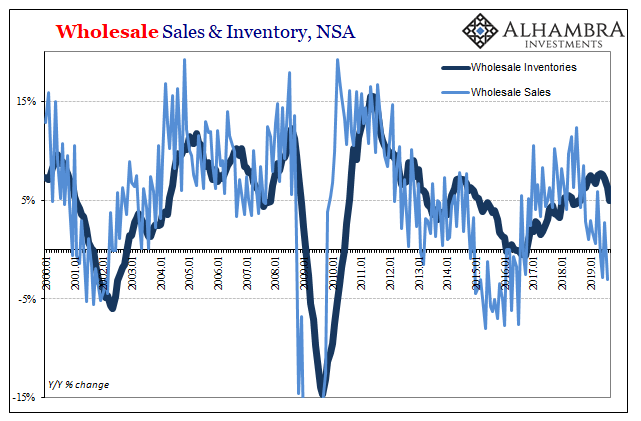
For the month of September 2019, early estimates suggest wholesale inventory decelerated a little more. Year-over-year, inventories being held at this key part of the supply chain increased just 5.0%. Earlier this year, inventories had been advancing by nearly 8%. As you can see below, the early stages of a more complete unwind are showing up. A change in inventory trajectory without one in underlying wholesale sales can only mean one thing – lower levels of production. |
Wholesale Sales & Inventory, NSA 2000-2019 |
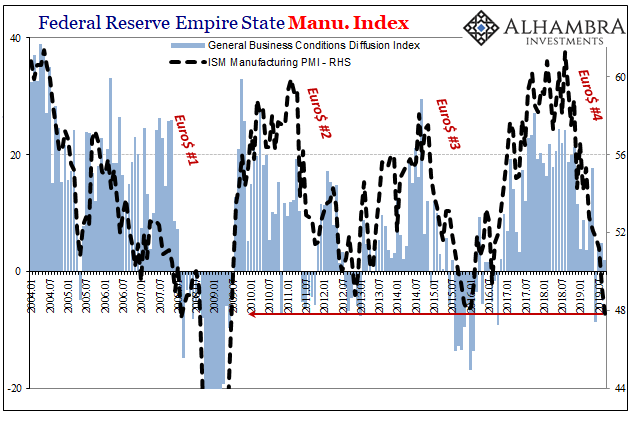
| It matches the sentiment numbers published by either IHS Markit or the ISM, both sets indicating that’s already taking hold across the manufacturing sector.
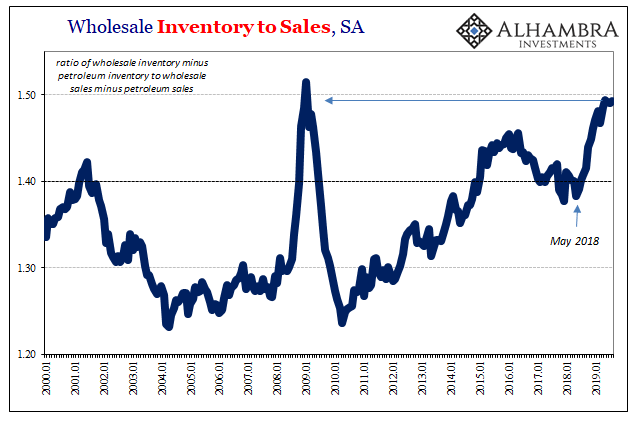
Having waited all year for claims of the strong economy to prove fruitful (the unemployment rate view), it doesn’t seem as if wholesalers are willing to wait much longer. With wholesale sales beginning to fall more sharply, in annual comparisons, and the risks of that happening in more widespread fashion picking up the longer they go without growth, there really wasn’t any other option. Either the economy really does materially pick up, or more negative pressures would have to emerge. The cyclical desire to match inventory with sales via reduced production is the stuff of more typical recession. |
Wholesale Inventory to Sales, SA 2000-2019 |
| It does not mean there is one right now, or one very close to now, what it does suggest is that those kinds of trends which could lean in that direction are no longer just risks. They are emerging in more material fashion.
What that proposes about the current state of affairs is more and more of the wrong type of circumstances than you would expect to find in an otherwise strong (very?) economy supported by an epic, 50-year tight labor market. More data leaning further in the wrong direction. |
Federal Reserve Empire State Manu. Index, 2004-2019 |
| For policymakers counting on rate cuts acting as minor support, this mid-cycle adjustment they keep talking about, this is not what they want to see. They are, in fact, counting on those sales to accelerate again so as to avoid what’s showing up now in terms of inventories and new order levels for production. The longer it goes without sales, the more we’ll continue to see those latter modifications – while raising the stakes for a much larger one.
This isn’t the kind of data consistent with the endpoint; the idea that a “soft patch” and nothing more has developed and is in the process of dissipating. It is instead far more consistent with the idea of the midpoint. As is usual in these cases, these eurodollar-driven economic squeezes, the midpoint develops out of more narrative than hard data. Maybe the central bank counterreaction will work – if given enough time. |
Benchmark 10-year UST, 2018-2020 |
| Meanwhile, there isn’t much actual evidence for that view and as more time passes and it doesn’t materialize the more likely the downturn develops its second, more consequential stage.
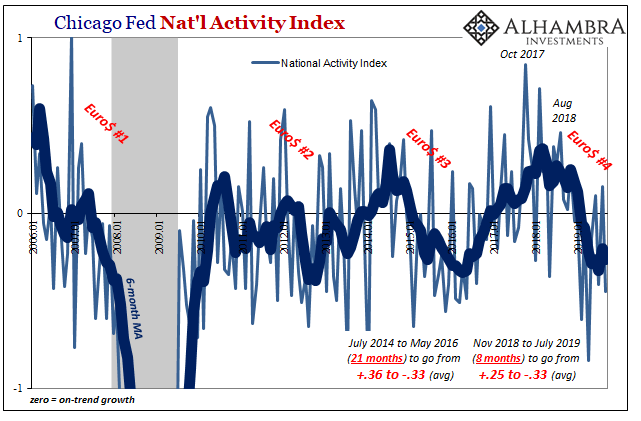
The Census Bureau isn’t the only suite of figures which indicates continuing negative pressures. Even the Fed’s Chicago branch today reported another disappointing estimate in its National Activity Index (NAI). For the month of September, the preliminary number was another hefty decline, -0.45, following two out of the prior three months slightly on the plus side. |
Chicago Fed Nat'l Activity Index, 2006-2019 |
Like the mid-cycle adjustment narrative, there was some hope (more than anything) that with a couple of recent positives in what is supposed to be a more leading indicator the series was beginning to bottom and propose that economic turnaround. Sales growth looming.
But with the latest number dropping down to levels more consistent with the bottom of each of the past two downturns (Euro$ #3 and #2), it’s another blow that along with the wholesale figures continue to suggest stubborn weakness not going away anytime soon.
For wholesalers, that’s going to be increasingly a more immediate problem. While an NAI estimate of -0.45 certainly doesn’t equate to full-blown recession, it also doesn’t propose any material change in the economy from what is already a significant downturn (-0.45 literally means substantially below trend economic growth; whether it is accurate or anything beyond monthly noise, that’s another matter).
Taken together, the risks to the economy not only remain tilted to the downside they are coming closer and closer to possible tipping points.
In the context of today’s discussion:
The amount of time doesn’t matter for the midpoint. These eurodollar squeezes take an enormous amount of it to get where they are ultimately going. While central bankers and Economists will talk about the end, as they always do, it sure seems, to me, like another episode of somewhere in the middle.
That middle keeps tilting more toward 2009 than 2015 or 2012. Unless the NAI is putting in its bottom and therefore wholesale sales are about to jump sooner rather than later, we’re already at 2015 and 2012 with that whole second phase possibly standing before us.
Then again, maybe Jay Powell really does know what he’s doing. If he does, he better produce some results quick because wholesalers, at least, appear significantly less willing to cut him and the economy as much slack.
Full story here Are you the author? Previous post See more for Next post
Tags: currencies,economy,Federal Reserve/Monetary Policy,Markets,newsletter,wholesale inventory,wholesale sales


