We recently introduced our Developed Markets (DM) Equity Allocation model. Building on the success of our EM model, this new framework extends our analysis to cover 24 DM equity markets. Our analysis is meant to assist global equity investors in assessing relative sovereign risk and optimal asset allocation across countries within the DM universe.
DM EQUITY OUTLOOK
Global equity markets have come under pressure in recent weeks as the US-China trade war intensified. Given the latest flare-up, we do not expect a trade deal until 2020 at the earliest. We remain very concerned about the global headwinds and do not believe that the liquidity story is enough to offset the downside risks to growth.
Market expectations for aggressive Fed easing have helped support global equity markets. Fed Funds futures are still pricing in nearly 75 bp of cuts this year and 50 bp more next year. We remain constructive on the US outlook and so we think markets are likely to be disappointed by the Fed this week.
MSCI World peaked near 2221 on July 25. Since then, MSCI World has fallen nearly 4%. The next downside target is the June 3 low near 2040, but the 200-day moving average near 2080 lent some support during last week’s slide. Looking further back, MSCI World has retraced about 25% of this year’s rally. The major retracement objectives for this move come in near 2078 (38%), 2034 (50%), and 1990 (62%).
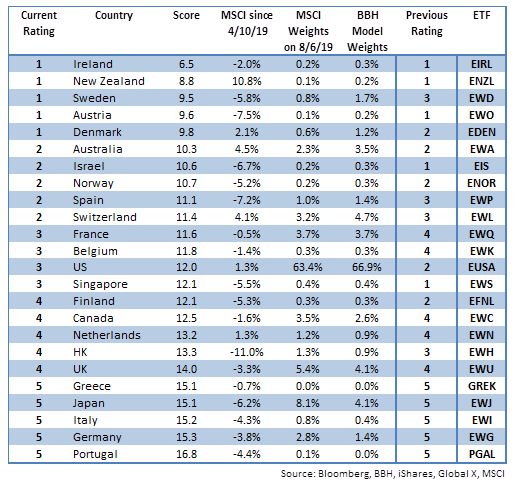
MSCI World is still up 14.6% YTD. This compares to 3.2% YTD for MSCI EM. It’s worth noting that the correlation between EM and DM stocks is currently 0.62. Whilst below this month’s peak near .68, it is above the low around 0.58 at the start of this year. Within DM, the best performers YTD have been Switzerland, New Zealand, and the Netherlands, while the worst have been Japan, Israel, and Norway.
We believe it is very important for investors to continue focusing on country fundamentals. Hedging out currency risk will become more important for US investors if the strong dollar trend resumes. Furthermore, we continue to look for potential divergences within DM. Regionally, North America is the best equity performer so far in 2019 (17.7% YTD), followed by Europe (13.3% YTD) and the Pacific (6.2%).
Our 1-rated grouping (outperformers) for Q3 2019 consists of Ireland, New Zealand, Sweden, Austria, and Denmark. Sweden and Denmark both improved to 1, helping to push Israel down from 1 to 2. Spain and Switzerland improved from 3 to 2, helping to push the US and Singapore down to 3. We note that of the top 10 countries, 7 are in Europe, 2 are in Asia, and 1 is in the Middle East.
Our 5-rated grouping (underperformers) for Q3 2019 consists of Greece, Japan, Italy, Germany, and Portugal. This is the same group as last quarter. We note that of the bottom 10 countries, 7 are in Europe, 2 are in Asia, and 1 is in North America.
There were several more notable movements. France and Belgium both improved from 4 to 3. Finland dropped from 2 to 4, while Hong Kong dropped a second straight quarter, this time from 3 to 4.
| MODEL PERFORMANCE
Since our last update on April 10, our proprietary DM equity portfolio has risen 0.2%, outperforming MSCI World (-0.6%). Overweighting the US, Australia, New Zealand, and Denmark helped our return as these markets outperformed. Underweighting Japan, Germany, Canada, and the UK helped our return as these markets underperformed. What calls hurt our model return? Overweighting Singapore and Finland hurt our return as these markets underperformed, albeit with relatively small weights. Elsewhere, underweighting France and the Netherlands hurt our return as these markets outperformed with relatively large weights. |
 . |
MODEL DESCRIPTION
Our equity allocation model is meant to assist global equity investors in assessing relative sovereign risk and optimal asset allocation across countries in the DM universe. The countries covered include all 23 of the countries in the MSCI World Index. We have also included Greece in this model. Even though MSCI puts the nation in MSCI EM, we continue to view it as DM.
A country’s score reflects its relative attractiveness for equity investors – the likelihood that its equity market will outperform the rest of our DM universe over the next three months. A country’s score is determined as a weighted composite of 15 economic and political indicators that are each ranked against the other 23 countries in our model DM universe. Categories are industrial production growth, real interest rates, export growth, expected P/E ratio, real bank lending, yield curve steepness, real money growth, GDP growth, investment/GDP, per capita GDP, inflation, retail sales, political risk (EIU), leading indicators, and ease of doing business (World Bank). A country that is typically ranked first in many of the categories will end up with a low composite score (the lower the better).
From a portfolio construction standpoint, we are benchmarking to MSCI World. As a result, our BBH model portfolio weights will be Underweight/Overweight compared to the MSCI weights.
- Countries that are rated 1 will have a BBH weight that is 2.00 X MSCI World weight.
- Countries that are rated 2 will have a BBH weight that is 1.50 X MSCI World weight.
- Countries that are rated 3 will have a BBH weight that is equal to MSCI World weight.
- Countries that are rated 4 will have a BBH weight that is 0.75 X MSCI World weight.
- Countries that are rated 5 will have a BBH weight that is 0.50 X MSCI World weight.
To have the BBH model portfolio weights add up to 100%, there may be some exceptions to the rules outlined above. However, we will always try to keep to these parameters as closely as possible.
CHANGE IN METHODOLOGY AND COVERAGE
In the past, we have taken a simple average of each grouping (1 through 5) to determine model performance. That allowed small markets to skew the results. We are now taking a weighted approach, with country returns weighted by the BBH model weightings. Then, we compare our model performance against the benchmark MSCI World.
Full story here Are you the author?Tags: Articles,developed markets,newsletter