Special Guest Trey Reik and Board Member Jim Rickards Discuss Fed PolicyOn occasion of its Q1 meeting in late January, the Incrementum Advisory Board was joined by special guest Trey Reik, the lead portfolio manager of the Sprott Institutional Gold & Precious Metal Strategy at Sprott USA since 2015 [ed note: as always, a PDF of the complete transcript can be downloaded further below]. |
|
| Also at the meeting, Jim Rickards, who is inter alia well known as a Fed watcher. The main topic under review was whether Fed policy is likely to actually change, following the verbal about-face on the part of chairman Powell in late December.
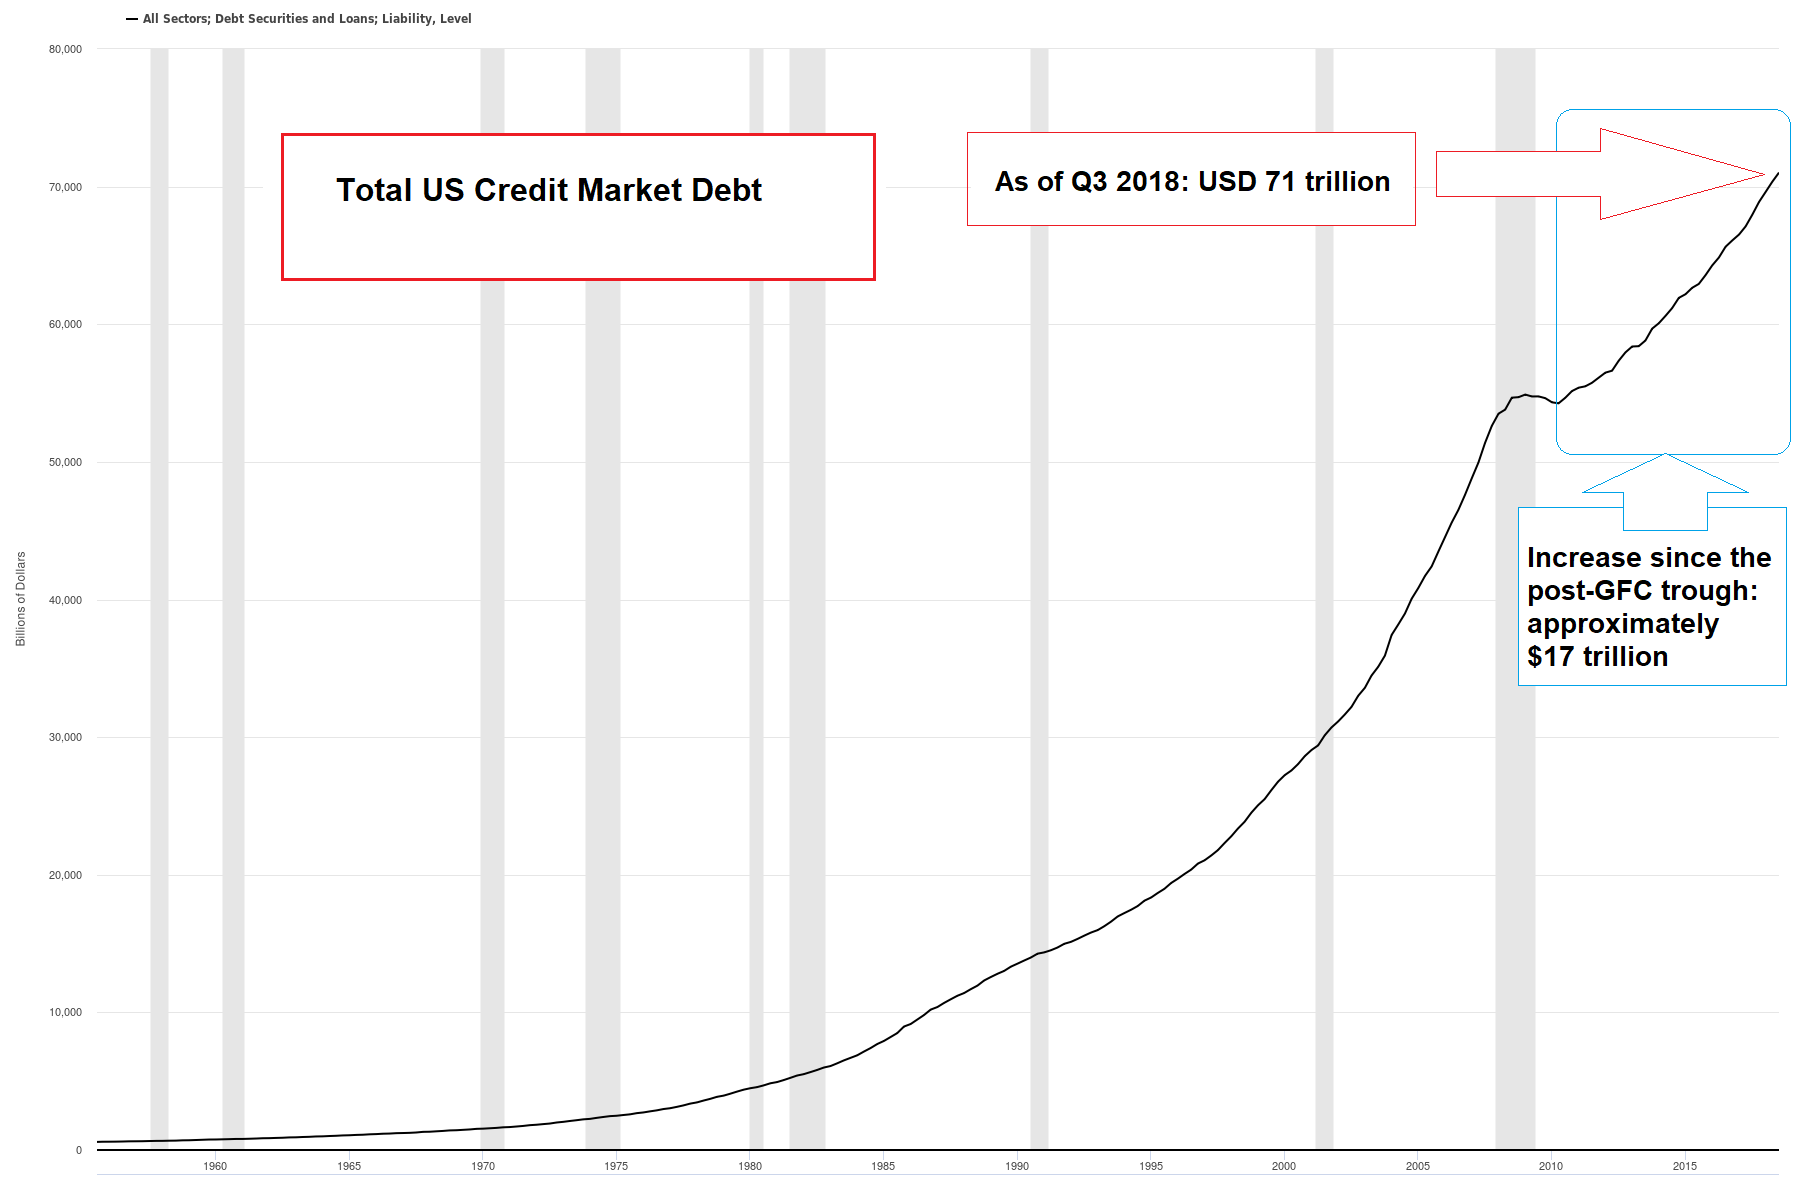
Jim Rickards believes that although a pause in the Fed’s rate hikes is in the offing, it is actually likely that the tightening campaign will resume later this year, barring a major stock market accident. His reasoning remains that the Fed would like to accumulate “ammunition”, so to speak, to be able to cut rates meaningfully when the next economic downturn begins. Trey Rike on the other hand believes that the rate hike campaign to date has already gone as far as it can possibly go. His reasoning: Jerome Powell has realized that the much larger debt mountain that has to be serviced nowadays cannot withstand higher rates without triggering major financial and economic upheaval. |
Total US Credit Market Debt, 1960 - Q1 2019(see more posts on Credit Markets, ) |
| Obviously, both arguments have merit and we would argue that it will probably depend on the stock and bond markets which one of the scenarios will ultimately play out.
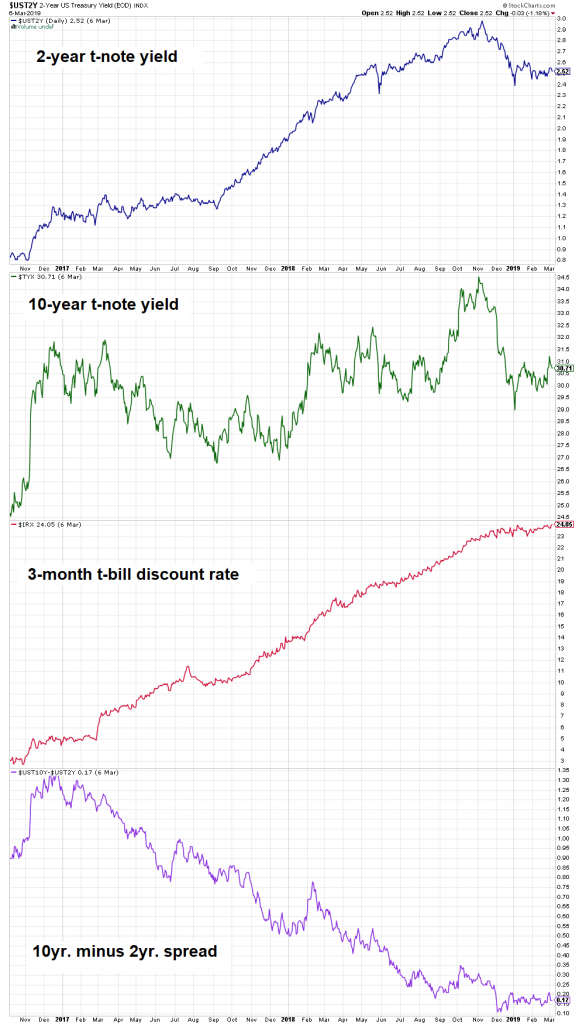
Interestingly, gross market interest rates allow for making both arguments as well. Consider the following charts of the 2-year note, the 10-year note, the 3-month t-bill discount rate and the spread between 10-year and 2-year yields (a proxy for the steepness of the yield curve). 2 and 10-year yields have come down when the stock market sold off late last year, but the t-bill discount rate remained stubbornly high. Moreover, the 2-10 spread remains close to inversion territory. The former two are saying “the boom is long in the tooth”, while the latter two are saying “the boom is still on”. |
US Interest Rates, Nov 2017 - Mar 2019(see more posts on Interest Rate, ) |
| Evidently, Fed members were mainly informed by the sell-off in stocks and the decline in yields on all but the shortest term treasury debt when they decided to announce the Fed’s policy bias u-turn after the December FOMC meeting. On the other hand, the Fed administers overnight lending rates, which are the shortest-term category of rates available. From that perspective we should expect the Fed to follow t-bill yields rather than yields on longer maturities.
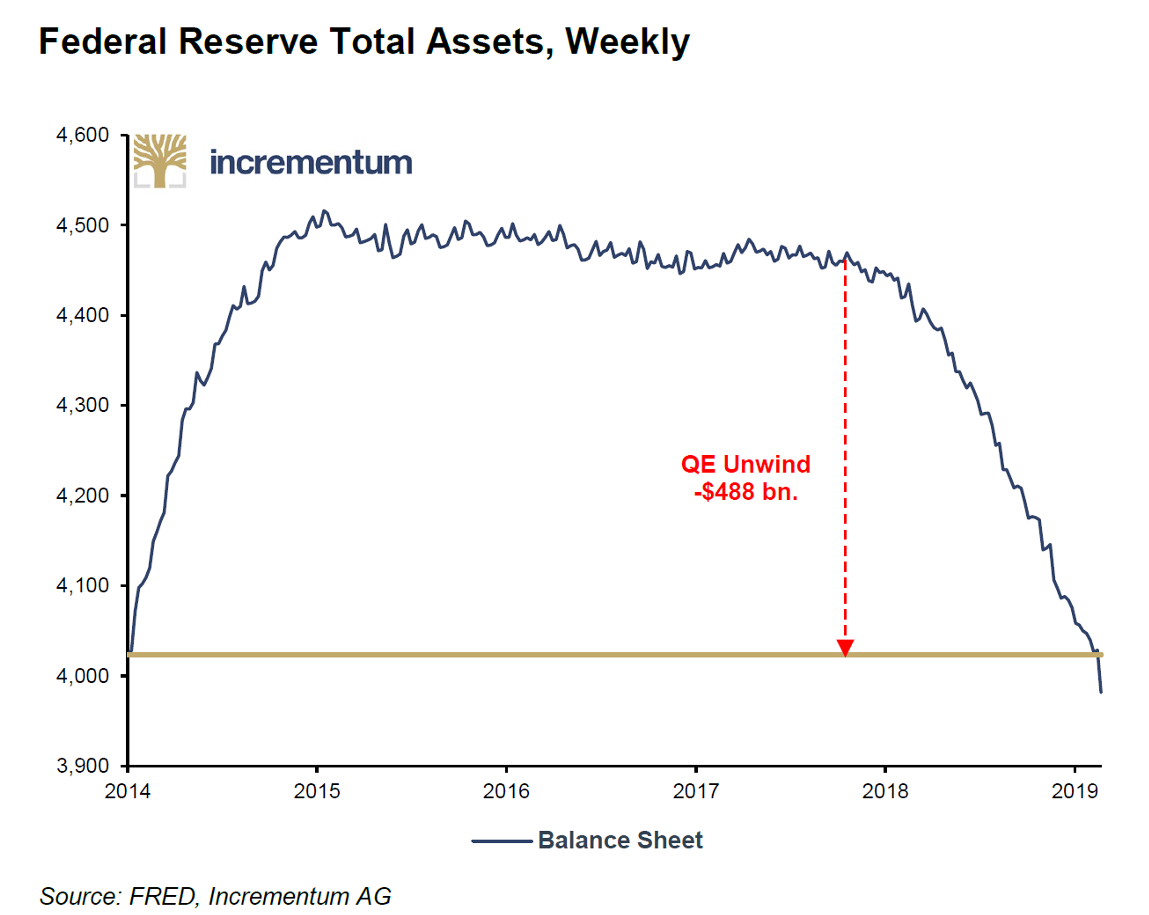
The unwinding of “QE” so far continues unabated, despite the Fed letting it be known that it may halt its balance sheet reduction sooner rather than later. Long time readers may remember that we have always argued that an unwinding of the post QE balance sheet would not go very far, if it was implemented at all. This is because it has a direct impact on money supply growth and we do not believe that the Fed is eager to actually cause an outright contraction of the money supply (this has not happened yet, but is likely to happen fairly soon if “QT” continues at its current pace). |
QE Unwind, 2014 - 2019 |
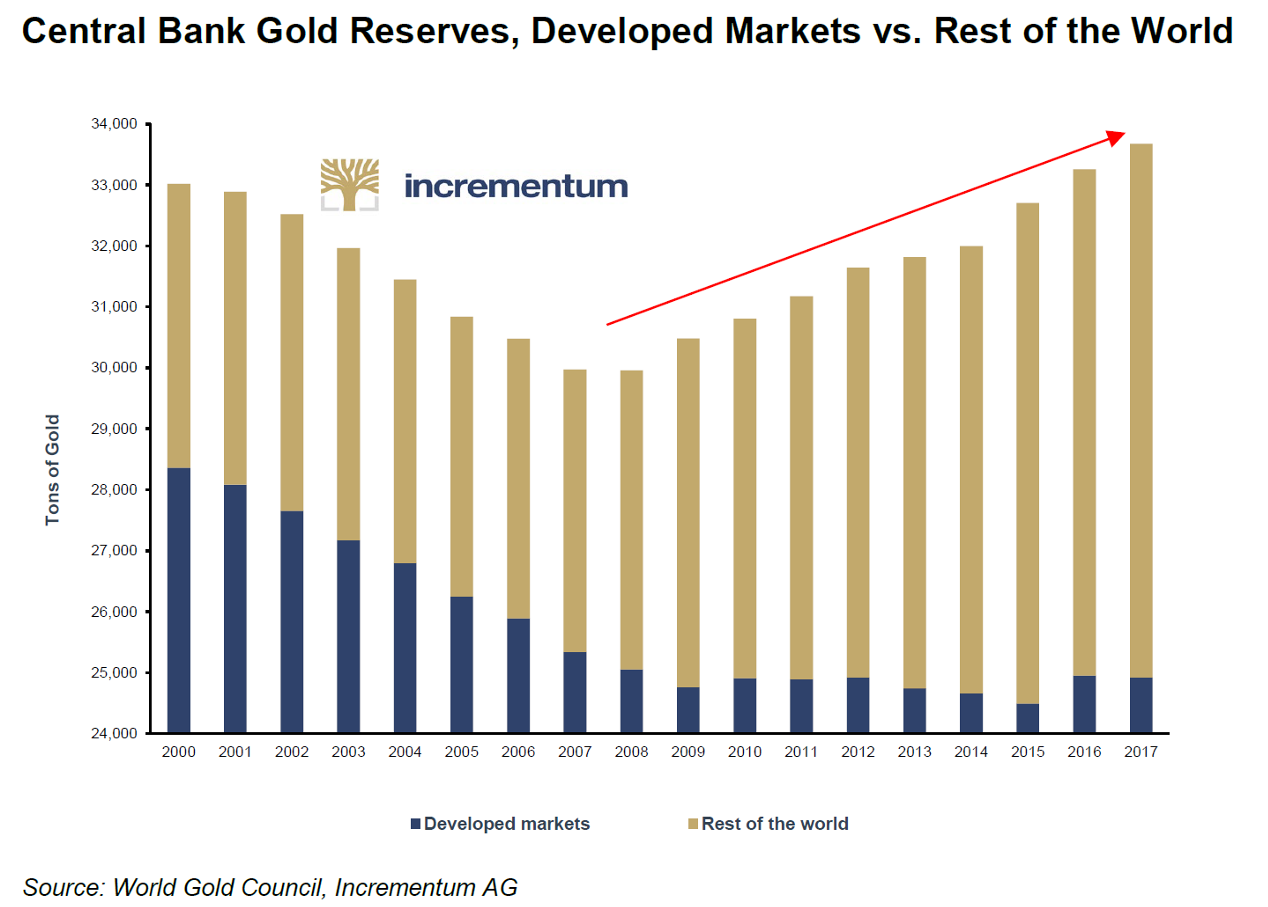
Gold and Gold StocksSince Trey is managing a precious metals fund, gold was of course on the agenda as well. Both Jim and Trey are bullish on gold and so is the proprietary Incrementum Inflation Indicator. One of the points under discussion was gold buying by central banks. In aggregate, central banks have turned from net sellers into net buyers in recent years. The chart below illustrates what has happened: Normally we would regard this as irrelevant at best, and a contrary indicator at worst. If one looks at the long-term history of central bank activity in the gold market, it sometimes was aligned with the trend and sometimes wasn’t. But there is an interesting detail one has to consider. To begin with, note that the amounts involved are not large enough to matter. They pale compared to the reservation demand for gold. These activities are only informative as pointers to the thinking of the decision-makers involved. As the chart shows, in developed nations, gold reserves merely began to stand still after declining for many years. Only emerging market central banks were outright buyers of gold and added to their reserves. What does this tell us? First of all, it shows that central bankers in emerging markets are well aware of gold’s monetary characteristics. To them, it is not “demonetized”, except in the most superficial sense. Secondly, EM central banks have amassed vast USD reserves in the course of the past few decades. Their gold purchases are most likely a hedge against this dollar exposure, not least on account of the fact that the US is capable of using the dollar as a weapon in foreign policy. The unseemly haste with which Russia ditched its US treasury holdings in favor of gold last year speaks for itself in this regard. Considering this backdrop, recent central bank purchases may actually be a minor positive overall. For one thing, they reaffirm gold’s role as the ultimate money (as Alan Greenspan once explained in Congressional testimony, if all else fails, one can always still pay for imports with gold). Secondly, if this demand is sustained for a while yet, it will at the very least affect prices at the margin somewhat, even if it is per se not a strong reason to be bullish. |
Central Bank Gold Reserves, 2000 - 2017 |
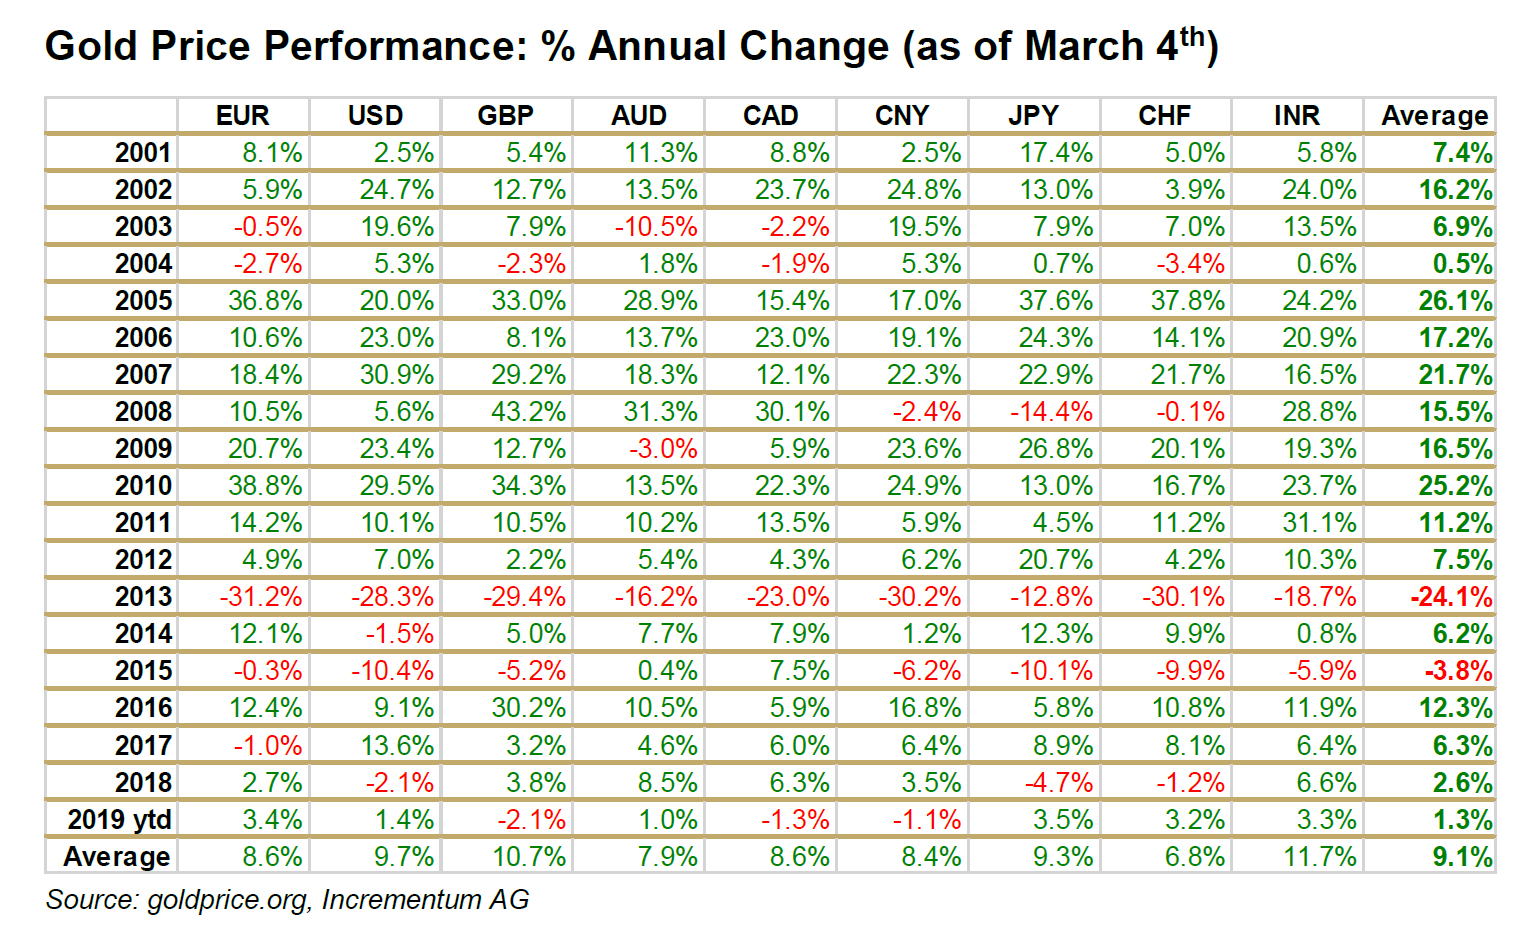
| Another interesting tidbit that came up in the gold discussion is that gold has actually done a lot better than one would think (especially if one has held gold stocks in recent years). Consider the following table of gold prices in multiple currencies since 2001 – on average, there were only two down years, but one of them (2013) was a doozy:
Another interesting topic discussed were gold stocks, institutional (dis)interest in the gold sector and the recent spate of big mergers. For the details we refer you to the transcript which you can download below, but here is one remark by Trey we would like to quote:
|
Gold Price Performance |
Just think about the highlighted passage for a moment. It is probably the most bullish thing we have heard about the sector in a long time. Things cannot possibly get any more contrarian.
Full story here Are you the author? Previous post See more for Next postTags: Chart Update,Credit Markets,Interest Rate,newsletter,On Economy,On Politics,Precious Metals


