| 10 Reasons Why You Should Add To Your Gold Holdings
– Gold currently undervalued
– Since 2000, the gold price has beaten the S&P 500 Index
– A ‘a once-in-a-decade opportunity’ as gold-to-S&P 500 ratio is at its lowest point in 10 years.
– Reached ‘peak gold’ as exploration budgets continue to tighten
– $80 trillion sits in global equities, a ‘ticking time bomb’
– Gold remains an appealing diversifier in the current environment of high valuations and uncertainties |
Gold Price and S&P 500 Index, 2000 - 2017(see more posts on Gold prices, S&P 500 Index, ) by Frank Holmes via Forbes.com - Click to enlarge |
It’s important to remember that the precious metal has historically shared a low-to-negative correlation with many traditional assets such as cash, Treasuries and stocks, both domestic and international. This makes it, I believe, an appealing diversifier in the event of a correction in the capital and forex markets.
Need more reasons to add to your gold holdings? Below are 10 charts that show why the yellow metal is undervalued right now:
1. The gold price has crushed the market so far this century.
Investors are invariably surprised to see the top chart whenever I show it at conferences. Believe it or not, since 2000, the gold price has beaten the S&P 500 Index, which has undergone two 40 percent corrections so far this century.
2. Compared to stocks, gold looks like a bargain.
|
Gold Price and S&P 500 Index, 2007 - 2017(see more posts on Gold prices, S&P 500 Index, )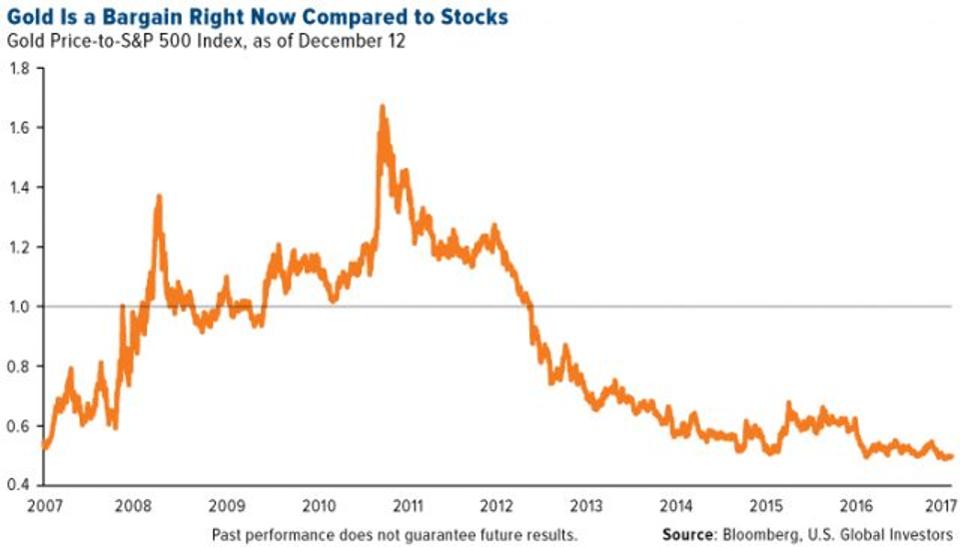 - Click to enlarge |
As of this month, the gold-to-S&P 500 ratio is at its lowest point in 10 years. For mean reversion to occur, either the gold price needs to appreciate or share prices need to fall. Either way, consider this a once-in-a-decade opportunity.
3. Exploration budgets keep getting slashed.
|
Exploration Budgets and Indexed Metals Prices, 1993 - 2017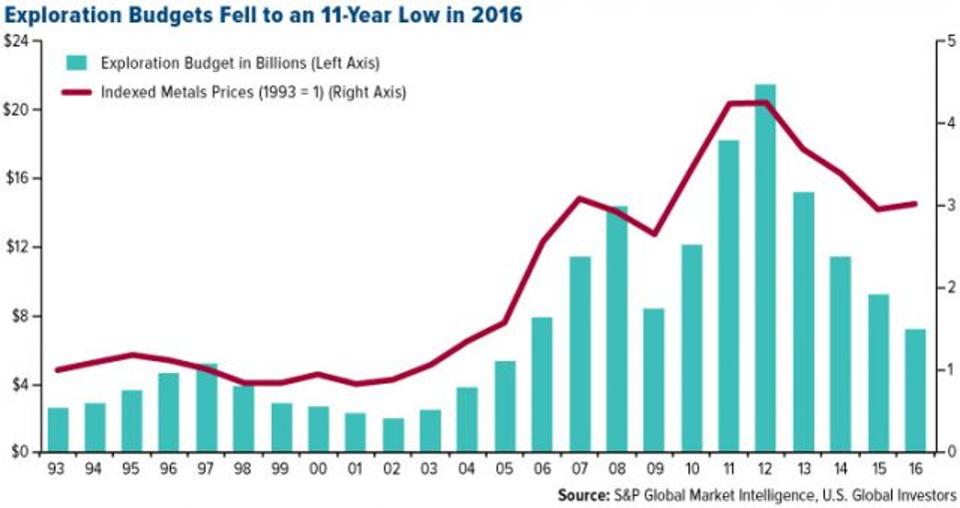 - Click to enlarge |
One of the reasons why gold is so highly valued is for its scarcity. There’s a possibility it could get even scarcer as explorers continue to trim exploration budgets and uncover fewer and fewer large deposits. The time between initial discovery and day one of production is also expanding. This has led many experts in the field to wonder if we’ve finally reached “peak gold.”
4. Gold stocks could be just getting started.
|
Gold Mining Index, 1942 - 2017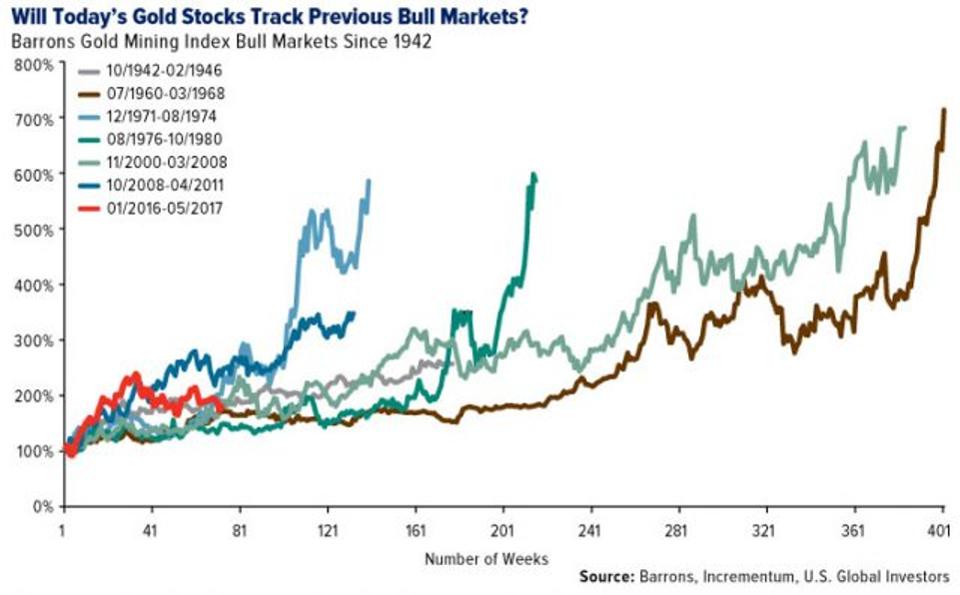 - Click to enlarge |
Last year marked a turnaround in gold prices and gold stocks, and according to analysts at Incrementum Capital Partners, a Swiss financial management firm, they’re just getting warmed up.When charted against past gold bull markets, the present one looks as if it still has a lot of room to run.
5. Is too much money going into equities?
|
Bloomberg World Exchange Market Cap, 2004 - 2017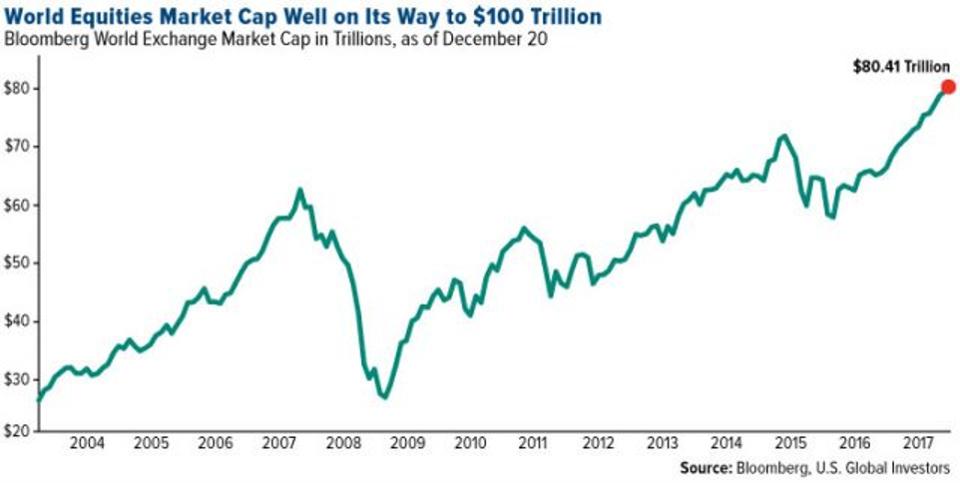 - Click to enlarge |
More than $80 trillion sits in global equities right now, a monumental sum that’s likely to surge even more as we venture further into the bull market. Some worry this is a ticking time bomb just waiting to go off. Another correction similar to the one 10 years ago would wipe out trillions of dollars around the world, and it’s then that the investment case for gold would become strongest.
6. Higher debt could mean higher gold prices.
|
Percent of Gross Domestic Product, 1790 - 2018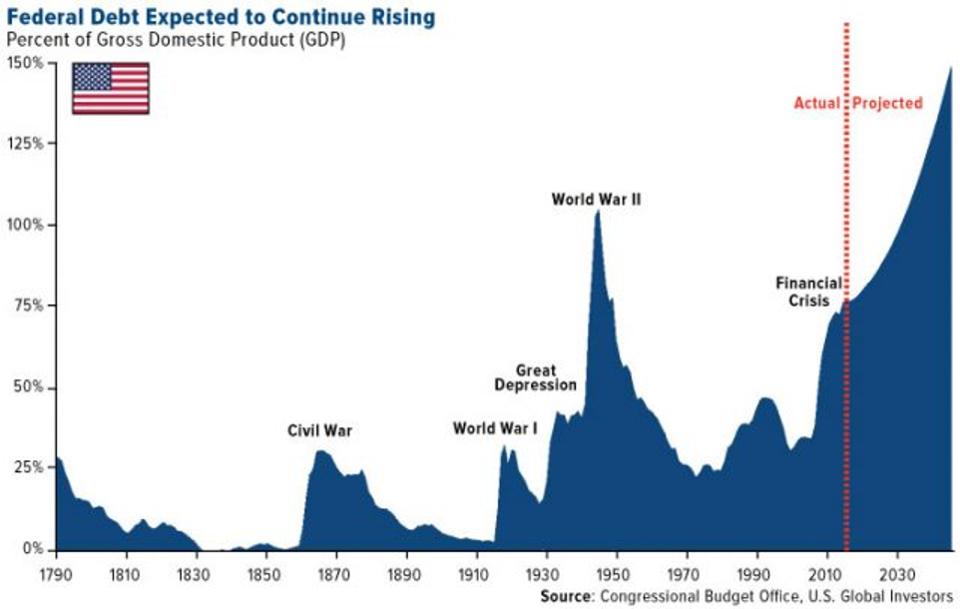 - Click to enlarge |
The yellow metal has historically tracked global debt, which stood at $217 trillion as of the first quarter of this year. Looking just at the U.S., debt is expected to continue on an upward trend, driven not just by new, and largely unfunded, spending but also underlying interest. By most estimates, President Donald Trump’s historic tax cuts, although welcome, will contribute to even higher debt as a percent of gross domestic product (GDP).
7. The Fed’s about to take away the punch bowl.
|
Federal Reserve Process of Unwinding, Jun - Dec 2017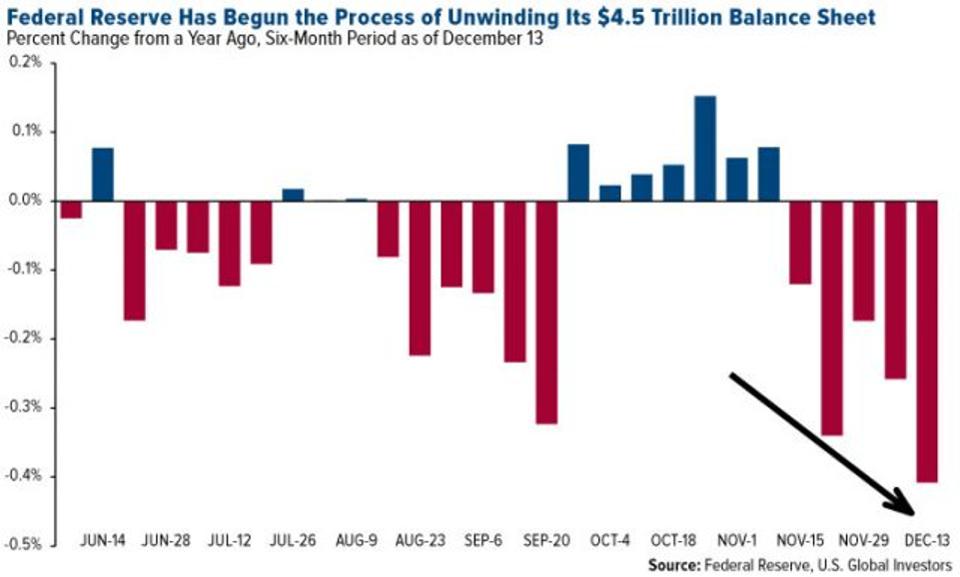 - Click to enlarge |
“My opinion is that business cycles don’t just end accidentally. They end by the Fed. If the Fed tightens enough to induce a recession, that’s the end of the business cycle.” That’s according to MKM Partners’ chief economist Mike Darda, who was referring to the Federal Reserve’s efforts to unwind its $4.5 trillion balance sheet after it bought vast quantities of government bonds and mortgage-backed securities to mitigate the effects of the Great Recession. There’s definitely a huge amount of risk here: Five of the previous six times the Fed has similarly reduced its balance sheet, between 1921 and 2000, ended in recession.
8. Rate hike cycles have rarely ended well.
|
Effective Fed Fund Rate and Recessions, 1914 - 2014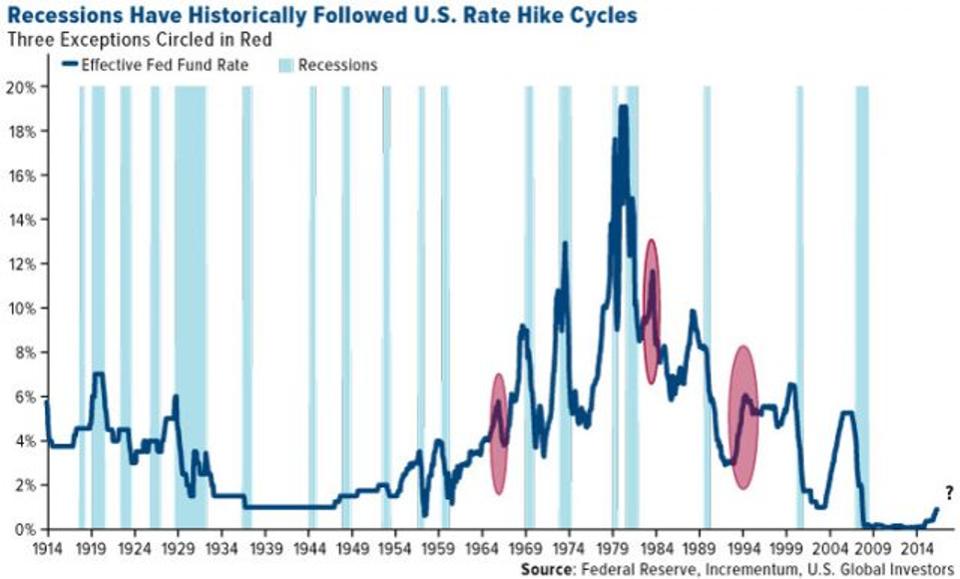 - Click to enlarge |
Rate hike cycles also have a mixed record. According to Incrementum research, only three such cycles in the past 100 years have not ended in a recession. Obviously there’s no guarantee that this particular round of tightening will have the same outcome, but if you recognize the risk here, it might be prudent to have as much as 10 percent of your wealth in gold bullion and gold stocks.
9. Trillions of dollars of global bonds are guaranteed to lose money right now.
|
World Central Banks Interest Rates in Negative Territory, Jan 2014 - Sep 2017 - Click to enlarge |
As of May of this year, nearly $10 trillion of bonds around the world were guaranteed to cost investors money, as more and more central banks instituted negative interest rate policies (NIRPs) to spur consumer spending. Instead, it encouraged many savers to yank their cash out of banks and convert it into gold. That’s precisely what households in Germany did, and by 2016, the European country became the world’s biggest investor in the yellow metal.
10. The Love Trade is still driving gold demand.
|
Gold's 30-Year Seasonality Patterns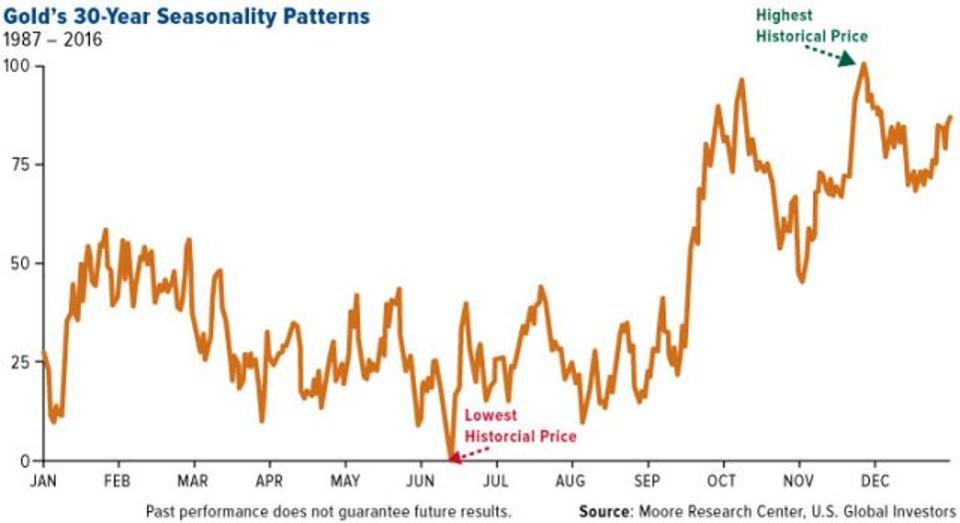 - Click to enlarge |
| The chart above, based on data provided by Moore Research, shows gold’s 30-year seasonal trading pattern. Although it’s changed over the past few years, the pattern reflects the Love Trade in practice. According to the data, the gold price rallies early in the year as we approach the Chinese New Year, then dips in the summer. After that it surges on massive gold-buying in India during Diwali, in late October and early November. Finally, it ends the year at its highest point during the Indian wedding season, when demand is high. The pattern isn’t always observed exactly how I described, but it happens frequently enough for us to make educated, informed decisions on when to trade the precious metal. |
Gold Price and S&P 500 Index, 2000 - 2017(see more posts on Gold prices, S&P 500 Index, )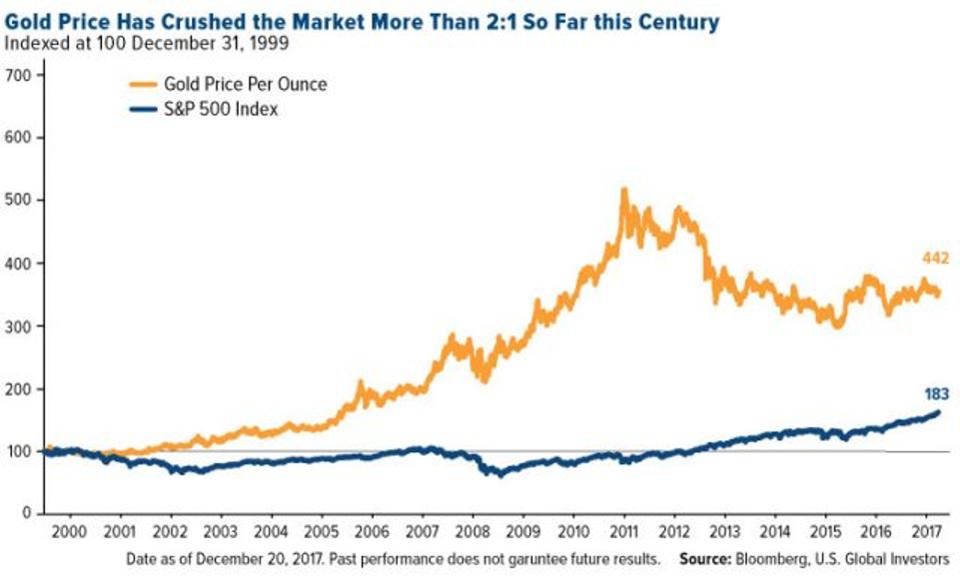 Source: Frank Holmes - Click to enlarge |