Switzerland’s real gross domestic product (GDP) grew by 0.3 % in the 2nd quarter of 2017. Manufacturing, the financial sector and the hotel and catering in-dustry significantly boosted growth, while developments in trade, public administration and the healthcare sector were sluggish. On the expenditure side, growth was driven by domestic demand, with positive momentum coming from both consumption and investment. By contrast, the trade balance contributed negatively to GDP growth. The present quarterly figures are based on the latest revised annual figures of the national accounts published by the Swiss Federal Statistics Office (SFSO) from 1995 onwards.
| Switzerland’s GDP grew by 0.3% in the 2nd quarter of 2017, which is a slight acceleration compared to the previous quarter (revised from +0.3 % to +0.1 %). |
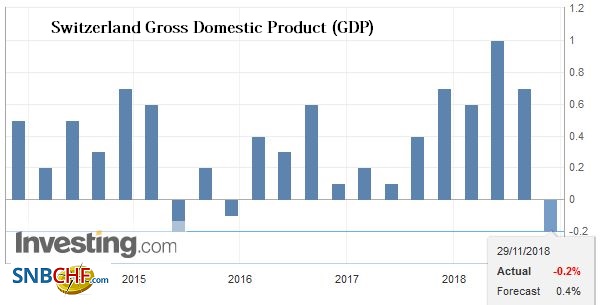
Switzerland Gross Domestic Product (GDP) YoY, Aug 2017(see more posts on Switzerland Gross Domestic Product, )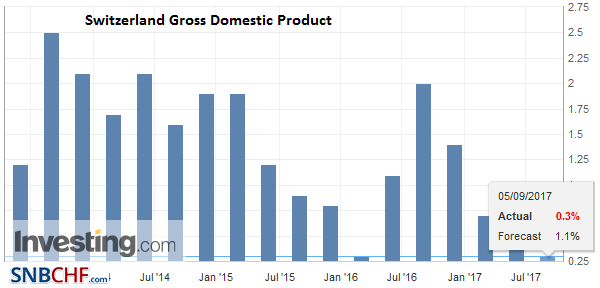 Source: Investing.com - Click to enlarge |
| On the production side of GDP, both the industrial sectors and some service sectors contributed to growth in the 2nd quarter. |
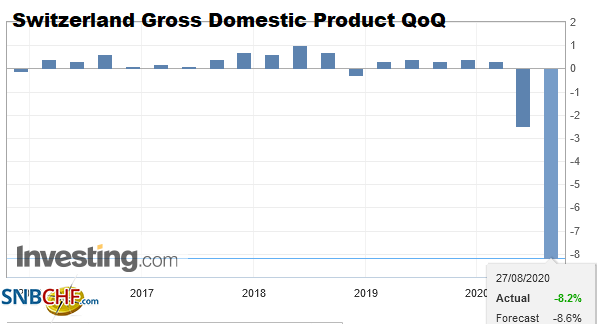
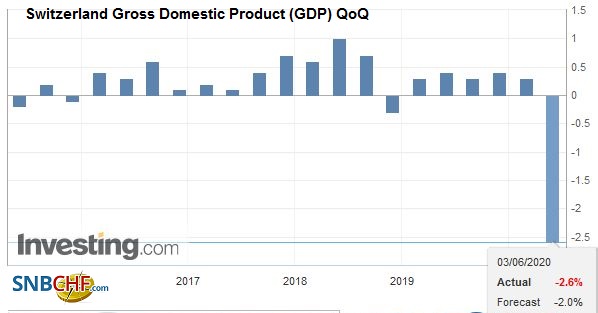
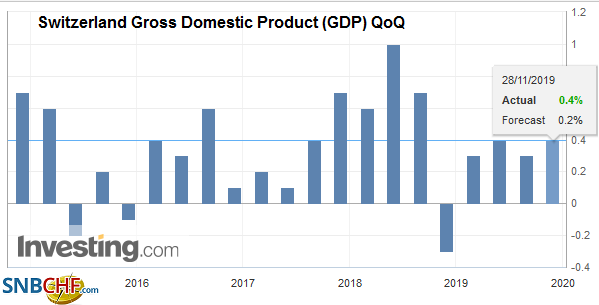
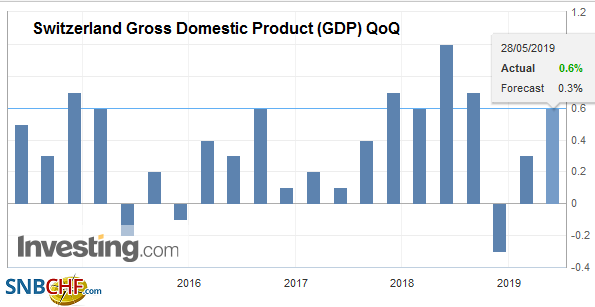
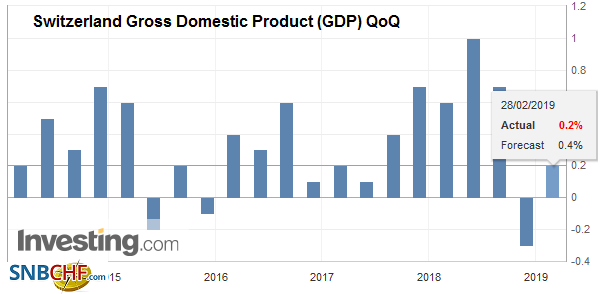
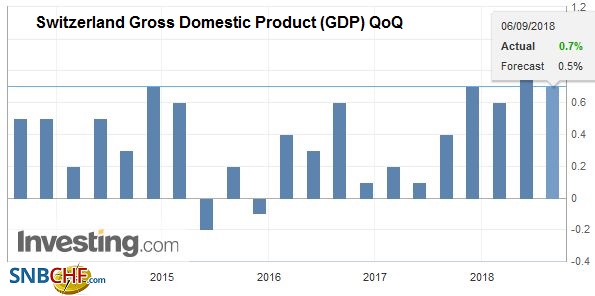
Switzerland Gross Domestic Product (GDP) QoQ, Q2 2017(see more posts on Switzerland Gross Domestic Product, )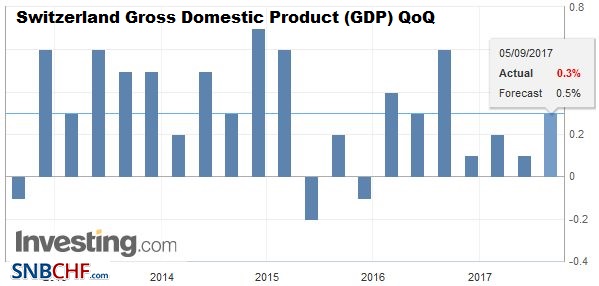 Source: investing.com - Click to enlarge
|
Production SideManufacturing (+0.9%) grew again at a rate above the historical average, but was not able to keep up with the strong performance of the previous quarter. Moreover, value added increased markedly in the energy sector (+2.2 %). Two important service sectors also grew considerably in the 2nd quarter: the hotel and catering industry (+3.4 %), which had expanded only slightly in the previous quarter, and the financial sector (+2.7 %), which, after a decline in the 1st quar-ter, was able to resume the positive trend of the second half of 2016. However, some other service sectors performed only poorly. Value added fell slightly in trade (-0.2 %), public admin-istration (-0.1 %) and the healthcare sector (-0.1 %), and stagnated in business services (+0.0 %). |
GDP YoY Growth Rates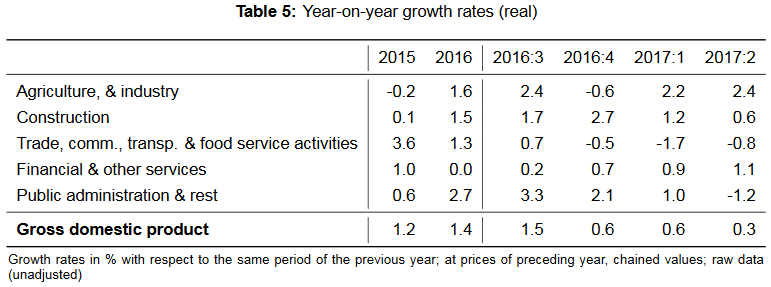 Source: GDP-QNA - Click to enlarge |
GDP GrowthOn the expenditure side of GDP, growth was driven by domestic demand. Private consump-tion (+0.2 %) expanded moderately, supported by higher expenditure on healthcare, housing and energy, and restaurants and hotels. In contrast, consumption expenditure on clothing, footwear, furniture and household equipment decreased. Government consumption (+0.3 %) also increased at a moderate pace, as did investment in equipment (+0.3 %), where momentum slowed significantly compared to the previous quarter. Whereas investment in other vehicles and IT services provided a boost, investment in machinery and automobiles declined. Investment in construction (+0.8 %) gathered pace after two fairly weak quarters. |
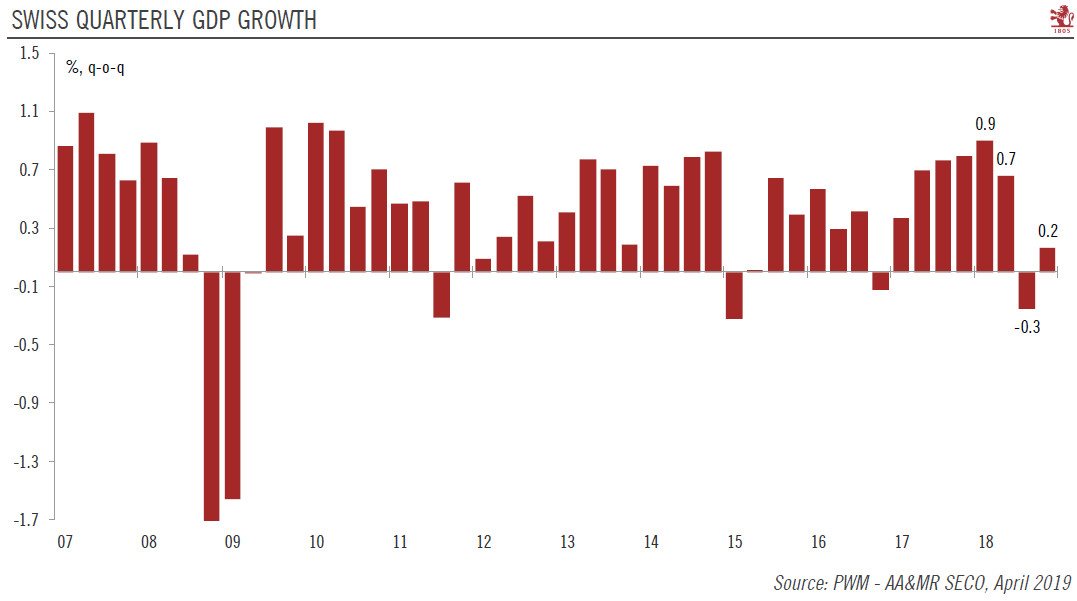
Quarter on Quarter Growth Rates ESVG, Q2 2017 Source: GDP-QNA - Click to enlarge |
ExportsOverall, the contribution of the trade balance in goods2 and services to GDP growth in the 2nd quarter was negative. Following the strong performance in the previous quarter, exports of goods2 (+0.5 %) experienced only a slight but broad-based increase. In particular, exports of precision tools, watches and jewellery continued to grow. Exports of services (-0.3 %) decreased. While exports of financial services stepped up, this was more than offset by a contraction in exports of transport services, licences and patents. Meanwhile, imports of goods2 (+5.5 %) rose sharply, largely driven by considerable growth in imports of chemical and pharmaceutical products. Imports of services (+1.7 %) also rose, among other things due to increased imports of telecommunication and IT services as well as research and development. |
Year on Year Growth Rates ESVG Source: GDP-QNA - Click to enlarge |
The quarterly figures are based on the latest available annual national accounts data, which are published by the SFSO, and which have undergone an extended revision in summer 2017. The revision concerns both the levels and growth rates of various aggregates from 1995 onwards. Where necessary, SECO has adjusted its methods for deriving quarterly national accounts figures. The business cycle interpretation of the quarterly figures of the recent past has essentially remained the same.3
Download press release Switzerland / 2nd quarter of 2017
Full story here Are you the author?Tags: newslettersent,Switzerland Gross Domestic Product