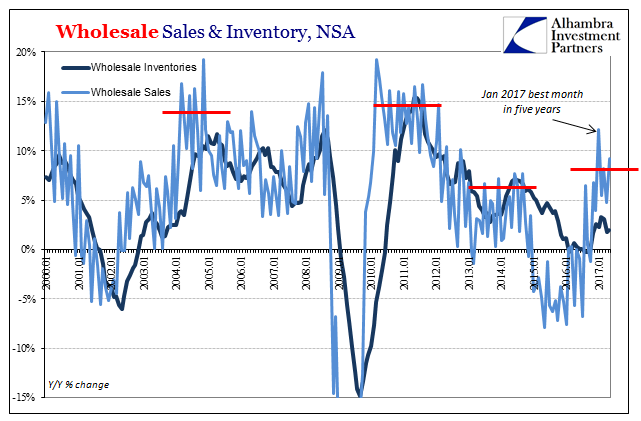
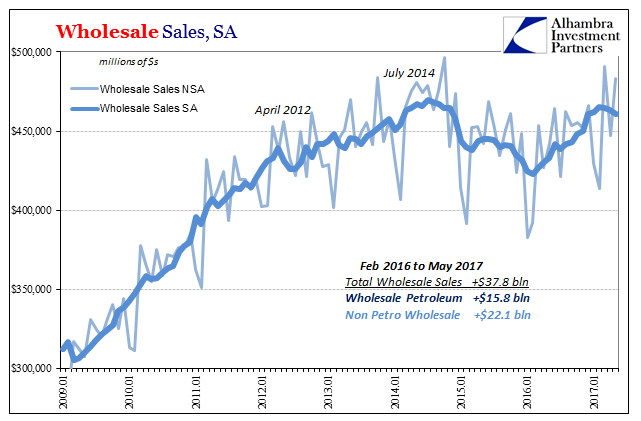
| In the same way as durable goods orders and US imports, wholesale sales in May 2017 were up somewhat unadjusted but down for the third straight month according the seasonally-adjusted series. As with those other two, the difference is one of timing. In other words, combining the two sets, seasonal and not, we are left to interpret a possible recent slowing in activity. There are gains year-over-year to be sure, but it increasingly appears as if that growth was backloaded and limited to mostly the second half of last year. |
Wholesale Sales and Inventory NSA, January 2001 - July 2017(see more posts on wholesale inventory, wholesale sales, ) |
| Year-over-year, wholesale sales were up 9.2% (NSA) in May, which actually betrays a lack of acceleration much like, again, durable goods and imports. Growth rates accelerated initially in the second half of 2016, but only to become positive numbers from what was nearly two years of contraction. Growth in sales seems to be stalling at around the same low level as in 2014. |
Wholesale Sales NSA and SA, January 2009 - July 2017(see more posts on wholesale sales, ) |
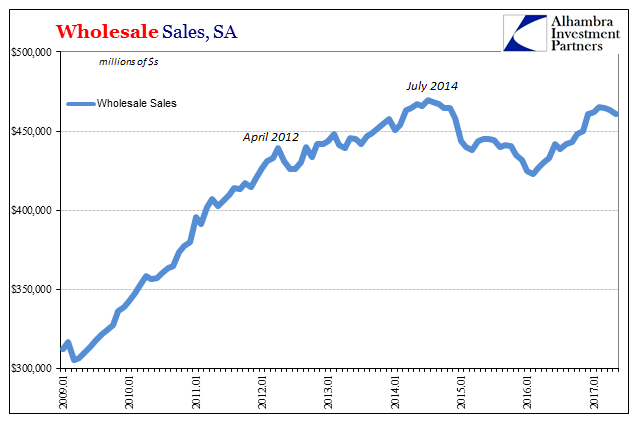
| That would appear to be the idea behind the seasonally-adjusted declines over each of the past three months. Peaking at $465.4 billion (SA) in February, wholesale sales have declined to a pace of just $460.1 billion in May. That is attributable to petroleum, where less is being sold and at a lower price (as one follows the other).
|
Wholesale Sales NSA and SA, January 2009 - July 2017(see more posts on wholesale sales, ) |
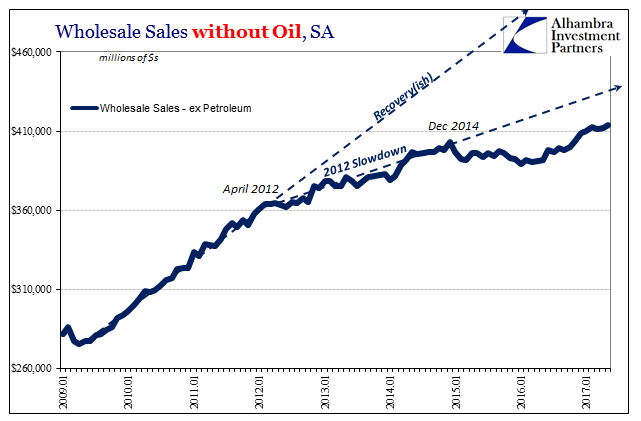
| Outside of petroleum, wholesale sales haven’t grown, however. The seasonally-adjusted estimate for May ex petrol is only slightly more than February and still way off even the slowed 2012 trend-line.
|
Wholesale Sales excluding Oil, January 2009 - July 2017(see more posts on wholesale sales, ) |
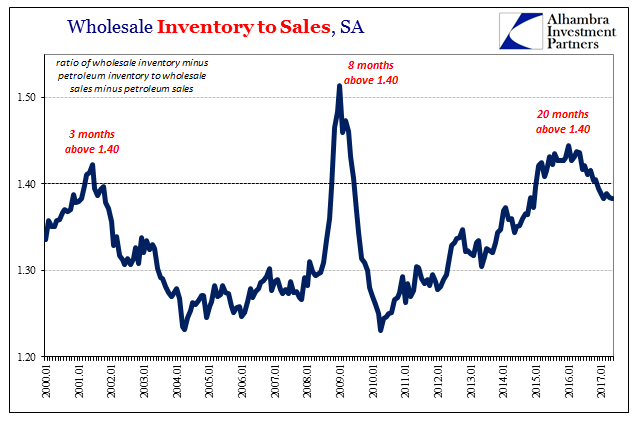
| On the other side of the ledger, inventories were up in May (SA) but less than March. Year-over-year, wholesale inventories have increased by about 2% the past few months. While that is less than the gains during much of 2015, it also follows what was in 2016 noticeable for its lack of liquidations. Inventory is therefore growing if slowly from an already very high level. |
Wholesale Inventory to Sales, January 2000 - July 2017(see more posts on wholesale inventory, wholesale sales, ) |
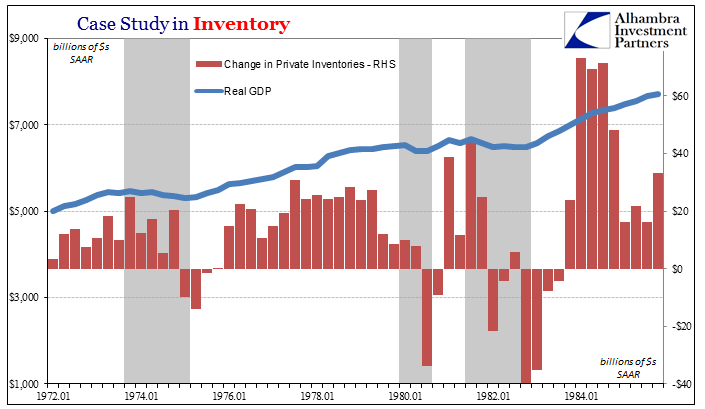
| Excluding petroleum, the inventory-to-sales ratio is only slightly below the 1.40 mark that in the past has indicated conditions like recession. What typically occurs after reaching such an extreme is a rapid destocking process that in past recessions signaled the start of the recovery part of the business cycle. |
Change in Private Inventories and Real GDP, January 1972 - July 2017(see more posts on real GDP, ) |
As I wrote a few weeks ago on the (great) importance of inventory liquidation in aiding the formation of recovery:
Though the downturn in 2015-16 was not a recession, at least not officially, it was a significant and significantly severe event so as to invoke cyclical processes. Inventory was a clear part of what became a two-year long manufacturing recession, shallow though as it may have been. But according to GDP figures, the inventory response at its end was far short of liquidation…
The usual symmetry of cyclical circumstances, which apply to near-recessions as well as full ones, dictated that in 2017 there should have been a familiar and inarguable acceleration. There hasn’t as yet and increasingly it appears there won’t be. If that is ultimately our situation, and the data is uniformly describing it this way, the stubbornly high levels of remaining inventory are very likely one of the primary factors, if not the primary factor, in holding the world economic system in its weakened, almost perpetual near recession-like state.
What should have happened (and I write “should” in hypothetical terms of a true cycle) in 2016 was full-on liquidation, the intentional and frenzied elimination of all excesses. Whatever level of stock the private markets felt compelled to diminish should have been purged and in rapid fashion so that when sales picked back up again, as they are always to do, that growth would have been accelerated and amplified by just as frenzied restocking.
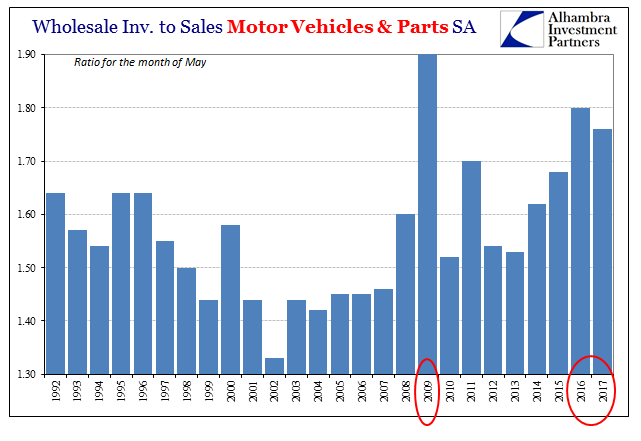
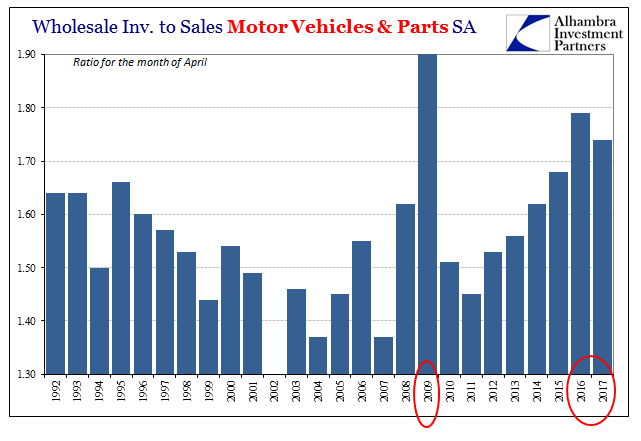
| Instead, and in one of the most crucial of economic spaces, inventories haven’t much budged, and so production must remain at best in limbo; at worst facing further contraction even after so much of it, broadly speaking, over the past several years. I’m talking about the auto sector, where on the wholesale level there remains far, far too much product idly taking up resources and continuing to plug (or stuff) the supply chain. |
Wholesale Inventories to Sales Motor Vehicles and Parts, 1992 - 2017(see more posts on Wholesale Inventories, ) |
| Inventories are down a little as compared to what were extreme levels last year, but that has been due more to production adjustments than a surge in sales. Without a real burst of consumer spending, stubborn inventory will have to turn, in autos, production adjustments into actual and more economically painful cuts. The level of wholesale sales (ex petrol) suggests (corroborating other accounts) that spending boost isn’t yet anywhere indicated.
Instead, the wholesale level of the supply chain remains stuck as the margins of the economy moves between shallow but sustained contraction and shallow but sorely insufficient “growth.” For the manufacturing sector at least, you have to think that without the liquidation, the natural cyclical progression, it can only remain this way anchored on the downside. Though manufacturing may not be the same proportion of activity that it once was, the last few years have shown that at the margins this does matter a great deal. |
Wholesale Inventories to Sales Motor Vehicles and Parts SA, 1992 - 2017(see more posts on Wholesale Inventories, ) |
Full story here Are you the author? Previous post See more for Next post
Tags: Markets,newslettersent,OIL,petroleum,real GDP,Wholesale Inventories,wholesale inventory,wholesale sales


