| Do you think silver is poised to go higher?
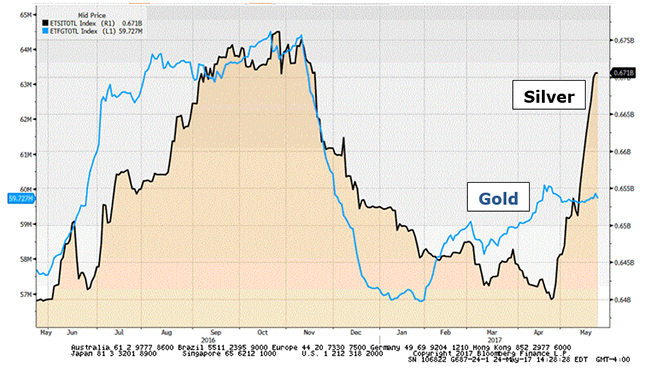
I sure do. That’s because I’m watching what is going on in the world’s silver ETFs. I’m also watching the mountain of forces that are piling up to push the metal higher. Look at this chart. It shows all the metal held by the world’s physical silver ETFs (black line). And all the metal held by the world’s physical gold ETFs (blue line) … |
Gold And Silver Prices, May 2016 - May 2017(see more posts on Gold and silver prices, ) |
| I showed you this same chart last week. Since then, silver ETFs have added another 8 million ounces. At the same time, gold ETFs have added only 56,000 ounces.
In fact, since late April, silver ETFs have added 31 million ounces of the metal. Gold ETF holdings over that time frame have zigged and zagged. But those are basically flat. Kind makes you go “hmm,” doesn’t it? Why is someone stocking up on all that silver? I can think of a few reasons why …
The Silver Institute reported that global silver production peaked in 2015. It takes years to bring a new silver mine online. And let me tell you, there aren’t a lot of new silver projects around. |
|
| Looking at that earlier chart of silver ETFs, the recent demand trend looks clear. (Up!) Now ask yourself, “What happens when silver demand goes higher?”
Last year, the physical deficit was 52.2 million ounces, according to Thomson Reuters. That was the third deficit in a row. And that trend is not about to change anytime soon …Well, when you put together rising demand and falling supply, you get a deficit. Another Massive Deficit This Year This year, it should be four years of deficit in a row. Banking giant HSBC has forecast a 132 million-ounce deficit for 2017. That’s more than double last year’s deficit. Sure, not everyone agrees on the exact amount of silver supply … demand … or silver in storage. That’s what makes a market. But the forecasts of a deficit are backed up by what we can see on the ground. Chile’s silver production dropped 26% in the first quarter. Now, some will tell you that the silver market is always in deficit lately. And the market never seems to care. That’s true … to a point. That’s because the deficit can be made up by above-ground stockpiles. But stockpiles will only last so long. And that brings me back to that chart I showed you. I think someone is betting that the time for a price squeeze is edging closer. |
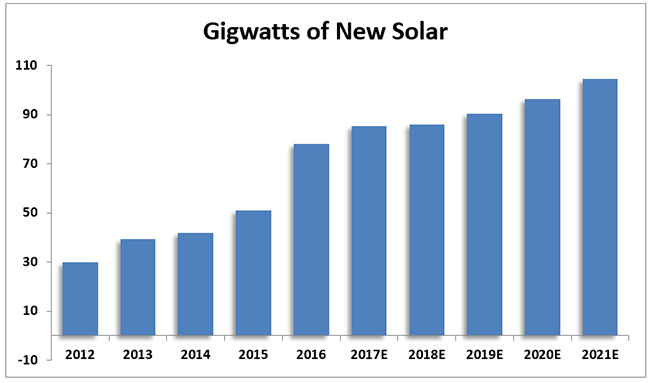
Gigawatts Of New Solar, 2012 - 2021 |
| Solar Demand Could be Key
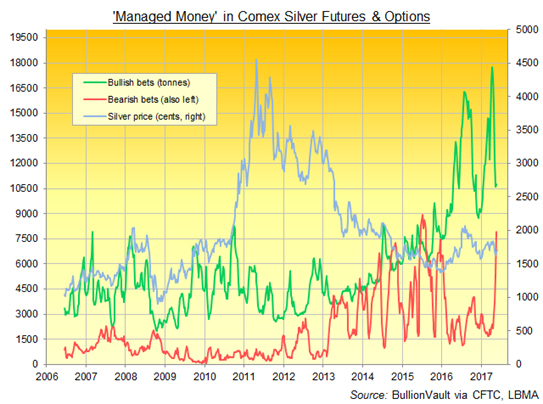
The difference may be photovoltaic demand. It climbed from 57.2 million ounces in 2015 to 76.6 million ounces in 2016. And the solar buildout is still ramping up. I find that solar forecasts that go more than a couple years out are generally unreliable. So far, they’ve always underestimated real demand. On the other hand, remember that the solar industry is getting more-efficient in its silver use. Still, add it all up, and the demand trend looks big. That’s longer term. Is there a driver of silver prices in the short term? Yes! Let me show you one more chart. I snagged this from our friends at BullionVault.com. It shows how hedge funds are betting on silver right now. |
Managed Money In ComeX Silver Futures And Options, 2006 - 2017 |
Full story here Are you the author? Previous post See more for Next post
Tags: Gold and silver prices,newslettersent,Weekly Market Update


