Pater Tenebrarum
My articles My siteAbout meMy videosMy books
Follow on:TwitterSeeking AlphaFacebook
Counterintuitive MovesSomething odd happened late in the day in Wednesday’s trading session, which prompted a number of people to mail in comments or ask a question or two. Since we have discussed this issue previously, we decided this was a good opportunity to briefly elaborate on the topic again in these pages. A strong ADP jobs report for March was released on Wednesday, and the gold price dutifully declined ahead of it already, while the stock market surged concurrently. Later in the day, the Fed minutes were published, and their tone was definitely seen as very “hawkish”, at least by today’s standards. |
 Strange happenings alert! |
There was quite a bit of talk about rate hikes and – gasp! – even about ending reinvestment of funds the Fed receives when debt securities in its QE portfolio mature. The merry pranksters also bemoaned the egregious bubble their own policies have given birth to.
(emphasis added) Here is a 15 minute candle chart encompassing Wednesday’s intra-day moves in June gold futures: Talk about “balance sheet normalization” – with the added twist that “most” committee members seemed to think it was an idea whose time had come – apparently was indeed a bit of a surprise to market participants, who probably (and quite reasonably) assumed it would never happen. Not surprisingly, they have already gotten over the “shock” as of Thursday’s trading, but in this case, their initial reaction actually made sense. |
Gold intraday(see more posts on Gold, )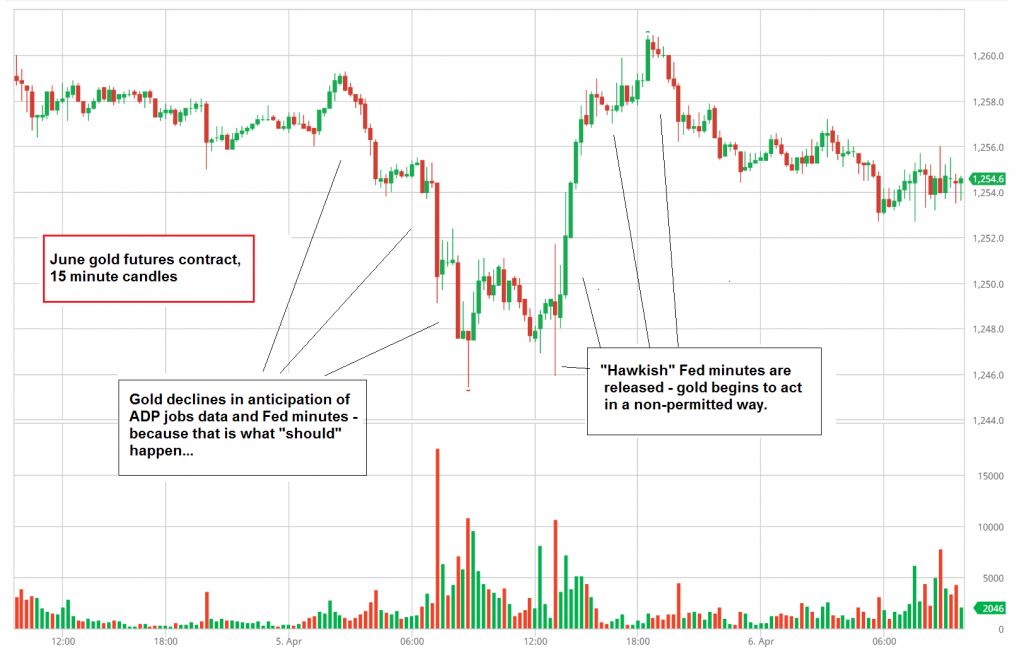 June gold futures, 15 minute candles. After at first declining in anticipation of a strong ADP report and hawkish Fed minutes, gold rebounded when said minutes were released – and actually sounded even more hawkish than expected. - Click to enlarge |
An Endangered Bubble and Discounting the FutureWhat will happen, if the Fed actually allows its balance sheet to shrink by no longer reinvesting money it receives for maturing securities? Unless inflationary bank credit expands at a faster rate than the repayments, this will invariably result in shrinking the money supply. Essentially, it would be a reversal of QE – a part of the deposit money created by debt monetization would return to where it originally came from, namely thin air. You have one guess what will happen to “risk assets” if and when free excess liquidity in the system begins to evaporate. Here is a hint: it will be time to wave good-bye to the bubble. Stock market traders actually had the right idea on Wednesday afternoon: Before we continue, we want to stress that we are using Wednesday’s odd market moves merely as an opportunity to illustrate an important point – we are well aware that one-day moves are usually meaningless and best categorized as “noise”. Nevertheless, these moves in a way provided an illustration of an effect of longer term relevance. We have discussed said effect a few times in these pages before. Recall that back in 2014 – 2015, assorted Fed heads were talking incessantly about impending rate hikes, which they then kept postponing over and over again. At the same time, a whole host of gold bears in the mainstream financial media never tired of reminding everyone of the merciless decimation that was certain to be inflicted on the gold price once the Fed actually did hike rates. |
S&P 500 intraday(see more posts on S&P 500 Index, )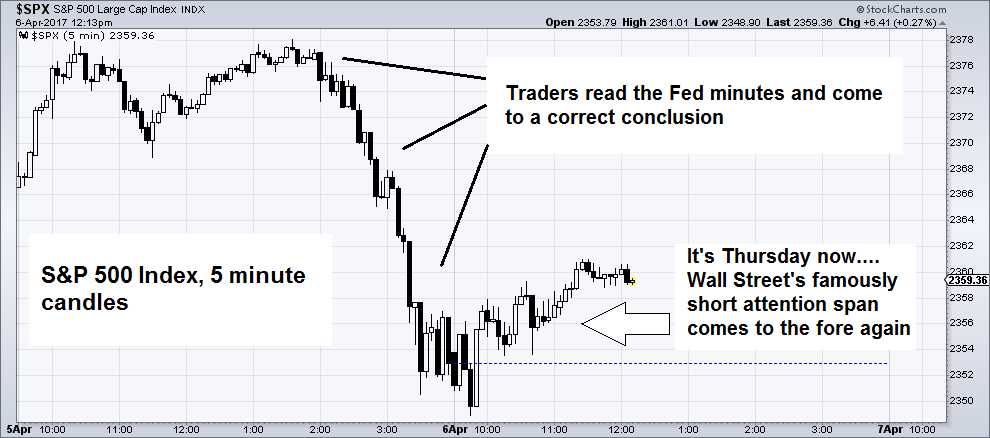 S&P 500 intraday – the Fed minutes triggered a brief moment of quite apposite bubble doubt. - Click to enlarge |
| Long time readers may also remember that we said to this: bring it on! Luckily they finally did bring it on in December of 2015. One day after the first rate hike, we published a final, extensive debunking of the claims made by the afore-mentioned authors with respect to gold and Fed policy in an article appropriately entitled “Gold and the Federal Funds Rate”.
As it turned out, the first rate hike coincided almost to the day with what was so far the post-2011 correction low in the USD gold price (gold bottomed much earlier in other currencies). Not only that – gold has rallied by almost 20% since then. We haven’t heard back yet from Mr. and Mrs. Pet Rock (generic name for the flood of “gold experts” no-one had ever heard of before who suddenly flooded the pages of Bloomberg, the FT, the WSJ, etc., throughout 2015). |
Gold weekly, Apr 2015 - Jun 2017(see more posts on Gold, )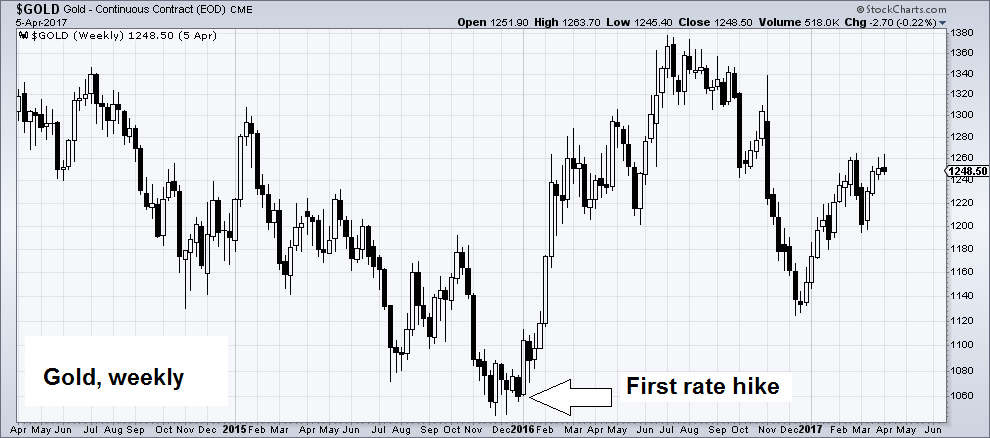 Gold, weekly – the first rate hike so far marked the end of the bear market that started in late 2011 – click to enlarge. - Click to enlarge |
| To this one must consider what happens when the threat of the markets losing excess liquidity becomes manifest. Gold is potentially the greatest beneficiary of such a development (treasury bonds may benefit as well to some extent). That may indeed appear counter-intuitive at first glance… after all, higher interest rates and weaker money supply growth are traditionally held to be negative for gold.
Indeed, they are – however, it is important to look at the situation holistically and consider potential leads and lags. Traditionally the gold market is one of the markets that are most sensitive to changes in the liquidity backdrop. It often (but not always) also looks ahead the farthest. In other words, it is not necessarily always reacting to what is happening right now, or in the near future – at times it is discounting future events long before they happen. Below is a recent chart by Dr. Frank Shostak of AASE showing the rate of change in the US money supply measure AMS (adjusted money supply). This is essentially a narrow version of the broad money supply TMS-2, which excludes savings deposits. That makes it more volatile than TMS-2, but it is nevertheless a quite useful measure of the money supply. It may still take a while for the effects of the slowdown in money supply growth to take hold – as can be seen above, the 12-month moving average remains fairly elevated, and there is always a considerable lag between a slowdown in money supply growth and declines in asset prices and a slowdown in economic activity. Still, we consider this chart to be the biggest warning sign for “risk assets” since the beginning of the stock market rally in early 2009. |
US money AMS rate of change 2006-2017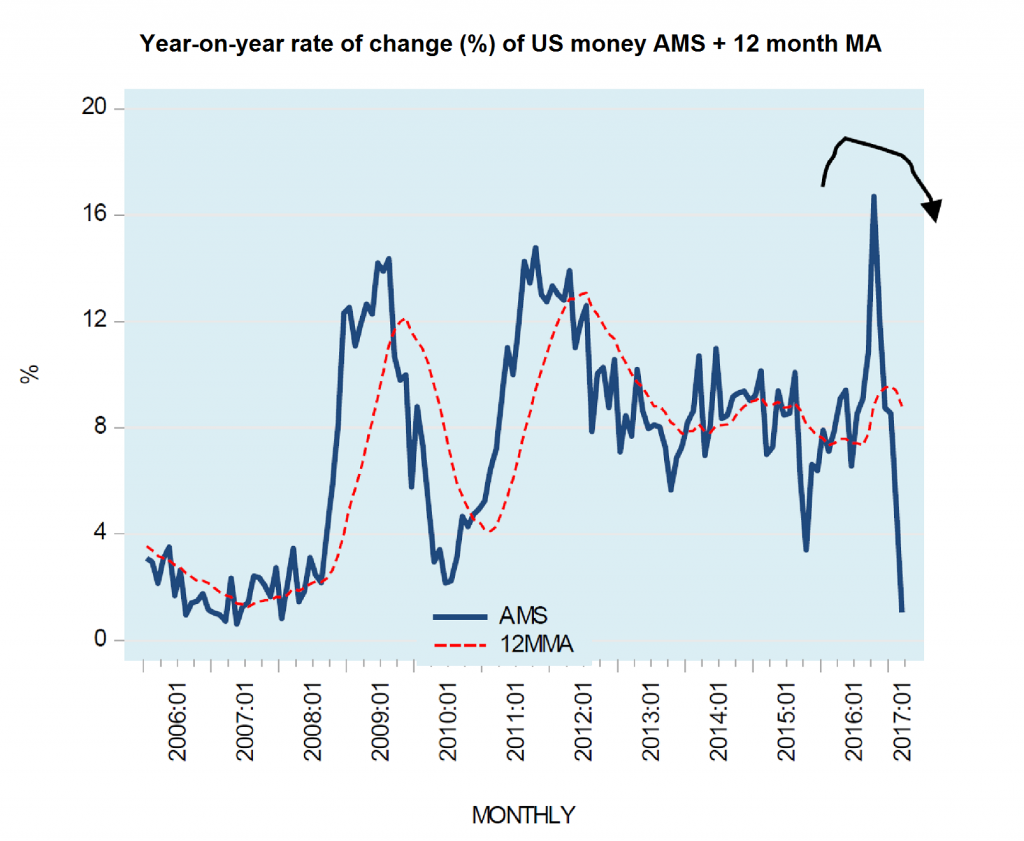 A swift collapse in the y/y growth rate of money AMS to levels last seen in 2007 – i.e., right around the time when the last bubble peaked. - Click to enlarge |
Asymmetric Central Bank Policy
If and when free liquidity is choked off to a sufficient extent, the bubble in risk assets is definitely going to stumble. What will happen when this enormous bubble bursts? Our guess is that the entire financial and economic system will once again find itself on the very brink.
Perhaps banks will weather a systemic seizure better this time around, as a much larger percentage of their deposit liabilities consists of covered money substitutes due to QE. Moreover, they have taken quite a few measures to bolster their capital – but that is a bridge we will cross when we get there. What is important with respect to gold is this:
Gold is an asset that isn’t offset by a corresponding liability, i.e., it is not dependent on any counter-party promises. Thus it becomes the go-to asset in times of systemic crisis. In terms of discounting the future, it also reflects the inevitable response of central banks to a bursting bubble. Keep in mind that the tightening of policy that puts an end to the further expansion of an asset bubble and the subsequent reopening of the liquidity spigots are always asymmetric.
When Paul Volcker tightened policy in 1979 to 1981, the true money supply fell by a small percentage in 1981 – but it expanded by nearly 50% y/y in 1982 after he began to lower rates. In fact, it doesn’t matter which period of tightening one compares with the subsequent period of loose monetary policy – the asymmetry is glaringly obvious every time.
Conclusion
Once central banks try to arrest a decline in asset prices and a contraction in aggregate economic activity, a great many of the fundamental drivers of the gold price that look neutral or even bearish at the moment will turn unequivocally bullish.
We can probably assume that market participants have learned from the experiences of the past two decades – which means that an early discounting of such future developments has become much more likely (whereas they were quite slow in responding to an obvious improvement in gold’s fundamentals in 2000– 2001).
That may also explain why the market-based measure of the “fundamental gold price” calculated by our friend Keith Weiner is currently at a far higher level than one would normally expect if one were to solely look at the macro-economic gold price drivers. What his indicator is essentially telling us is that someone is busy accumulating physical gold in the market place (reservation demand for bullion has presumably increased as well) in spite of the fact that the macro-economic fundamentals are not yet bullishly aligned.
Some market participants are probably taking out insurance against a variety of potential negative outcomes (even an unexpected surge in price inflation may be on the list of things that require guarding against). We happen to believe that the are likely to constitute what is generally known as “smart money”.
Charts by: BarChart, StockCharts, Frank Shostak / AASE
Full story here Are you the author?
Tags: central banks,Gold,newslettersent,Precious Metals,S&P 500 Index,The Stock Market