The main drivers for demand for Swiss francs are the Euro crisis, but even more the behavior of American investors, who go out of the dollar in the fear of further bad US economic data and in the fear of Quantitative Easing. This usually pushes down the dollar and inflation hedges like the Swiss franc and gold upwards. Since 2010, Quantitative Easing does nothing but to help the US consumer to continue deficit spending.
Most recent news
December 13th, 2012:
The Fed said it will buy $85 billion a month in long-term Treasury bonds and mortgage-backed securities next year. The latest stimulus will replace the “Operation Twist” program, in which the Fed has been buying about $45 billion of long-term Treasurys each month and selling the same amount of short-term Treasury bonds. source Marketwatch
Quantitative Easing
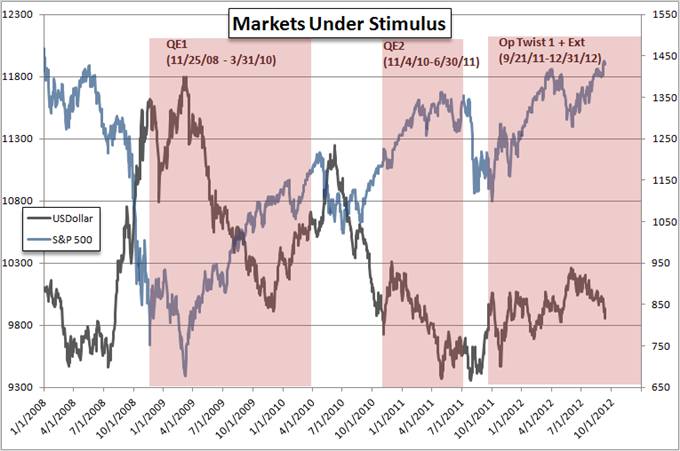
Quantitative Easing (QE) aims to reduce the liquidity trap companies and individuals face in a recession and to incite them to in vestment more and consume more, respectively. Central banks most often realize QE via open market operations, during which they acquire government bonds. The result is that banks have more cash for investments, market interest rates for firms are reduced, corporate bonds and stocks are relatively cheap compared with governments bonds and last but not least the local currency gets relatively cheap.
An overview is given in this graph from Zerohedge, originally from Credit Suisse. An additional indirect effect is left out: markets’ and firms’ expectations. It is probably the main effect desired by the Fed. After the easing, markets and sentiment of firms gets better.
Monetary easing in the United States vs. fiscal spending in Japan
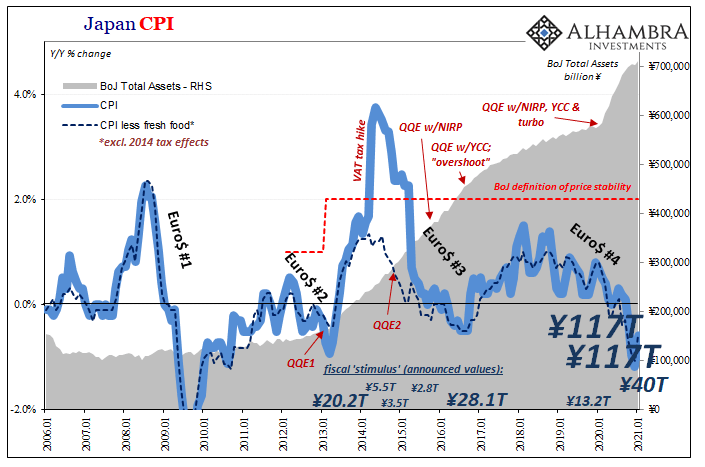
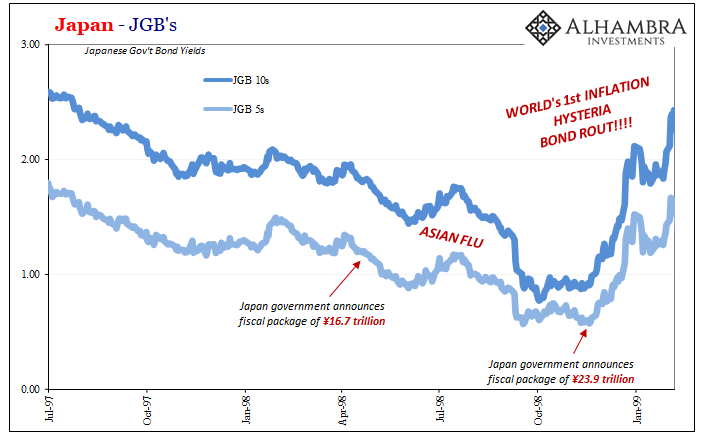
According to Richard Koo’s theory of the balance sheet recession, the disadvantage of QE is that it only works in “Yang” phases, namely when the propensity to consume is considerably higher than zero and companies want to maximize profit. Koo reckons that QE is completely useless during a “Yin” or “balance sheet recession” phase, because companies and individuals prefer to reduce their debt instead of borrowing more money, even when it is incredibly cheap. Instead the Japanese government needs to do fiscal spending.
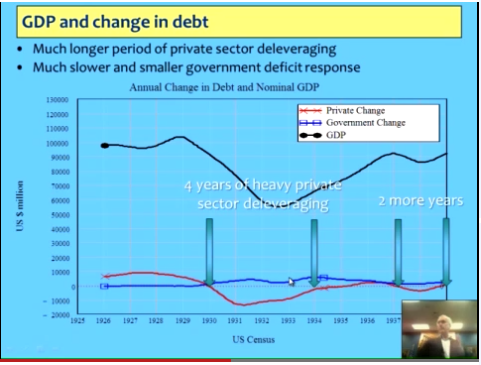
Koo’s argument were valid during the great depression, when the United States went into six years in delevaraging.
Recent data, however, have shown that, as opposed to Japanese (and probably also opposed to the Germans and the Swiss), the American consumers like deficit spending, even if they have a high debt load. Therefore the argument, that America might follow Japan into a deflationary cycle, is currently not valid. The question is if quantitative easing is really needed. According to Steve Keen, Americans need to delever and not have even higher debt. In 2010, the first deleveraging phase finished and both the US government and households have started to accumulate debt again, financed by Germany, Japan, China, and other emerging markets.
According to Steve Keen, this accumulation of debt, however, might lead to another crisis, when households delever again (like in 1936, in the second part of the great depression).
Government spending is usually financed by private savings (i.e. deleveraging). Therefore Steen says that the US government must continue spending, despite of the fiscal cliff.
John B. Taylor said in June 2011 that the QE1 was necessary to fight the panic in 2008/2009, but QE2 was far overblown. He says that the US is in a balance sheet recession. As opposed to Koo, he thought that inflation will pick up again, whereas Koo (and we) are of the opinion that in the United States low inflation will continue.
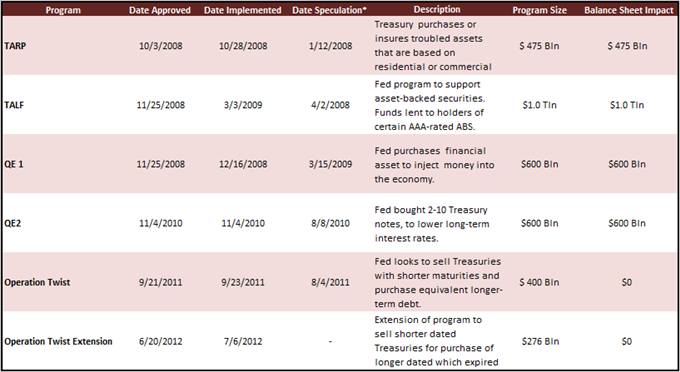
History of the Fed’s quantitative easing
The following are the previous programs of quantitative easing in the United States:
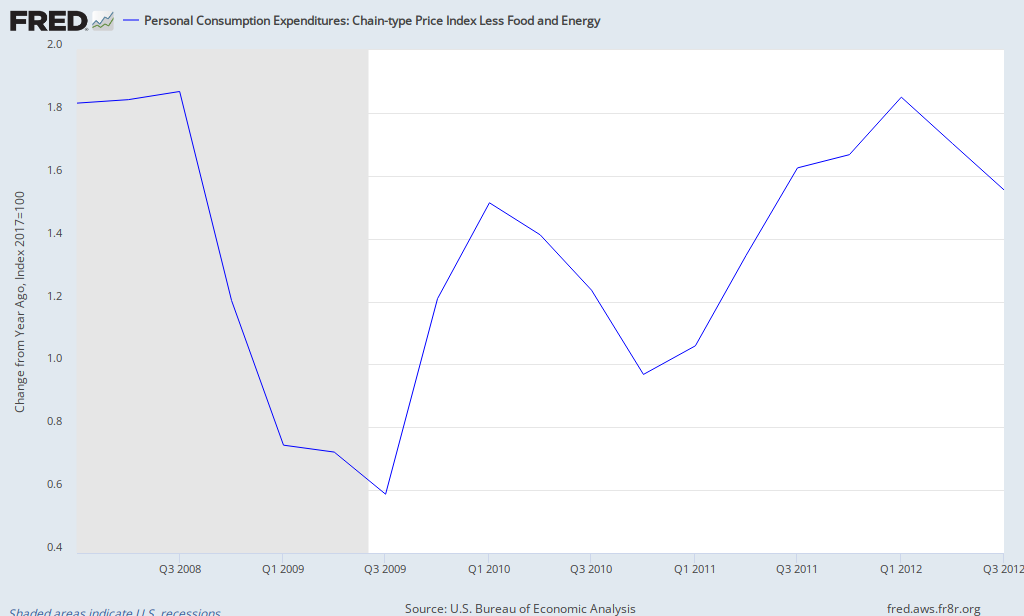
QE Indicators: Core PCE and Core CPI
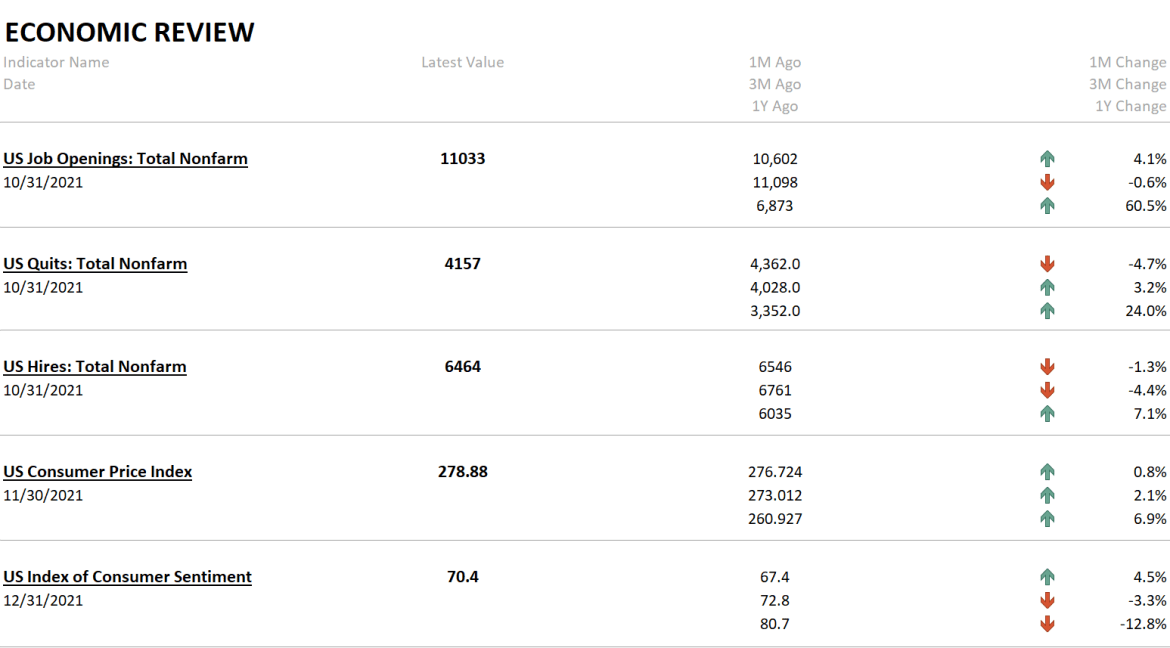
For the Fed the most important indicator is the deflator of the GDP component “Personal Consumption Expenditure” excluding food & energy (Core PCE). The latest data is only provided with the Q2 GDP release. With the Q3 GDP the indicator stood at 1.7%, a higher than at QE2 time, in September 2010, with 1.3%.
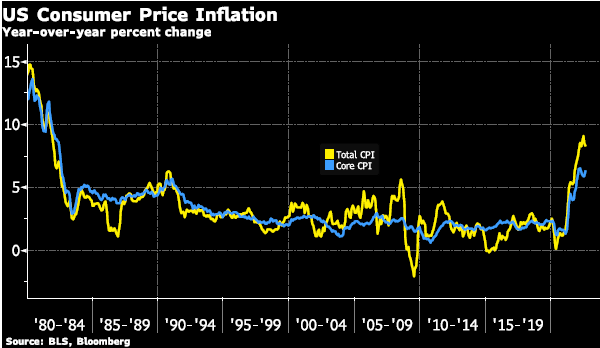
The Core CPI inflation at 2% is currently higher than the Core PCE inflation.
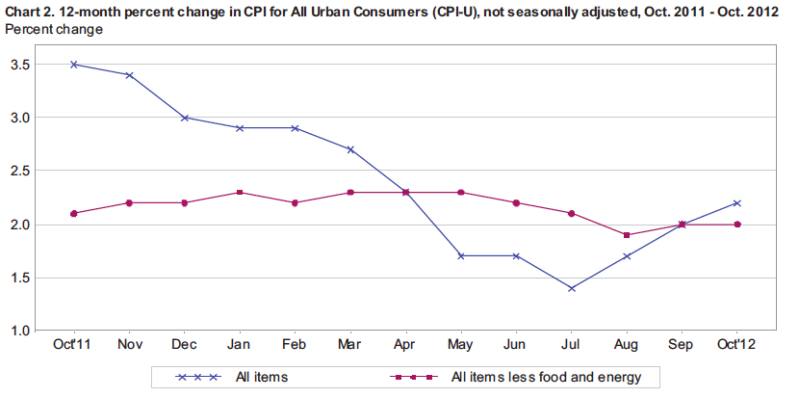
US CPI October 2012 (Source BLS)
Other Quantitative Easing Indicators
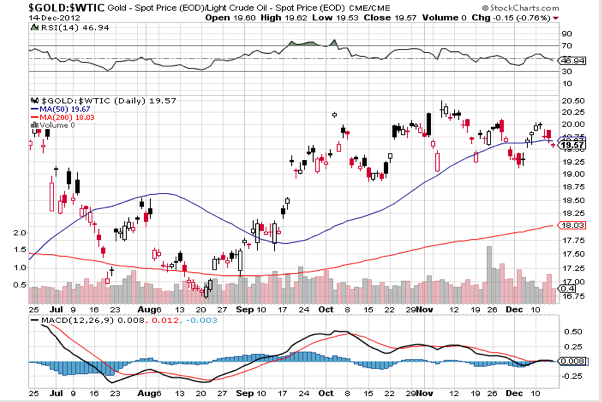
A rising gold-crude ratio (MA50) is an indicator for weak global and US growth, disinflation and an upcoming Quantitative Easing. Since May 7 this ratio is increasing. May 7 also coincides with the start of strong inflows into the Swiss franc. During September the gold-crude ratio has fallen again in the hope of big effects of monetary easing. Since then gold has been rising, but crude is reluctant to follow.
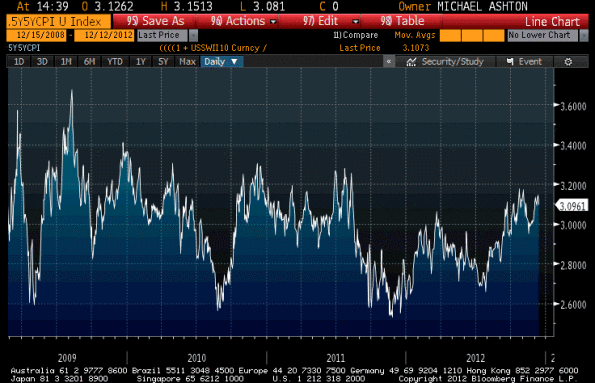
The Five year, Five year forward, Fed’s Fav represents inflation expectations derived from treasury inflation-procted securities (TIPS). The graph below appeared in the WSJ in June and is compared with Bloomberg data by now. Usually the Fed intervenes when inflation expectations are extremely low. Currently this is not the case.
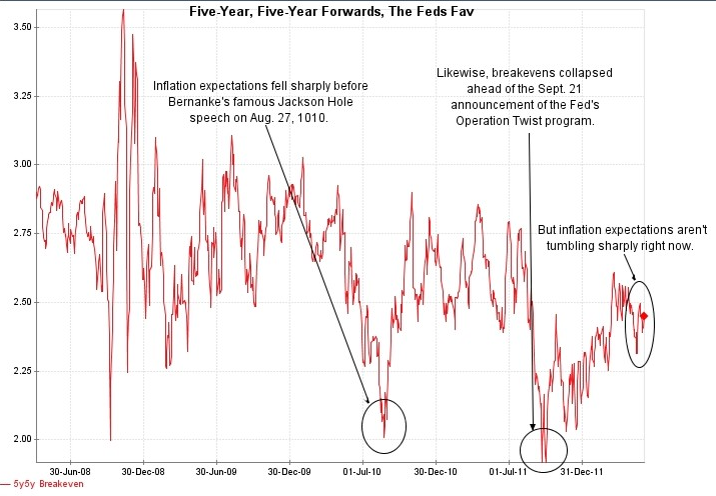
Fed's Fav Inflation Expectations ( hef="http://blogs.wsj.com/marketbeat/2012/06/05/betting-on-qe3-not-so-fast/">source Wall Street Journal) - Click to enlarge
Tags: Fiscal spending,QE3,Quantitative Easing,U.S. Consumer Price Index


