Composition of SNB Forex Reserves, Q3 2012
After the ECB and the Fed promised monetary easing, the SNB used the moment to exchange the euros into the dollar and pound at prices of 1.30 US$ and more.
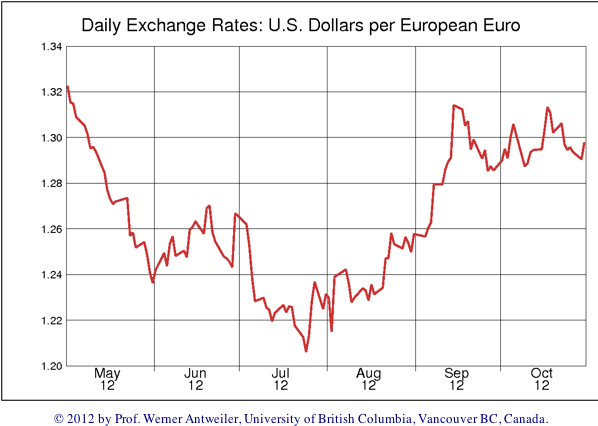
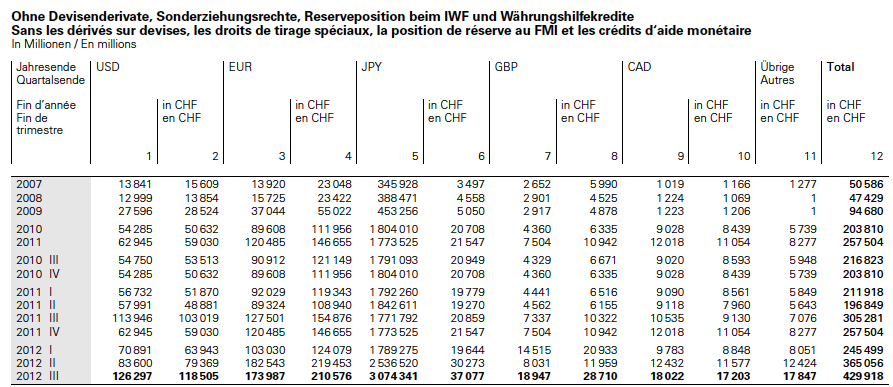
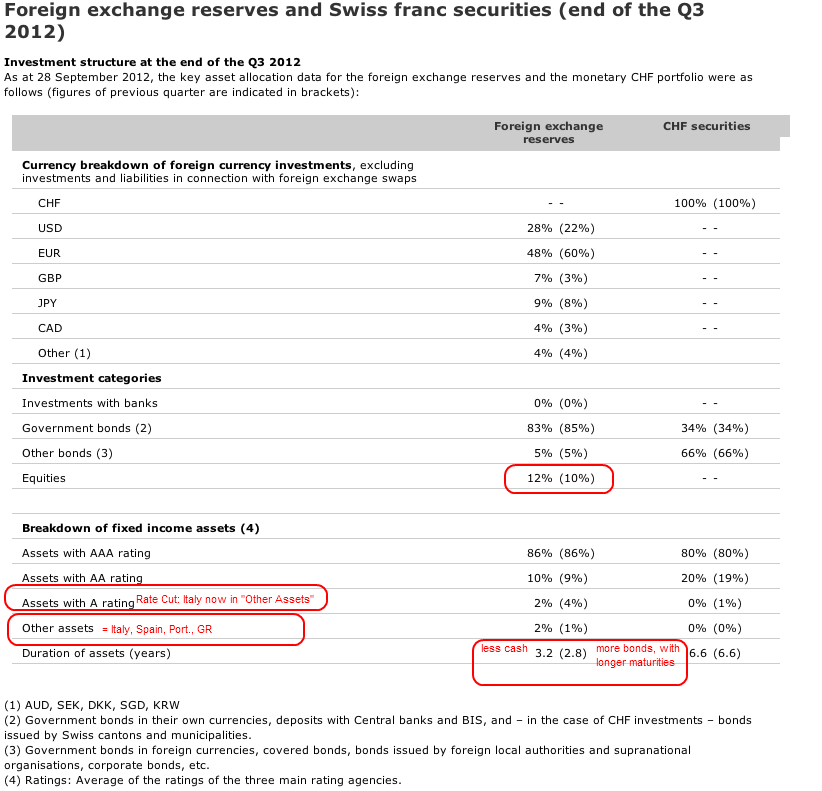
The central bank reduced the share of euros in the third quarter substantially from 60% in Q2 to 48% and increased dollar and pound positions. The SNB bought 80 billion euros when the common currency was trading around 1.24$, especially at the end of May and in June (see “2012 II” figures below). Given that the euro was even cheaper against the dollar in July and that the SNB was probably informed about the upcoming monetary easing of other central banks, we think that it added even more euros in July.
Therefore we reckon that a big part of the additional 50 billion CHF forex reserves in July went into the euro, possibly up to 31 billion €, a point that could be proven by the huge SNB Forex trading profit in Q3.
(click to expand)
But after the ECB and the Fed promised monetary easing, the SNB used the moment to exchange many euros into the dollar and the pound at prices of around 1.30 US$. It bought at least 43 billion dollars and 10 billion pounds in the third quarter (see “2012 III” above), but reduced euro holdings by 9 billion €. Considering more big SNB euro purchases in July, the real number might be far more elevated and could reach 40 billion euros sold (9 billon according to the Q3 data plus 31 billion bought in July and resold later). Therefore it might have bought 70 billion dollars bought between the beginning of August and the end of September.
Nomura even speaks of euros sold with the value of 76 billion CHF.
Based on the 5% difference between EUR/USD 1.24 and 1.30 and 40 billion euros exchanged into dollars and pounds, we judge that the SNB made trading gains of 2 billion €, a big part of the 5.2 billion CHF foreign exchange rate income in Q3/2012.
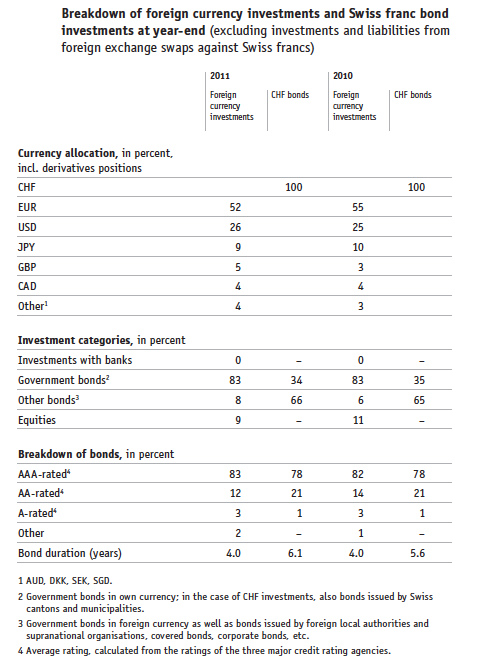
This page at the SNB shows exactly how the currency reserves are invested.
Breakdown by Currencies
The decomposition shows that the SNB currently underweights euro positions even against Q1/2012, the 2011 percentage of 52% and the 2010 value of 55 (see below). And the reason is not that the euro is currently extraordinarily cheap against the dollar, like in Q2/2012. In both year-end 2010 and year-end 2011 EUR/USD traded around 1.30.
(click to expand)
Q3 Decomposition in Currencies, Ratings and Asset Classes
Despite a better mood for peripheral bonds, the central bank cut the share of lower ratings (below AA) from 5% in Q2 to 4% in Q3. They might have sold Italian and Spanish bonds in the europhoria of September.
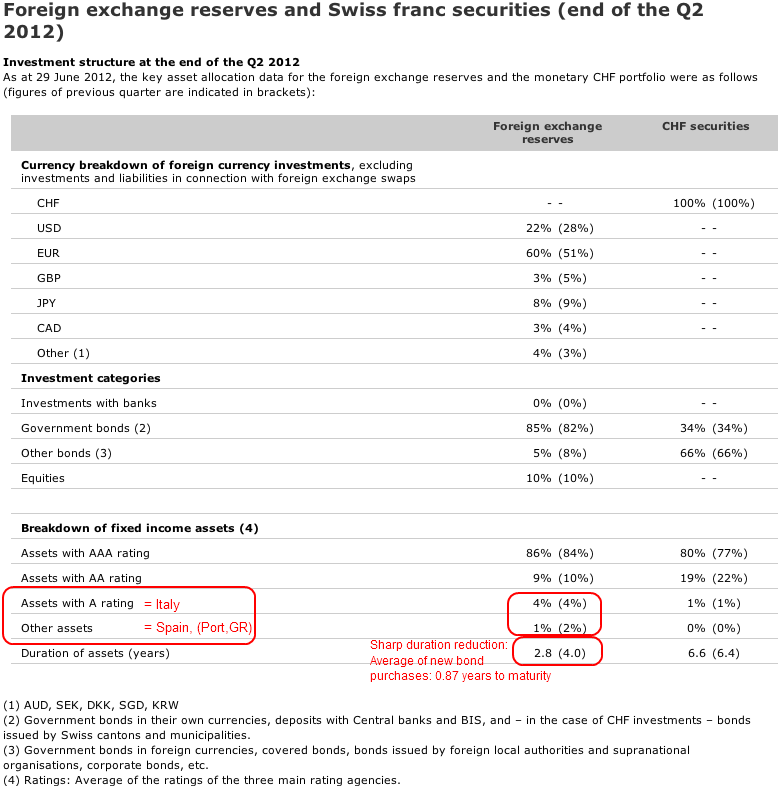
Decomposition at the end of Q2 2012
In the second quarter the SNB maintained the share of A-rated bonds. The major European country with an A-rating was Italy. Given that the central bank purchases many euro-denominated bonds, it also bought A-rated bonds for a share of 4%.
Either by price reduction or because the SNB did not buy them, the share of “Other Assets”, those with a rating under “A” decreased. The major European country with a rating below A was Spain.
Spain was downgraded to BBB (by Moody’s, Fitch, and Standard & Poor’s) before the end of Q2, for the SNB’s “Other Assets”. Moody’s downgraded Italy to under A rating only in July, Standard & Poor’s carried out this step earlier. Fitch currently maintains its A- rating. By common practice, the SNB kept Italy in its category “A ratings” until the end of Q2. (For the BIS rating comparison among the three providers see here.)
Investment structure at the end of 2011
Seigniorage Effect
The central bank has reduced the duration to 3.2 years, reduced her risks, but also lowered the seigniorage effect.
Given an average duration of four years for fixed-rate investments and an equity quota of 9%, interest rate risk and share price risk, by contrast, contributed very little to total risk.
(source SNB Annual Report 2011, page 68)
Tags: decomposition,Duration,equities,Forex reserves,FX reserves,Government Bonds,profit,Rating,Reserves,results,Seigniorage,SNB asset allocation,Swiss National Bank


