We judge that we will see seven lean years between 2011 and around 2017 in the global economy. This “negative part” of the biblical Joseph cycle, named also “Great Stagnation”, started in the United States already in 2007.
This weak part follows the fat years between 2002 and 2010. The fat years got only briefly interrupted by the trigger of the Great Stagnation. The trigger is sometimes called “Great Recession”. Given that already in 2010, global growth was strong again, there are no merits to use the word “Great Recession” and, if so then only applied to the United States. Alternatively, the strong global growth phase between 2008 and 2011 might only be caused by Fed excessive intervention, finally only an illusion.
We think that the reduction of debt, the hunt on the wealthy and the investment into countries with low debt will become the leading rational expectation and therefore the determinant of the next financial cycle between 2011 and 2017.
With the tapering fears in summer 2013, emerging markets are at the forefront of the debt reduction cycle, because many of them are dependent on investment flows from developed economies.
Emerging markets were able to generate strong growth thanks to funds exiting the United States still until 2011; but his has changed.
We judge that a new Joseph cycle has started in 2011 during which consumers and firms prefer to reduce debt and limit spending and investments. The U.S. started this negative part of the credit cycle already in 2007.By 2011 Europe and the emerging markets started de-leveraging or lower growth. Inflation in both emerging and developed markets arrived at new lows.
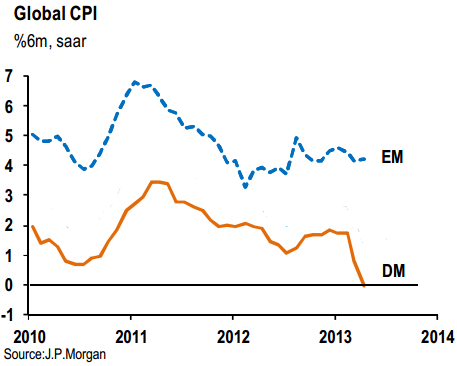
Inflation Emerging Markets and Developed Markets 2010-2013 (source)
Thanks to generous quantitative easing by the Fed, the U.S. might be the first to exit the debt cycle in 2013.
Germany, Switzerland and Japan are the countries that have not participated in the run to more debt until 2008. They have got into a boom phase of the credit cycle already since 2009/2010.
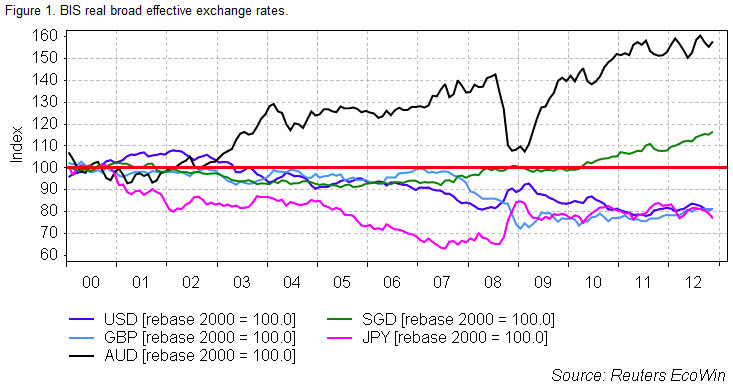
Between the year 2002 and 2007/2008 the Australian dollar, British pound, the euro and the US dollar (only between 2005 and 2006) appreciated, especially against the Japanese yen and the Swiss franc. The period was also called “carry trade“, when cheap financing – or commonly called “debt” – in yen or francs allowed to invest in other assets, very often real estate or commodities.
During that phase investors and ordinary people followed certain rational expectations – that ex-ante seemed to be reasonable and even were proven by econometric models and confirmed by rating agencies. Ex-post they can be called “animal spirits“, which implies that the previous rational expectations were not that “rational”. In this case the finally wrong expectation was that US., Spanish or Irish real estate prices must always appreciate and that it is possible to spend based on this “artificial value”.
A similar phase happened between 2009 and 2011/2012 with China and emerging markets: once the US Federal Reserve provided cheap money, that flew out of the U.S.
Rational expectations lead to so-called “financial cycles” by one of the leading authors, Claudio Borio of the Bank of International Settlement (BIS), because of the repercussions on financial markets. Another type of rational expectations, namely high inflation expectations led to other financial cycles, the Great Inflation during the 1970s.
Since both the positive and the negative phases of a financial cycles take around seven years, financial cycles are sometimes called “Joseph cycle“, from the biblical prophet Joseph that speaks of seven fat and seven lean years. The financial cycle connected to expectations about real estate prices, is also called credit cycle. See more details on our page on financial cycles.
After the bust of dot com bubble in 2001, the Fed lowered interest rates. Credit was easily available and private debt strongly increased. Government debt remained relatively stable.
Only in few countries like Germany, Japan or Switzerland people were far more cautious, because they had seen a real estate bubble bust in the 1990s. The leveraging phase finally ended in 2011, in China and in some other emerging markets. With the European debt crisis the global public opinion and rational expectations have become very susceptible to increasing debt further.
We think that the reduction of debt will continue to be the main driver of global economies during the next Joseph cycle, in the next seven years. After the US lowered debt levels until 2011/2012 it is now time for Europe (except Germany and Switzerland) and Emerging Markets.
The reasons for the accumulation of debt
SNB’s Jean-Pierre Danthine shows the sharp increase of the credit to GDP ratio in several countries. Apart from that animal spirit; for him the reasons were:
- Improved credit access due to structural reduction of supply side constraints (financial liberalization, innovation)
- Structural increase in credit demand (e.g. growth opportunities, cultural changes or demographic shift)
- Extended period of low interest rate
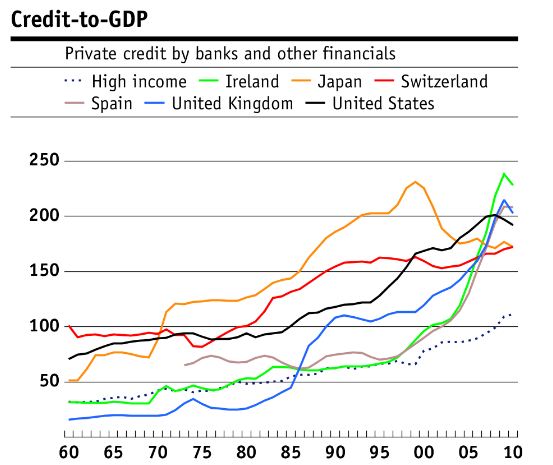
Source SNB
Debt, the basis
In particular, foreign debt reduces GDP growth. The protagonists of this theory are Reinhard and Rogoff. They proved a link between debt and growth:
In a new paper presented Monday at the annual meeting of the American Economic Association, Carmen Reinhart of the University of Maryland and Kenneth Rogoff of Harvard study the link between different levels of debt and countries’ economic growth over the last two centuries. One finding: Countries with a gross public debt debt exceeding about 90% of annual economic output tended to grow a lot more slowly. For advanced countries above the 90% threshold, average annual growth was about two percentage points lower than for countries with public debt of less than 30% of GDP.
The results are particularly relevant at a time when debt levels in the U.S. and other countries at the center of the financial crisis are rapidly approaching the 90% threshold. Gross government debt in the U.S., for example, stood at 85% of GDP in 2009 and will reach 108% of GDP by 2014, according to IMF projections. The U.K.’s gross government debt stood at 69% of GDP in 2009 and is expected to reach 98% of GDP by 2013.
“If history is any guide,” the rising government debt “is very troubling for the U.S. and other advanced economies,” says Ms. Reinhart.
The relationship between government debt burdens and growth is even stronger for emerging-market economies, Ms. Reinhart and Mr. Rogoff find. For countries above the 90% threshold, average annual growth was about three percentage points lower than for countries with public debt of less than 30% of GDP. The countries above the threshold also experienced much higher inflation: prices rose more than twice as fast as in countries with small debt burdens. (source WSJ)
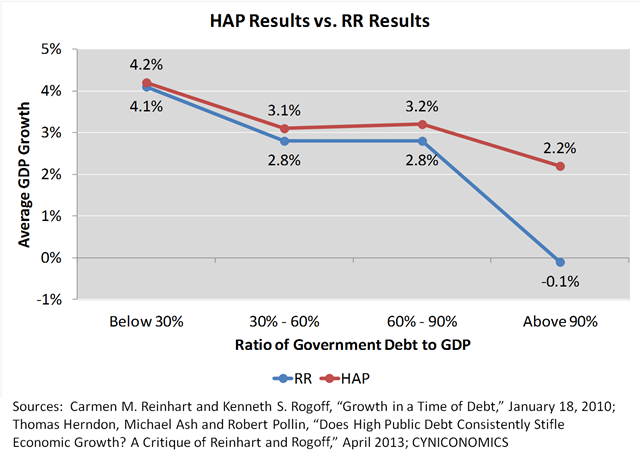
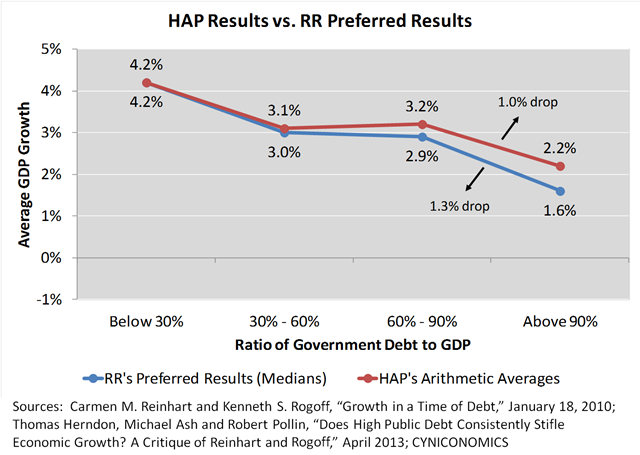
Most recently Reinhart/Rogoff’s theory (RR) got critized by group of researchers commonly called “HAP”, RR’s theory actually contained some calculation errors.
“RR never presented 90% as a magic number – where 89.9 is a clear, sunny day and 90.1 a class 5 hurricane – nor did they neglect to recognize that correlation is not causation. (full source). Also the median values should be used instead of the mean.
Foreign Debt
High levels of foreign debt are costly; often interest rates are higher than for a country with a low level of foreign debt. In our “What drives government bond yields” we explain why.
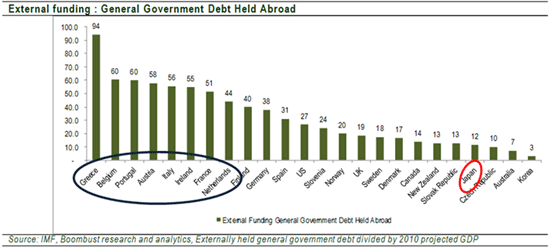
The following graph shows the holdings of government bond abroad.

Check here for Roggoff's Reinhard's book.
The following graph from McKinsey shows the composition of total debt, government, households and financial debt for different countries:
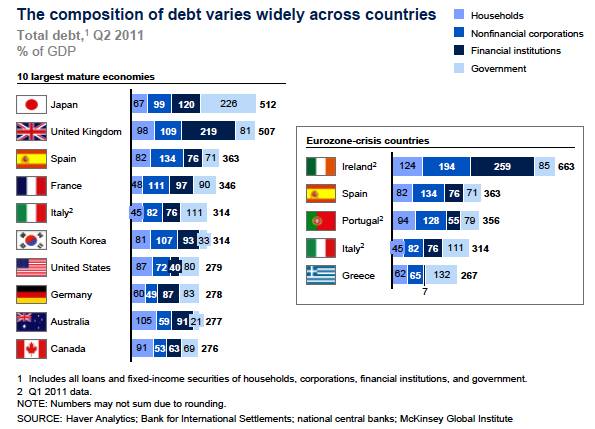
Between 2011 and 2017, the reduction of debt , the hunt on the rich and investment into countries with low debt will become the main rational expectation and the determinant of the next financial cycle. - Click to enlarge
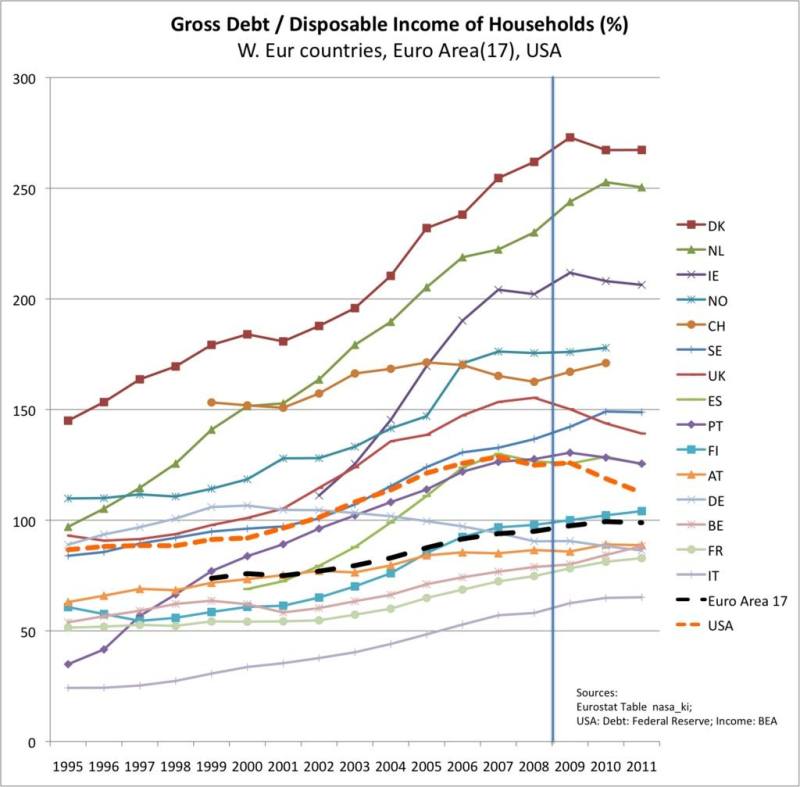
This is the development since 1995 of household debt compared with disposable income for different countries:
Strong growth wipes out debt
There are also voices that we urgently need stronger growth to reduce debt.
A ballpark estimate suggests that if the economy were to grow one percentage point more than expected in each year over the next 10, the deficit would shrink by more than $3 trillion. That would be more than enough to set the ratio of our debt to our annual economic output on a comforting downward trajectory. Moreover, it would happen without making cuts to a single program, like Medicare or food stamps, or without raising a single dollar of additional tax revenue. source
The answer of central banks is fiscal spending and easing money. Easing money and pumping up asset prices artificially helps that household reduce their savings rate. As we explain in “The misleading concept called GDP“, less savings translates into higher GDP.
Unfortunately consumers and firms are obsessed with reducing debt and do not spend.
Investors have lost confidence in economists
Tomáš Sedláček, a czech economist, mantains that during the period between 1998 and 2007 the world economy got distorted by financial markets. Greece, that was already 2007 bankrupt, could borrow at 4.22%. Spain could run a huge current account deficit without being punished by financial markets.
Economists were not able to predict neither the US real estate bubble nor the financial crisis nor the euro crisis, even if many evidences were completely obvious. Many investors do not trust the economists any more.
The new financial cycle and the times of low growth
Due to the desperate debt situation with debt over the 90% Reinhard/Roggoff 90% threshold in many countries and continuing austerity measures, we estimate that the second part of the financial cycle might take more than the usual seven years.
Adults under 35 reduced credit card, car, and home loans.
From FORTUNE – Since the Great Recession, countless Americans have shunned the idea of taking on more debt. Homeowners discovered that stretching to buy bigger houses would result in years of financial turmoil. Jobless college grads unable to pay down their student loans now wonder if their degrees are really worth it. And as Europe grapples with its own debt problems, Washington lawmakers struggle to find a way to reduce the U.S. deficit.
Indeed, many have learned a few harsh lessons. But debt isn’t always a bad thing. More of it can reflect a healthy economy — one where consumers, as well as lenders feel comfortable taking on more risks.
Young adults, however, haven’t taken on nearly as much debt as their parents. It’s uncertain if the trend will continue as the economy improves, but for now, those under 35 years old have shed debt faster than older ones, according to a report by Pew Research Center released last week. The study doesn’t say if this is a good or bad development, but many signs suggest the drop means Millenials are more anxious than responsible about their finances….
Across households headed by people under 35 years old, median debt fell by 29% to $15,473 in 2010, compared with $22,000 in 2007, according to the report. That compares with a much smaller 8% drop at households headed by those 35 and older during the same period.
To be sure, the decline partly reflects a fall in home loans and purchases by young adults. This doesn’t necessarily signal that younger people aren’t able to afford a house, since many have been delaying marriage (which is typically followed by homeownership) for various reasons. However, the share of first-time homebuyers typically comprised of young adults has fallen. And young people are less willing to take on credit card debt and auto loans, suggesting they aren’t in financial positions to commit to monthly payments. Compared with 50% in 2001, only 39% of young households in 2010 had credit card debt. When it comes to vehicles, 73% of households headed by an adult younger than 25 years old in 2001 owned or leased at least one vehicle. By 2011, that share fell to 66%.
What’s maybe most perplexing is that student debt has increased while all other consumer loans fell. Still, roughly three-quarters of household debt for young adults comes from home loans; student debt makes up only 15%.
The study’s results are similar to other research looking at the finances of young adults. In a 2012 Rutgers University survey of college graduates, 40% said student debt was making them delay large-scale purchases, such as a house or a car. Faced with big monthly payments, recent college graduates aren’t earning as much as graduates before them. The median salary for those graduating between 2009 and 2011 was $27,000 — $3,000 less than 2007. The difference is significant. It could mean having enough to help with a down payment on a home or spending money for everything from clothes and furniture.
For now, the no-debt Millenials have spawned a generation that rents most everything.
Printing money can only distort the financial cycle and create artificial short-term boom-bust cycles that even make the debt situation even worse with additional private debt. Recent examples for this additional private debt are the real-estate bubbles in China, Brazil or Russia that were financed with the Fed’s Quantitative Easing 2 operation and extreme state subsidies (in the case of Russia).
During the second part of this cycle, the indebted countries will try to obtain a debt relieve. The three most common ways are
- austerity measures, that imply a reduction of consumer demand and limit growth further
- higher taxes on wealth and the wealthy, which results into an exodus of many rich
- haircuts on government bonds, like happened already for Greece.
Countries with low debt and with strong current accounts will be able to maintain the living standards of their population thanks to low borrowing costs and more and more immigration of wealthy citizens from the indebted states. Some examples of these states with low public debt are Switzerland, Norway, Sweden and Singapore. Switzerland is among them the only one with low private debt compared to their wealth.
The US Tea Party or Kyle Bass are at the forefront of people who think that the next financial cycle will be the one of debt reduction. He thinks that even countries like the US or Japan that finance their debt by local investors, might go bankrupt.
In a new investor letter — posted on ZeroHedge — Kyle Bass takes aim at critics who think that Japan (or the US, presumably) can create money at will, and not have to worry about their burgeoning national debt loads.
The fallacy of the belief that countries that print their own currency are immune to sovereign crisis will be disproven in the coming months and years. Those that treat this belief as axiomatic will most likely be the biggest losers. A handful of investors and asset managers have recently discussed an emerging school of thought, which postulates that countries, as the sole manufacturer of their currency, can never become insolvent, and in this sense, governments are not dependent on credit markets to remain fiscally operational. It is precisely this line of thinking which will ultimately lead the sheep to slaughter.
(source Business Insider)
We are not of the same opinion, at least for now. We judge that for countries like Japan or the U.S. inflation is the most important criterion; and due to slow growth, bond yields will remain low (see more) in the next cycle.
Later, it is fairly possible that the U.S. expands its fiscal deficit excessively in order to stabilize private demand and foster full employment. But in this case the current account deficit and a weakening dollar will increase oil prices and could eventually create a wage-price-spiral just the in the 1970s.
Marc Faber : The rich will suffer
- The income inequalities have become far larger than 20 or 30 years ago
- Only a few rich take profit of money printing. It does not help the majority.
- In between five to ten years time, there will be a rebellion of the masses against central bankers and the monetary system will need to be reorganized.
Read about the repercussion of debt reduction on the EUR/CHF exchange rate.


