


George Dorgan
My articles My siteAbout meMy videosMy books
Follow on:LinkedINTwitterSeeking Alpha
CFA SocietyEconomicBlogs
The years since the 1990s have exacerbated big differences between the rich and the poor. Failed monetary policy only helped sustain these differences.

History of income share per group (click to expand)

click to expand
Stock, real estate and commodity prices strongly rose in a sequence of bubbles and then fell again in busts.
The ones taking profit from the price increases, selling early enough, were the rich informed investors, whereas people with a small amount of wealth often remained with negative equity or had losses.
Bankers tried everything to maximize their profits and bonuses, including an outright libor fraud against home-owners. Economists created flawed economic models to support the bankers and get a piece of the cake (video). Economists needed to be mathematicians rather than logical thinkers that understand global economic and political developments.
Eleven years of failed monetary policy
Central bankers and economists (here the Bank of England) finally admitted that all their theories and models were deeply flawed and do not correspond to reality. David Viniar, Goldman’s CFO, said in 2008:
“We were seeing things that were 25–standard–deviation events, several days in a row.”
Or like Brad De Long, a professor at Berkeley, accused here the mainstream economists:
The major complaint seems to me to be my list of economists I find worth listening to: “Paul Krugman, Christy Romer, Gary Gorton, Carmen Reinhart, Ken Rogoff, Raghuram Rajan, Larry Summers, Barry Eichengreen, Olivier Blanchard, and their peers.” Well, Larry, Barry, and Olivier taught me this stuff, so they are on the list. Larry, Christy, and Olivier have been the senior government policymakers leading the charge for more and better expansionary policies. Raghu, Paul, Barry, and Gary called the dangers of the leveraged housing bubble early. Barry, Ken, and Carmen have been thinking very hard about the dangers of a long-term depression generated by a financial panic for a long time. All are very much worth listening to.
The Swiss National Bank was one of the worst of them, selling its gold for a bargain between 300 and 500 US$, artificially depressing its currency between 2003 and 2008 and making its exporters reliant on a cheap franc. During these years central banks used an interest targeting model with far too low interest rates, which allowed for huge misallocation of resources. Since 9/11 monetary policy around the world followed the Fed’s example and provided cheap money to create a monstrous misallocated real estate bubble.
The Dot-com Bubble
The first bubble was the dot-com bubble that was a direct result of the Asia crisis of 1997, when excessive debt in Thailand, Indonesia, Malaysia and the Philippines triggered big outflows out of Asia, back into the United States. Gas prices remained relatively low for a couple of years due to small investor interest and subdued global demand. Stock prices heated up on irrational exuberance on dot-com stocks, different taxation of capital gains and dividends additionally fueled the bubble, US consumers were happy thanks to cheap oil and big gains in their stock portfolios.
The bubble popped in 2000/2001 when right at its heart, the California electricity crisis arrived. Supply issues and global growth led gas prices to rise again and US consumers stopped spending. Investors realized their mis-pricing of internet stocks, banks were charged with fraud vs. their customers for misleading them to buy the overpriced stocks (below the NASDAQ).

Nasdaq bubble
The Sub-Prime Bubble
The real estate bubble in the United States, UK and other countries between 2002 and 2007 was the second bubble. Thanks to cheap mortgages and risky mortgage selling methods, house prices rose strongly, but wages could not keep up with these increases. For real estate developers and banks this meant big profits, bankers persuaded the ordinary Joe, especially sub primers, to take too expensive, unaffordable mortgages often without down payments. It was accompanied by a spending rush based on the artificial home prices. The following graph from the Swiss National Bank illustrates the explosion of house prices up to 500% in Ireland and Spain, whereas price increases in Germany (“AL”) and Switzerland (“CH”) remained moderate.

House prices 1990-2008 in IE, ES, GB, USA, Germany, CH
A Short History of Inflation

Click to expand
After the end of the gold standard in 1971 and the increase of US debt with the Vietnam war, a devaluation of the US dollar followed. Consequently the Arab states wanted higher prices for their oil. This was following by workers that wanted higher salaries for their labor.
The inflationary pressures ended up in an inflationary spiral over a period of 10 years, which could only be broken by extremely high interest rates introduced by the Fed’s president Volcker in 1982 and the world ended in a recession. Thanks to Volcker, inflation expectations eased in the 1980s and 1990s.
Together with Volcker’s changes in monetary policy, Reagan and Thatcher undertook many supply-side reforms. Due to these reforms and the increased global competition, unions lost their power. For these reasons, real wages in the developed countries, especially Europe, did not rise as they did before. Improved technology and changes in the calculation method also reduced consumer price inflation.
Consumer Price Inflation Targeting vs Asset Price Inflation and GDP growth
Having learned about their failures in the 1970s and early 1980s, central banks switched to consumer price inflation (CPI) targeting in the 1990s. Financial innovation that increased the velocity of money, without the implied corresponding rise in prices, seemed to contradict Irving Fisher’s Quantity Theory of Money, a basis of money supply targets. During the “great moderation” period until from 2002 to 2007 cheap imports from emerging markets helped to maintain inflation in developed nations low despite solid GDP growth.
Asset price inflation is the price change in assets an individual or a firm possesses. The basket of assets of an individual consists, in most countries, of mainly real estate, and to a smaller degree personal accounts, pensions, insurances and stock investments. Asset price inflation is often completely excluded from the CPI or it is only a minor criterion. A supposed proxy, the owners’ equivalent rent (OER) is excluded in many CPIs, here in the manual pages of the European HCPI.
“The exclusion of owner-occupied housing (OOH) in the Harmonised Index of Consumer Prices (HICP) is the major shortcoming in the coverage of this inflation indicator, and the most substantial difference between the HICP and European Union’s national consumer price.”
Or here the Italian CPI, in which rents account for only 2.7% of the CPI basket:
“Buying a home is a capital expenditure and not for consumption. However, in the calculation of consumer price indices are given the costs related to housing: water supply, electricity, fuel (gas, heating oil), expenses for repair and maintenance of the house (electrician, plumber, construction worker for compensation, tiles, taps, etc..) and expenses.”
OER is contained in the US CPI (24% owners’ equivalent vs. 6% tenant rent). Still the owner’s equivalent rent has a large part of utilities inside, but cannot reflect a bubble. However, replacing the OER with Case Shiller’s home prices in the CPI, would have led to the following, as Tim Iacono recognized in 2007:

Inflation based on Owner-Occupied Rent vs. Case Shiller (source Iacono Research)
‘First, in early 2002, when the Fed was worried about “deflation”, home prices were increasing at a healthy pace and had they been included in the CPI, it would have fallen to only two percent instead of one percent. The “deflation scare” wouldn’t have been so scary.
Second, in early 2004, while the Fed funds rate was still only one percent, home prices began to take off – the CPI would have been over seven percent using the Case-Shiller data instead of only about three percent with OER. ‘
Because of the myopic concentration on CPI inflation and not on asset price inflation or GDP growth, many central banks did not hike interest rates as appropriate. The Fed did not even respect their own former targets (Neutral Interest Theory/Taylor Rates), which build up its dual mandate. GDP growth is a secondary target for many central banks (see Fed’s mandate, SNB mandate), but strong GDP growth between 2003 and 2005 was neglected (see Brad DeLong).
Swiss monetary policy did not target the relative GDP growth differences between the euro zone and Switzerland. In the time of the global carry trade between 2004 and 2008 Swiss GDP growth was on average 0.5% stronger than the one in the Euro zone, which would have justified a higher Swiss interest rate than the ECB rate. However, the SNB left the interest rates mostly 0.75%, under the ECB rates, full details here.
In order to fight against the post dot-com crisis the Keynesian mastermind Krugman recommended in 2002 that the Fed should create a housing bubble. The 9/11 attacks gave a further push to the Fed’s aim to provide cheap money and create a new bubble.
The Eurozone Failed Monetary Policy: The Cheap Money Bubble
At the same time, the European Central Bank (ECB) kept interest rates artificially low to help Germany come out of its slow growth after reunification and its IT bubble (see below). Cheap money and affordable mortgages after the euro introduction created a consumption rush, unrealistic wage increases and a real estate bubble in Spain, Ireland and many other European countries. Only this spending rush, based on borrowed cheap money, could not hold this optimum currency area with completely different mentalities and economies together for a couple of years. 10 year government yields have returned to similar spreads as in 1993 (source).

10 yr. government bond yields 1993-2011 - Click to enlarge
However, from 2008 especially the PIIGS (Portugal, Ireland, Italy, Greece and Spain) were only left with consumer and banking debt. After Keynesian stimulus programs in 2009 and banking aids they ended up with a huge increase of government debt. Finally the imbalances in this strange currency area showed up and monetary policy was doomed to fail. The San Francisco Fed put the ECB dilemma into a Taylor rate picture (see below); Credit Suisse calculated in 2011 a Taylor rate of plus 4.5% for Germany and for Ireland, Spain or Greece one of minus 4.6%.

Taylor Rule core & periphery 2001-2011 (source San Francisco Fed)
Some central bank economists like Jürgen Stark or Axel Weber resigned because the ECB policy and the unsustainable euro currency area contradicted too many economic principles. After 2008 house prices in the European economies started to contract as follows:

RICS House prices since 2007
Based on data from the Economist, Lloyds Bank, Business Insider and Global Property Guide we have developed the following map about the current state of the European housing market in 2011 in real terms.
Rising vs. contracting real house prices in Europe 2010/2011
Countries in Balance Sheet Recession
Until 2005 three countries experienced something completely different, these were Japan, Germany and Switzerland. These countries lived a so-called “balance sheet recession” or “Yin” period, as the American-Taiwanese economist Richard Koo called it.
They were not in the spending rush based on artificially priced homes; their propensity to consume was far lower than the ones in bubble countries. Households and companies reduced debt, especially German firms tried to be more competitive with similar supply-side reforms as Reagan and Thatcher before. For German consumer the main principle was “Geiz ist Geil”, they tried to find the cheapest deals when they consumed.
The drivers were the bust of Japan’s 1980s bubble, the bust of the German dot com bubble, the bust of the Eastern German and the Swiss 1990s real estate bubbles. Additional labour supply from the former East Germany kept German wages low for a decade.
Germany and Japan are the first to exit the balance sheet recession – here the April 2008 version, when Koo thought that even China will live a balance sheet recession.
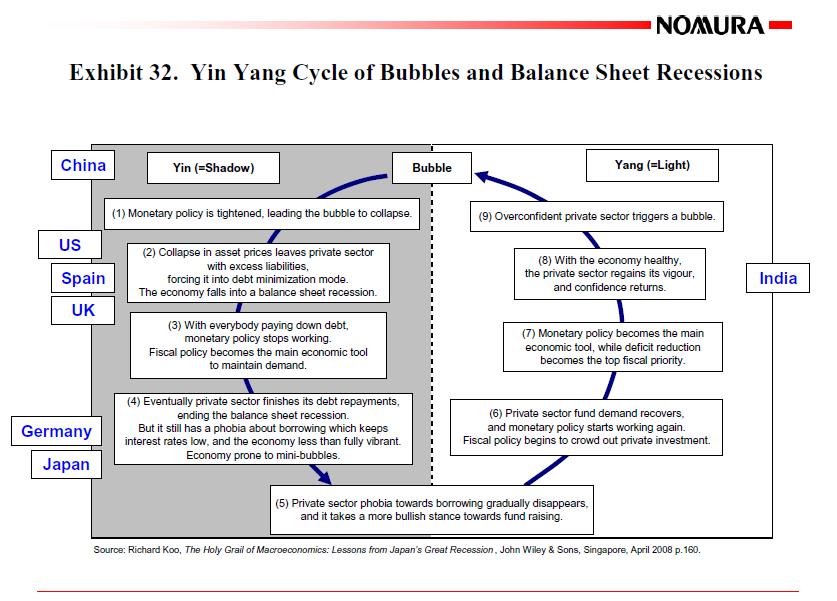
Ying Yang Cycle of Bubbles and Balance Sheet Recessions Richard Koo, 2008 version
Quantitative Easing and Fiscal vs. Monetary Stimulus
Quantitative Easing (QE) aims to reduce the liquidity trap companies and individuals face in a recession and to incite them to investment more and consume more, respectively. Central banks most often realize QE via open market operations, during which they acquire government bonds. The result is that banks have more cash for investments, market interest rates for firms are reduced, corporate bonds and stocks are relatively cheap compared with governments bonds and last but not least the local currency gets relatively cheap.
An overview is given in this graph from Credit Suisse, an additional indirect effect is left out: markets’ and firms’ expectations. After QE markets and sentiment of firms get better.

Quantitative Easing Mechanism (source Credit Suisse/Zerohedge)
According to Richard Koo’s theory of the balance sheet recession, the disadvantage of QE is that it only works in “Yang” phases, namely when the propensity to consume is considerably higher than zero and companies want to maximize profit. The US data of Q3/2012, however, have shown that, as opposed to Japanese (and probably also opposed to the Germans and the Swiss), the American consumers like deficit spending, even if they have a high debt load.
[tweet
Koo reckons that QE is completely useless during a “Yin” or “balance sheet recession” phase, because companies and individuals prefer to reduce their debt instead of borrowing more money, even when it is incredibly cheap.
John B. Taylor said in June 2011 that the QE1 was necessary to fight the panic in 2008/2009, but QE2 was far overblown. He says that the US is in a balance sheet recession. As opposed to Koo, he thought that inflation will pick up again, whereas Koo (and we) are of the opinion that in the United States low inflation will continue.
The Emerging Markets Bubble
The next bubble was the real-estate bubble of the Emerging Markets between 2007 and 2011. Especially China grew mainly based on the low US interest rates in 2007, a massive stimulus operation of the Chinese government in 2008, and the two US QE operations in 2008 and 2010 which triggered over-investment, big and often superfluous Chinese construction buildings financed with cheap US money and the help of continuous easing of the People’s Bank of China. Big US companies were actually not in a liquidity trap, but in a balance sheet recession and did not want the cheap money. Money made its way and flowed there where investors expected the highest return, namely into the Emerging Markets, which triggered hostile responses from these countries, calling the Fed policy “currency wars”.
Chinese home prices (source)

The China bubble (source stock-market-crash.net)
Brazilian home prices (source)

Brazil housing bubble (source bubblebubble.com)
Brazil and Russia, on the other hand, are two emerging markets where people already consume more than in China. Still Russia’s and Brazil’s richness and high consumption levels are based on their natural resources and on their own real estate bubble. By mid 2012 Chinese and Brazilian house prices have already started to contract, the deleveraging has started.
Russian home prices (source)

Russia housing bubble (source bubblebubble.com)
Russia started to counter its housing bust between 2008 and the beginning of 2011 via a state-subsidized home for war veterans and widows of WW2 KIA and since 2011 with subsidies of 23’000 US$ for young home-buyers, often 50% of the home price. This intervention has led again to a bubble with prices increases of 20% since mid 2011 in many regions (smaller price increases in Moscow).
The Commodity Price Bubble
Leveraged with cheap US dollar margin credits and based on the assumption that the exaggerated growth of the BRICS (see above) will continue for years and decades, commodity prices have risen 275% since 2001.

Commodities bubble (source bubblebubble.com)
Real Estate Bubbles in 2012
Even if many home prices have started to contract in many countries, real estate bubbles still exist in 2012. One example is Russia (see above). Norway, Finland, Austria, Switzerland, the city of London and to a lower extend Germany are still experiencing a real estate bubble (see details). These countries have full employment and/or benefit from money and labor inflows from the Southern European problem countries. The funds need to be invested. In times of low bond, stock market return and ever cheap interest rates, the best is real-estate. But, as opposed to before, house prices rise only in the countries where supposed demand is higher than supply and where the investment still seems safe. Only a handful of countries are left.
The Balance Sheet Recession has Come and Will Stay in the US, UK and the PIIGS

click to expand
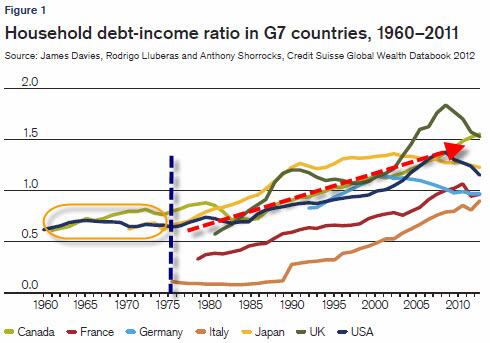
Koo’s balance sheet recession, the Yin phase, has already destroyed 38.8% of the US net worth between 2007 and 2010, after more than 18 years in a Yang phase. It will continue to stay for another 8-15 years in the US, UK and in the PIIGS.
This implies more years of disinflation, real wage reductions and austerity. The household debt deleveraging of 11% in the United States should continue till it reaches 30% (historical Swedish example, see graph below). Recent signs that the US housing market is recovering are for us misleading, because home-buyers react to cheaper gas prices and the winter improvement in labor due to warm weather. They react much later than stock markets and employers. Negative equity and less foreclosure sales are other reasons. Job creation will not grow, the strong US dollar does the rest.
This puts pressure on wages and therefore leaves no room for home-buyers’ investments. Recent signs that US spending is recovering are also misleading, because they are essentially deficit spending, because real incomes are increasing too slowly.
Despite QE3, that artificially propped prices, US home prices will need to go further down, from current 2003 levels to levels from around 1998.

Some more years to deleverage (source Mc Kinsey), click to expand
The contraction in house prices in Spain, Italy and France, however, has only started to become stronger. Central banks have managed to prevent a quicker fall, with cheap rates, but they only make the period of de-leveraging longer. In times of higher rates in the 1990s, the Swedish de-leveraging took seven years. In times of low rates it can take a lot longer.
At the latest the global housing bubble will bust when (wage) inflation picks up and central banks are forced to hike rates, the start of this wage inflation will be in China and come at the latest around the year 2020 to developed countries, when the baby boomers will retire.

Zero Inflation (source Ashraf Laidi)
The former Yin countries, Germany and Switzerland and later also Japan, will be in the Yang phase and will experience inflation in the coming years, in particular if SNB and BoJ depreciate their currencies. Since the year 2000 Japan and Germany reduced private debt (yin phase).
The Japanese savings rate, which was high during the balance sheet recession, the Yin phase, is falling now, in effect funds have returned to Japan and the long-awaited start of the dissaving process of the Japanese aging population.
For us, Switzerland may see higher inflation than the Euro zone in a couple of years, if the Swiss franc is not allowed to appreciate from the EUR/CHF floor. The Bank of Japan might hike interest rates earlier than the Fed, a thing which current high frequency trading algorithms do not incorporate. These algorithms associate falling stock prices with a rising Yen (even against the dollar).
The Japanese government has already started to counter one negative effect of the Yang phase: they raised taxes, because in a Yang phase the excessive debt accumulated in the Yin phase can become a problem, more tax rises might come. In the meantime, Japanse companies use the strong yen for acquisitions.
Our Proposal for a Euro Crisis Solution
See our analysis why a Northern Euro will be needed and potential ways to achieve it.
The gold standard has advantages, e.g. it can limit an asset bubble, but for us it is too strict. The Euro is very similar to the gold standard. Less competitive countries must be able to devalue their currency and obtain cheaper labor but they cannot if exchange rates are fixed. See more details in on our discussion on an Italian euro exit.
The Bubble and Bust Cycle in Summary and Synthesis
Future Monetary Policy
Our final conclusion is, that the price stability mandate of central banks must include both consumer price inflation and asset price inflation, as two independent and equally important criteria. An appropriate target would be 2% per year for the CPI and 5 or 6% per year for the Asset Price Index.
Monetary Policy for the SNB
For central banks with big safe-haven inflows like the SNB, the consideration of profitability must not be left out completely, like it seems to be currently.
Brinkmanship of a certain group of exporters was the reason that the EUR/CHF was set at 1.20. We reckon that a floor of 1.10 would have been sufficient in 2011. The result of this high level will be a central bank loss of 10-15% of GDP when inflation comes back, enough money to sustain far more than this group of exporters with huge state subsidies.
On the other side, the SNB must protect the Swiss economy and itself not only against a strong franc but also against a weak currency. Benchmarking against other countries is useful here, not only looking on local growth and Taylor rates.


1 comment
1 ping
John
2017-03-31 at 19:45 (UTC 2) Link to this comment
This site has an interesting take on the inflation debacle. So far if you look at what the markets have done, it seems to be quite accurate. However, I wonder if that will hold up over the long run. Here is an excerpt. would be interested in your views
As an investor you need to find investments that will rise at a faster rate than inflation; for example investing in key stocks at the right time leads to very high gains. Why do you think the markets have gone ballistic? After each disaster, central bankers have unleashed large loads of hot money into the market. A disaster can be viewed as something terrible or opportunity waiting to be discovered; it all depends on the angle of observance. As long as fiat exists market crashes will prove to be long-term buying opportunities- History clearly supports this view. http://tacticalinvestor.com/inflation-the-silent-killer-tax-thats-destroying-middle-class-america/
Tim Taylor Home Improvement Memes De Carmen | Best Home Improvement Design
2016-10-27 at 22:42 (UTC 2) Link to this comment
[…] 15 Years of Bubbles, Busts and Failed Monetary Policy – The major complaint seems to me to be my list of economists I find worth listening to: “Paul Krugman, Christy Romer, Gary Gorton, Carmen Reinhart … Case Shiller’s home prices in the CPI, would have led to the following, as Tim Iacono … […]