Home › 3) Swiss&Gold › 3a) Gold and its price: Monetary Metals › Seasonal Factors on Gold, the 19 February Short Trade
Seasonal Factors on Gold, the 19 February Short Trade
The End March to End May Long Gold got under severe pressure due to the
cyclical slowing of emerging markets and the recovery of the United States thanks to higher consumer spending and the Fed support of the housing market. Details.
The 2013 Trade
19 February: Entry at 1597,
End March: Lows 1322,
May 11: 1446
Shorting Gold on February 19,holding till mid-march
Although it is not a featured trade in the Commodity Trader’s Almanac 2013, shorting gold on or about February 19 and holding until mid-March is a trade setup that is included in our Commodity Seasonality: Top Percentage Plays on pages 124-127.
This short trade has a historical success rate of 63.2% since 1975 before this year’s likely successful trade is counted. |
 Gold came under pressure in early February when stock market strength but also U.S. gas prices rose. US purchases, however, help to improve foreign economies and therefore also the gold price. - Click to enlarge |
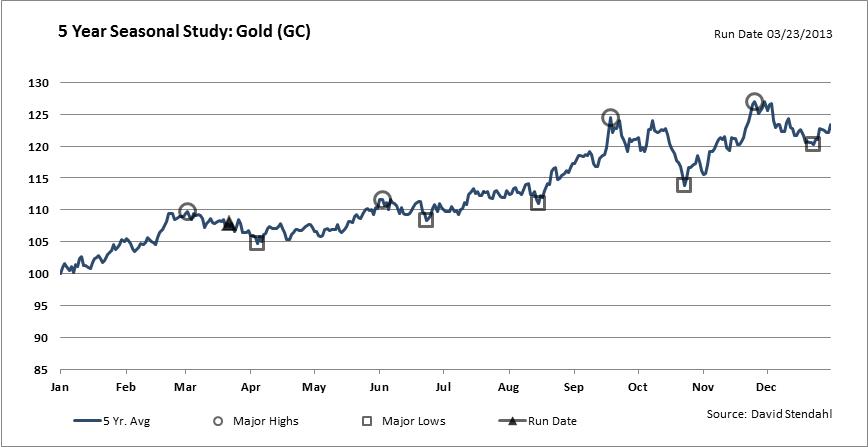
| As can be seen in the second chart above, gold has enjoyed a period of seasonal strength since 2001 that begins toward the end of March and lasts until late May (yellow shaded box). Last year this trade did not work. However, it has worked in nine of the last twelve for a theoretical cumulative single contract gain of $43,630. In the chart of SPDR Gold (GLD) above, relative strength is improving and MACD and stochastic indicators have recently issued confirming buy signals. Today’s Cyprus news is also benefiting gold and other safe haven assets. |
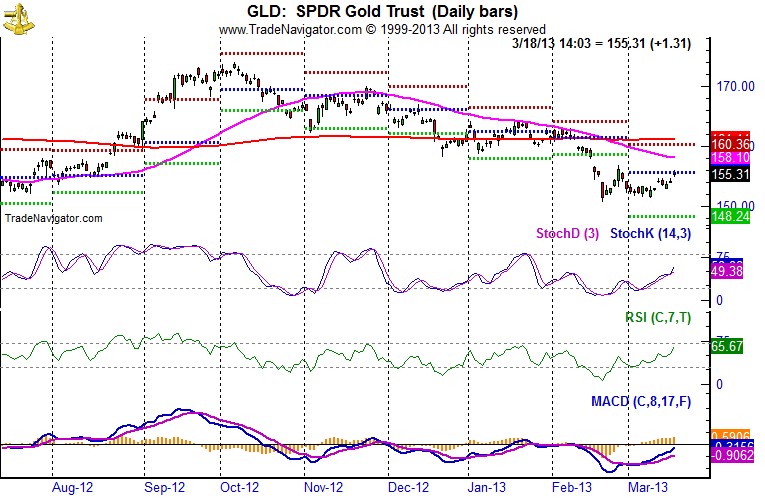 Gold came under pressure in early February when stock market strength but also U.S. gas prices rose. US purchases, however, help to improve foreign economies and therefore also the gold price. - Click to enlarge |
Weakness and strength points for gold
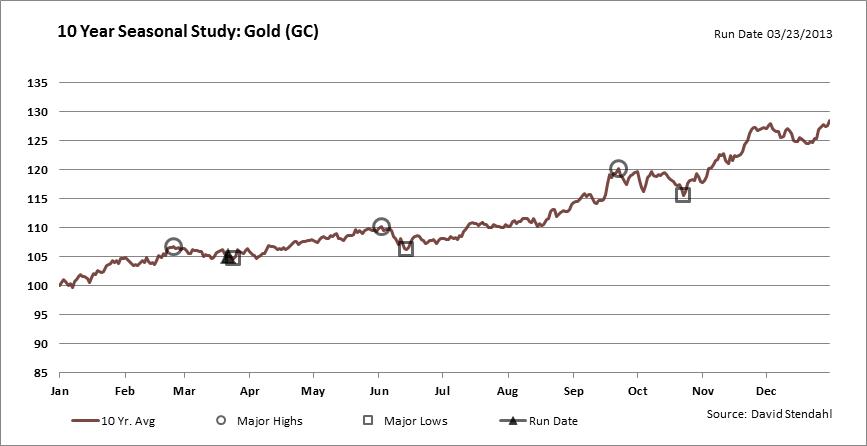
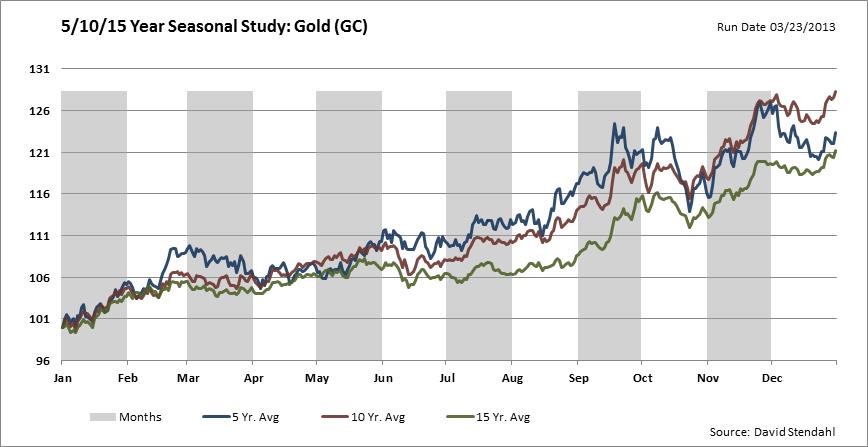
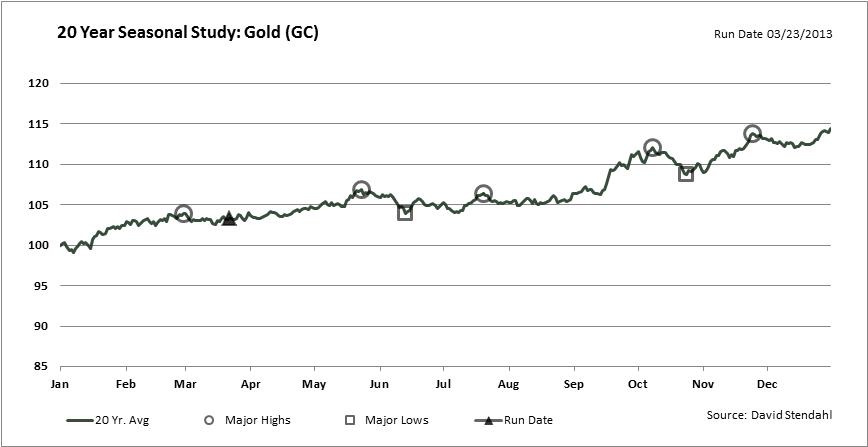
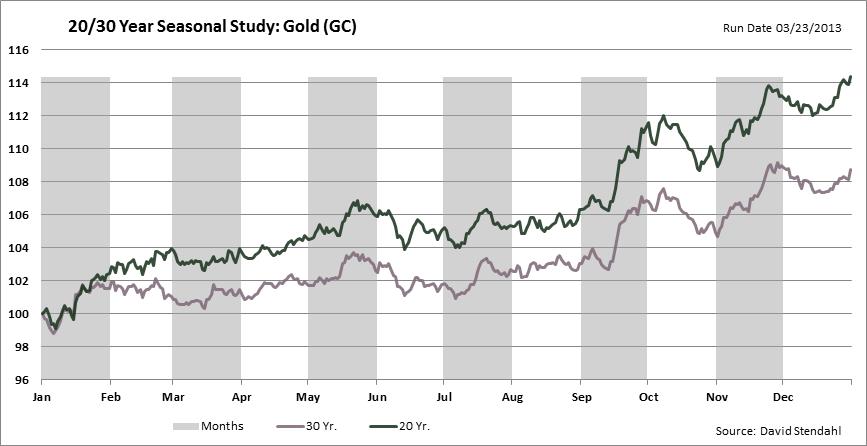
The following 5 year to 30 year seasonal studies show weakness points of gold:
- Mid March
- Mid June
- to lower extend Mid October
Strength points are:
- The mentioned February 19
- Early June
- Mid September
- Mid November as the best point in the year.
|
 Gold came under pressure in early February when stock market strength but also U.S. gas prices rose. US purchases, however, help to improve foreign economies and therefore also the gold price. - Click to enlarge |
 Gold came under pressure in early February when stock market strength but also U.S. gas prices rose. US purchases, however, help to improve foreign economies and therefore also the gold price. - Click to enlarge |
 Gold came under pressure in early February when stock market strength but also U.S. gas prices rose. US purchases, however, help to improve foreign economies and therefore also the gold price. - Click to enlarge |
 Gold came under pressure in early February when stock market strength but also U.S. gas prices rose. US purchases, however, help to improve foreign economies and therefore also the gold price. - Click to enlarge |
 Gold came under pressure in early February when stock market strength but also U.S. gas prices rose. US purchases, however, help to improve foreign economies and therefore also the gold price. - Click to enlarge |
The following entry by signal financial group:
George Dorgan (penname) predicted the end of the EUR/CHF peg at the CFA Society and at many occasions on SeekingAlpha.com and on this blog. Several Swiss and international financial advisors support the site. These firms aim to deliver independent advice from the often misleading mainstream of banks and asset managers.
George is FinTech entrepreneur, financial author and alternative economist. He speak seven languages fluently.
See more for 6a) Gold & Monetary Metals
Permanent link to this article: https://snbchf.com/swissgold/gold/seasonal-factors-on-gold/


