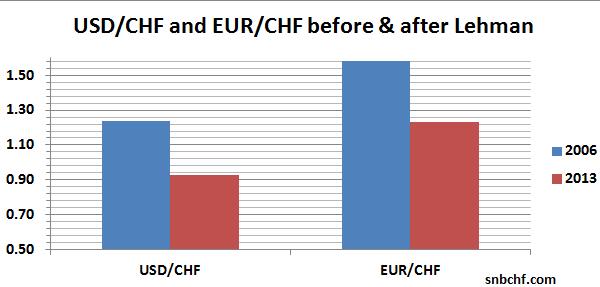
A list of charts on the economic development of Switzerland and its banking sector compared to the United States – before and after the financial crisis that started with the collapse of Lehman Brothers.
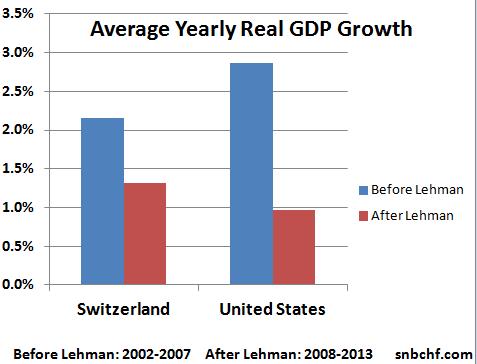
Since Lehman, Switzerland has outpaced U.S. yearly GDP growth by 0.34%
Swiss GDP growth since 2008 was also far higher than the ones of its European neighbors.
One big source of Swiss GDP growth is immigration
GDP growth is often defined as productivity growth plus population growth. In developed nations the most important source of population growth has become immigration. The natural change, caused by birth and death, of the Swiss population is 0.2% per year, up from the lows of 0.1% in 2002. The American natural change is falling: It is currently 0.4%, down from 0.6% in 2007.
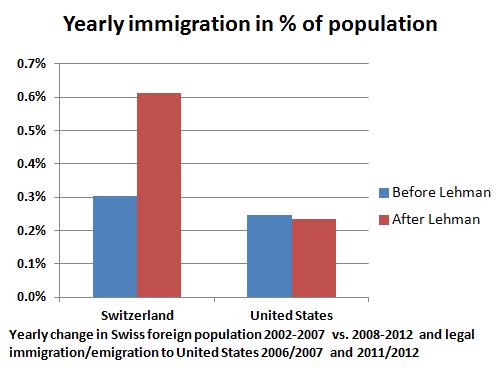
sources Swiss Statistics and prg.org and migrationinformation.org
Remark to the U.S. data:
The number of illegal immigrants in the U.S. peeked in 2007 and dropped to 11.1 billion (source). In absence of clear statistical data we excluded the number of illegals in the graph above. Hence, the U.S. numbers after Lehman, might be even weaker if we consider that in 2007 the number of illegal immigrants was high, while with the crisis many left or adjusted their status and became a “legal immigrant” . The “legal immigration” figure of around 1 million people contains around 500000 “status adjusters” from “illegal” to “legal” (see the graph on migrationinformation.org).
Swiss current account surplus remains extremely high, while the trade surplus is rising
Measurements for the productivity of a country are the current account and the trade balance.
Lehman and then the financial crisis have changed the world:
- Americans consume less and save/repay more. Consequently they now have a 30% smaller trade deficit. The U.S. current account deficit has diminished by 40%. The 10% difference can be explained by net US investment gains abroad.
- Between 2009 and 2012 the Great Recession in the developed world was countered by quantitative easing funds and high investments in Emerging Markets. These funds continued the “Great Expansion” in China and emerging markets that took place since the Asian crisis 1998.
- A consequence of this “Great Expansion” were the quickly rising Chinese salaries and a far smaller Chinese current account surplus to GDP ratio. With rising wages, Chinese productivity has declined. Many other emerging markets now have higher current account deficits than before Lehman.
Since Lehman the Swiss have increased their trade surplus despite the strong franc. The current account surplus to GDP ratio has fallen a bit because the income from foreign investments and direct investments is not as strong as in 2007 any more.
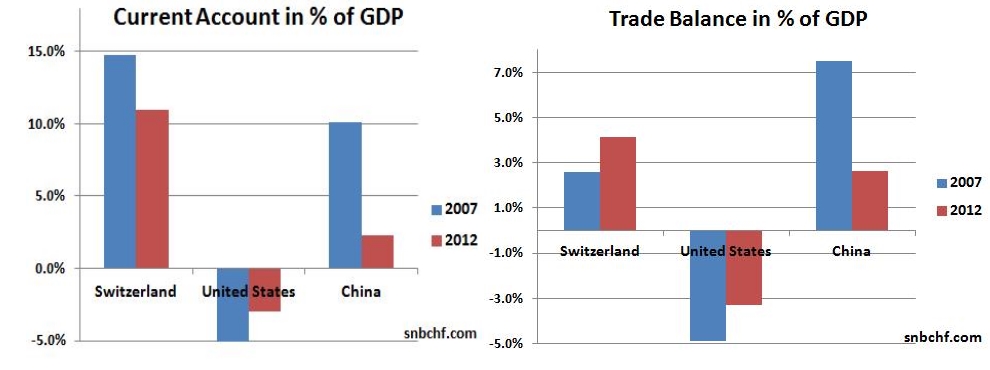
sources Trading Economics and Swiss Statistics Bureau
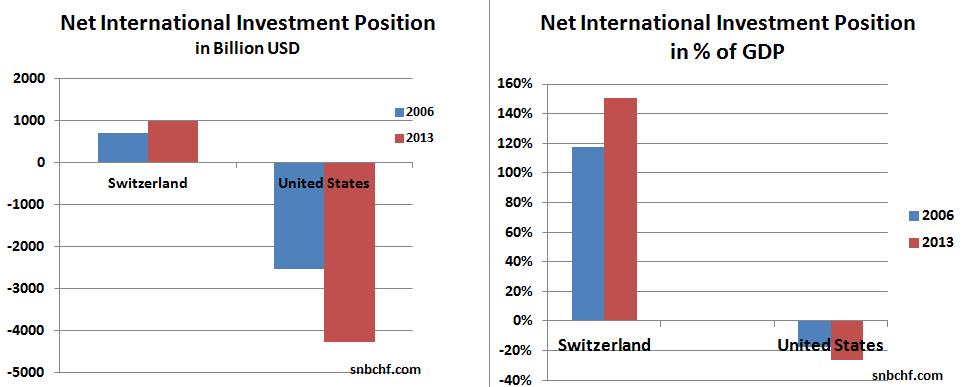
Swiss net international investment position continues to rise, while the one of the U.S. deteriorates
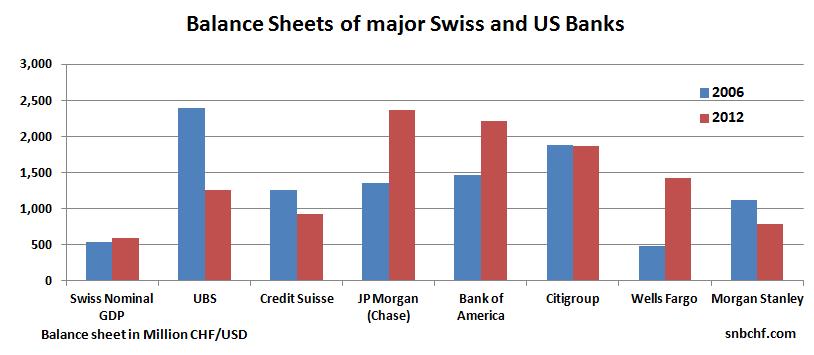
Swiss banks have reduced their balance sheets, the 5 biggest U.S. banks have become even bigger
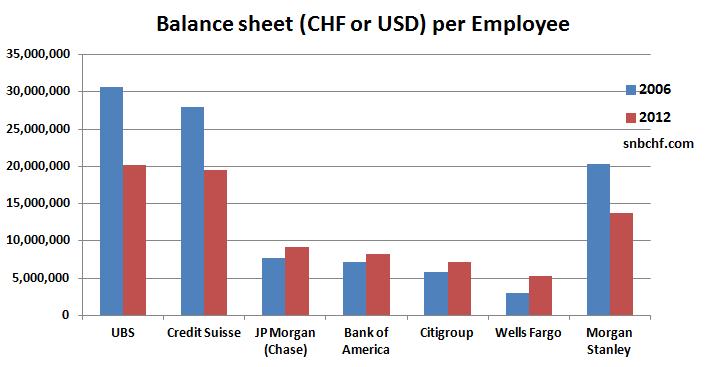
Due to mergers, the biggest American banks have become even bigger. So the measurement balance sheet per employee is more significant. UBS, Credit Suisse or Morgan Stanley have always had higher ratios, because they are very active in wealth management. Still, the Swiss appear to have achieved far higher progress than U.S. banks.
Swiss banks reduced balance sheet and risks, the SNB increased them
While the big Swiss banks have reduced their balance sheets, the Swiss National Bank (SNB) has increased it. With its foreign currency and gold holdings it possesses far more volatile assets than UBS or Credit Suisse. UBS has reduced the risk-weighted assets to 211 billion CHF – 20% of the balance sheet.

sources SNB and SNBCHF
The SNB is still hoping that things will become a bit like before Lehman
But the SNB might need to prevent a repetition of a real estate crisis in Switzerland
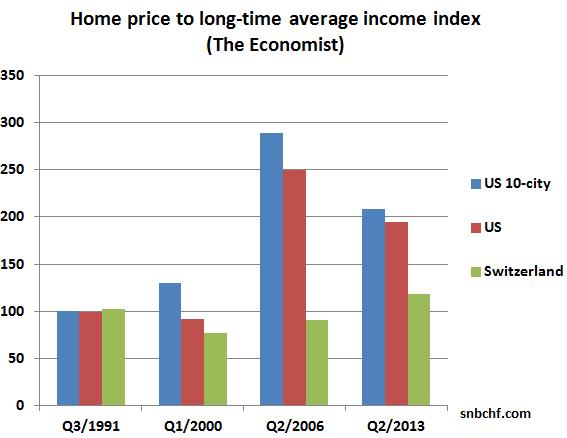
data source The Economist
The Swiss need to pay 18% more for a home than in 1991, when comparing the home price with income. 1991 was the height of the Swiss real estate bubble. Between 1991 and 2002, the bubble collapsed and a home became far cheaper compared to income.
In the United States, housing was fairly cheap in 1991 compared to income. The share (or multiple) of income needed to pay for a U.S. home nearly tripled until 2006. With recent Fed purchases of mortgage-backed securities and investor appetite for US real estate, this ratio has recently risen again to around 200%, after falling to levels of 169% in early 2012.
See more for


