


George Dorgan
My articles My siteAbout meMy videosMy books
Follow on:LinkedINTwitterSeeking Alpha
CFA SocietyEconomicBlogs
A paper from the Bank of England recently seemed to sustain certain aspects of Modern Monetary Theory (MMT), that the monetary base and excess reserves are largely unrelated to inflation and that the money multiplier theory is not valid any more.
A stunning economic research comes from researchers of the Cleveland Fed that contradicts the basis of the Balance Sheet Recession (BSR) and MMT. The Fed researchers consider that the current BSR phase a temporary disruption and exhibit a prove that over the long-term excess reserves correlate.
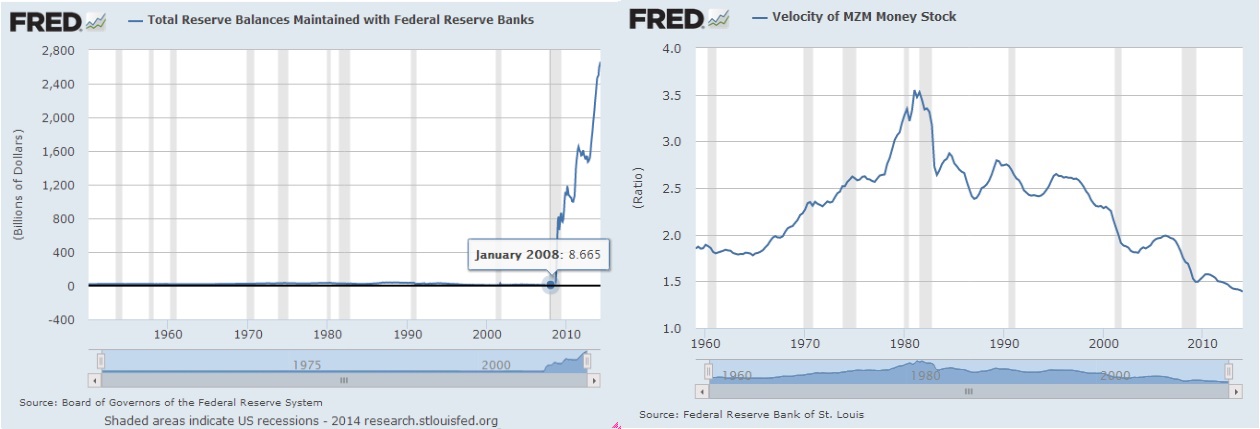
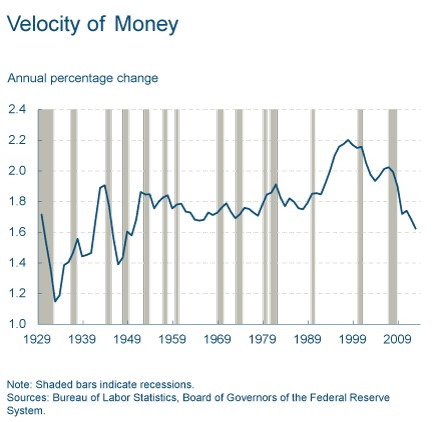
We added two graphs that show how reserves increased from 8 Billion to 2.7 Trillion $ and how the MZM money velocity has fallen to levels of 1.4.
We agree with this research for the following reasons:
- For us the reason for the falling money velocity are stagnating US salaries due to reduced U.S. competitiveness, in particular of U.S. manufacturing of tradable goods. The monetary transmission of US money supply into countries with higher competitiveness and rising salaries – like the emerging markets (EM) – has its difficulties and – in particular since the crisis – its risks. In recent years it resulted into excess savings and weak money velocity. Visible in the over one decade falling dollar, a negative U.S. current account and strong direct investments into EM , this transmission actually happened; a big part of new U.S. broad money supply found its way into emerging markets.
-
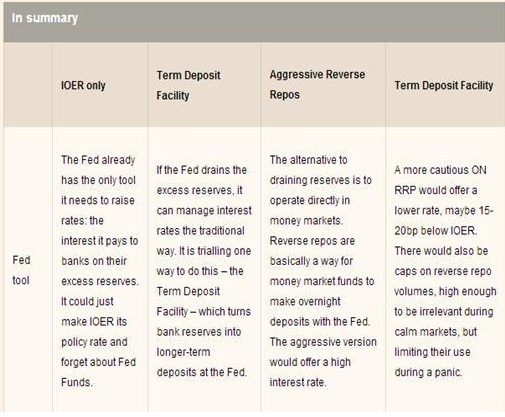
Source Financial Times
The removal of the excess liquidity will be a very long process. But when the U.S. finally becomes competitive again and global competition allows wages to rise again, then the Fed will be able to remove the excess reserves. Draining tools recently described by Joseph Gagnon from the Peterson Institute or in the following graph from the FT could help.
-
The recent improvements in US manufacturing purchasing manager indices compared with still weak Chinese ones show that the wage and competitiveness gap between the U.S. and China is slowly closing. However, the reasons for Chinese slowing can be also found in the tight Chinese monetary policy and in lower exports to Austerity-ridden Europe.
On the other side, due to global competition, quantitative easing can only increase “perceived” wealth but not U.S. salaries in a sustained form.
Cleveland Fed: Prices from a Monetary Perspective
Economists like to remind people that inflation and deflation are monetary phenomena and that they ultimately stem from central banks’ monetary policies. Inflation results when a nation’s central bank creates more money than its public wants to hold, and deflation occurs when a central bank creates too little. The connection between central banks’ monetary policies and inflation, however, is imprecise and often drawn out over many years. This imprecision happens for two reasons: Not all price changes stem from inflation; some instead reflect an emerging scarcity or abundance of particular goods. And the public’s demand for money, the amount it wants to hold, often is not very stable. Economists can, however, employ a simple technique that helps us see more clearly the relationship between money and price movements.
To get at the monetary nature of inflation and deflation, economists can divide price changes into two components: excess-money growth and changes in the velocity of money. Excess-money growth is simply the difference between the growth of money and the growth in real output. The velocity of money, in theory, represents the average rate at which money changes hands in a given time period. In practice, economists calculate velocity as anything that affects aggregate prices besides excess-money growth. Velocity might, for example, respond to relative price changes, price controls, and factors that affect money demand besides real GDP, like interest rates or inflation expectations.
Applying this framework to the U.S. GDP deflator—a very broad price measure—provides an example. The GDP deflator rose 1.3 percent on average during the first three quarters of 2013. This average price change consisted of a 4.3 percent increase in excess-money growth and a 3 percent decline in velocity. As this method shows, the connection between aggregate price movements and U.S. money growth over the course of 2013 was so loose as to be unapparent.
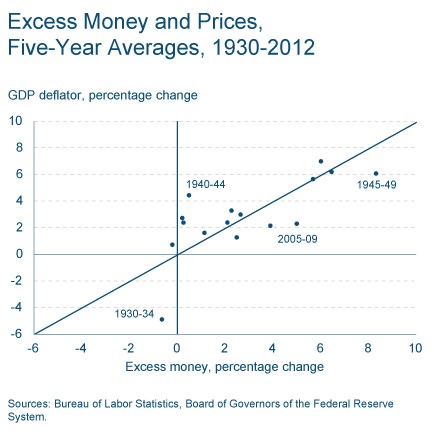
This imprecision is not unusual. Over the short run—a year or two—excess-money growth explains very little of the changes in the GDP deflator. If excess-money growth explained all of the annual price changes, the dots in the scatter plot below would line up along the 45-degree line, and all price movements would be inflation—strictly a monetary phenomenon. Instead, the dots are spread about, showing almost no correspondence between the annual change in the GDP deflator and excess-money growth. The simple correlation coefficient is only 0.10. Moreover, the typical annual dispersion of price changes from excess-money growth is about 4 percentage points, but there are some enormous outliers. Many of the largest deviations occurred during the Great Depression and the Second World War, both highly disruptive and uncertain economic events. Likewise many dots associated with the recent Great Recession years also seem well off the mark. Clearly, central banks do not have much control over aggregate-price movements on a year-to-year basis.
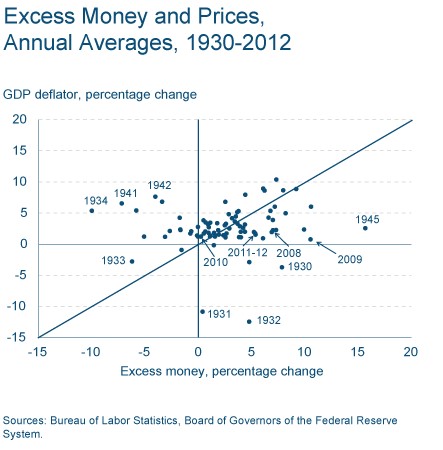
As time passes, the effects of nonmonetary events (velocity) on the GDP deflator fade and the connection between excess-money growth and prices starts to predominate. Five-year averages of excess-money growth and price changes, for example, line up more closely along the 45 degree line. At this interval, the correlation between excess-money growth and price changes increases to 0.72, and the typical annual dispersion of price changes from excess-money growth falls by roughly half, to about 2 percentage points. Still, big outlying observations exist; particularly noticeable are again those associated with the Great Depression and the Second World War.
The velocity of money often falls during recessions or shortly thereafter, and its decline can persist for a long time after an economic recovery has taken hold. This is certainly true today. Since the onset of the Great Recession in 2007, the velocity of money in the United States has fallen sharply, at an annual average rate of 3.1 percent. This decline has offset average annual excess-money growth of 4.9 percent, resulting in an average annual increase in the GDP deflator of 1.8 percent.
While many factors affect prices that are beyond the Federal Reserve’s direct control, eventually monetary policy tends to re-emerge as the key driver of inflation. After abstracting from short-term movements caused by economic disruptions, recessions, and wars, inflation is ultimately a monetary phenomenon: since 1929, the average annual percentage increase in the GDP deflator has been 2.8 percent, and the average annual growth in excess money has been 2.9 percent.
Read also:
The trade deficit and the collapse of manufacturing, the causes of the U.S. secular stagnation?
Bank of England: Quantitative Easing Explained
Bank of England: money multiplier theory is not valid any more
Stagnating Salaries as Main Reason for the British Home Price Boom


