2014 Update:
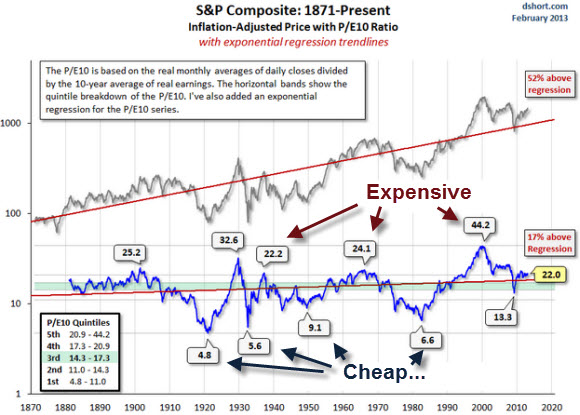
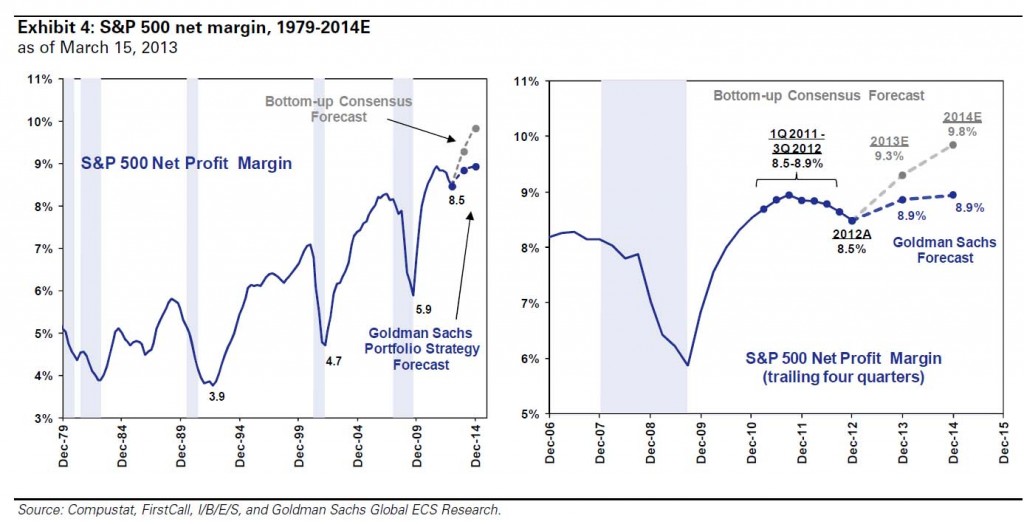
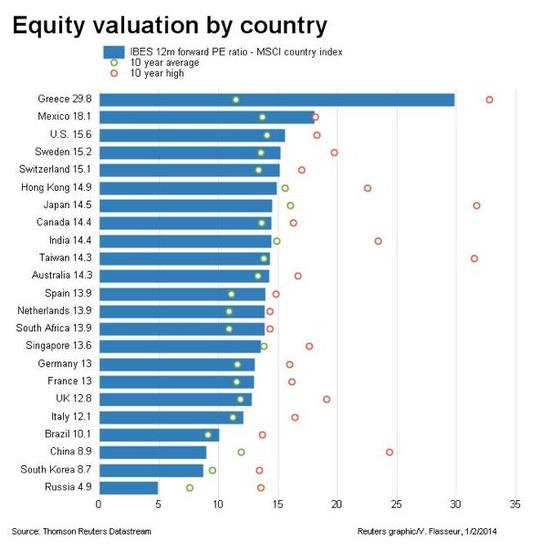
A list of relevant graphs for the long-term price earnings ratios and corporate profits.
Click on the image for a full view.
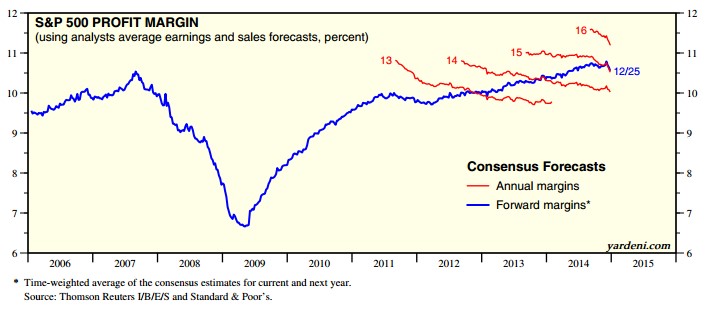
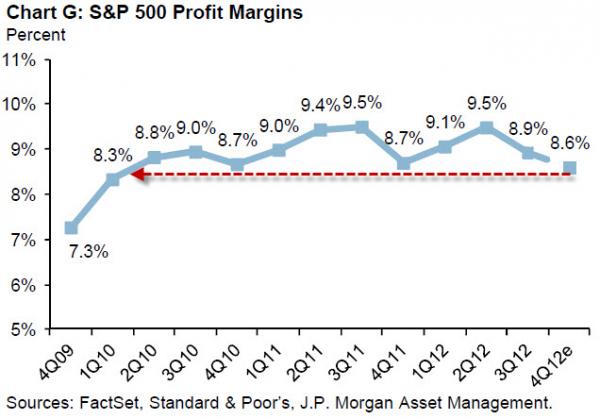
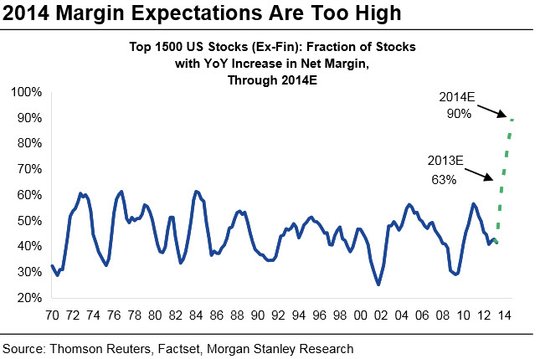
Profit Margins
Time for a useful pause to take stock of results we’ve seen so far, before the onslaught of second-quarter earnings continues.
Of the companies on the S&P 500, 192 have reported so far and a further 35 are expected to before US stock markets open today. In fact, we’ve already had a few.
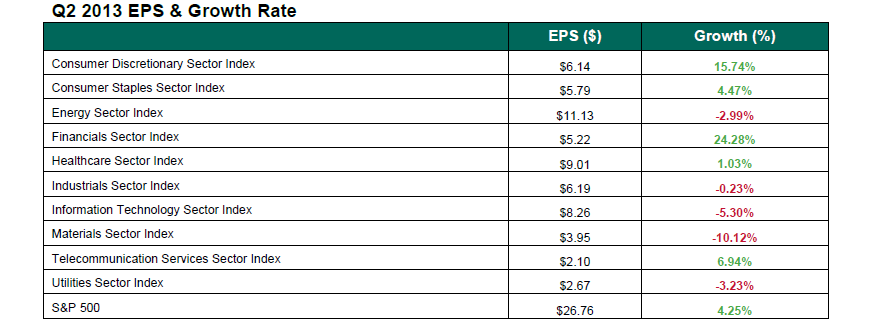
Data compiled by S&P Capital IQ reveals that just a handful of sectors are recorded earnings growth in the quarter versus last year. (see table below).
With an annual earnings growth of just under 25 per cent , banks are leading the way, and are followed by the consumer discretionary index, whose members range from car makers such as Ford to homebuilders such as DR Horton.
(The figures are made up of the earnings growth recorded by those companies that have reported and analysts’ projections for those that haven’t). Source Financial Times
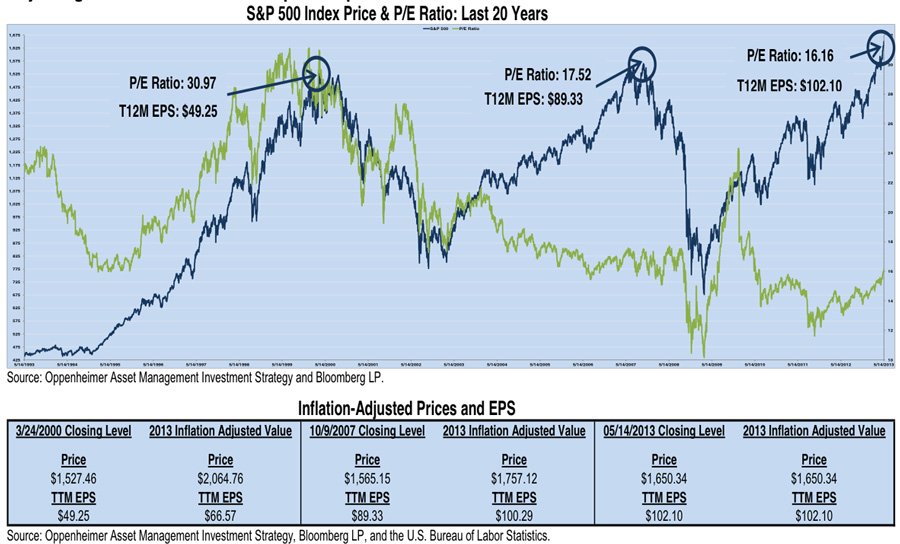
Oppenheimer’s John Stoltzfus provided this handy chart this week overlaying the S&P 500 with it’s P/E ratio. It also addresses inflation.
You come away with three conclusions: 1) the valuation (P/E) is much more reasonable today than during the last two highs, 2) nominal and adjusted earnings are much higher today, and 3) the inflation-adjusted price of the stock market is around 20% lower today than in 2000.
So while the nominal price might seem scary, everything else about the stock market today is much more reasonable. source
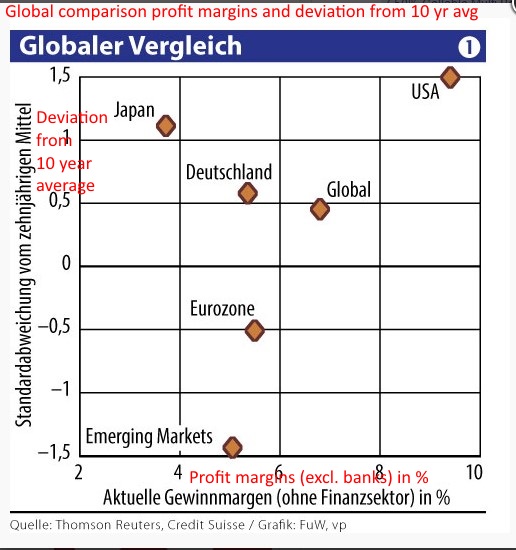
Since September 2011, global earnings per share have been flat, while share prices have gained some 30 per cent. Price/earnings multiples have gone from 12 to 16 in the process. Such sharp rises often happen at the beginning of a stock market cycle.
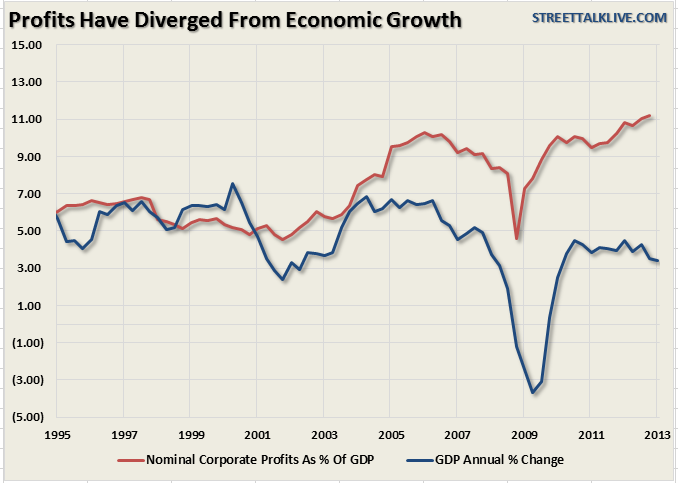
Wherever the corporate US is generating its profits, it is not from revenues, which according to the scorecard kept by Thomson Reuters are exactly flat, up 0.0 per cent from the first quarter of last year.
U.S.: When Income and Salaries Go Down, Profits Go Up and Stocks Rise
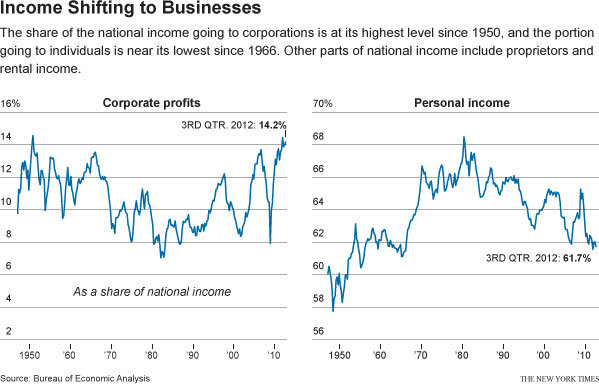
The History of Corporate Profits
1950-1965: High corporate profits, relative wage repression
1965-1982: Full employment, more global demand, wage rises, inflation, subsequently oil price rises
1982-1998: Volcker defeats inflation (i.e. workers), corporate profits rise again
1999-2003: Short wave of weakening profits, accompanied by a strong fall in stock prices
2003-2007: Rising profits thanks to cheap suppliers in China, domestic American demand
2007-2009: Financial crisis
Since 2009: Profits rise again thanks to wage repression against American workers. Rising demand from emerging markets
Fundamentals about the U.S. Economy vs. Strong Stock Market
A comparison with October 2007: (source Zerohedge)
Regular Gas Price: Then $2.75; Now $3.73
GDP Growth: Then +2.5%; Now +1.6%
Americans Unemployed (in Labor Force): Then 6.7 million; Now 13.2 millionAmericans On Food Stamps: Then 26.9 million; Now 47.69 million
Size of Fed’s Balance Sheet: Then $0.89 trillion; Now $3.01 trillion
US Debt as a Percentage of GDP: Then ~38%; Now 74.2%
US Deficit (LTM): Then $97 billion; Now $975.6 billion
Total US Debt Oustanding: Then $9.008 trillion; Now $16.43 trillion
US Household Debt: Then $13.5 trillion; Now 12.87 trillion
Labor Force Participation Rate: Then 65.8%; Now 63.6%
Consumer Confidence: Then 99.5; Now 69.6
S&P Rating of the US: Then AAA; Now AA+
VIX: Then 17.5%; Now 14%
10 Year Treasury Yield: Then 4.64%; Now 1.89%
NYSE Average LTM Volume (per day): Then 1.3 billion shares; Now 545 million shares
Big U.S. firms—often called “multinationals,” for good reason—have increasingly followed global growth, with about 40 percent of profit for firms listed in the S&P 500 stock index now coming from overseas. Foreign exposure allows U.S.-based companies to capitalize on rapid growth in emerging markets like China, India, and Latin America, and earn much stronger profits than if they were totally dependent on the struggling U.S. economy. source
Foreign subsidiaries of American industrial firms deliver 89% of their production to that or other countries. Sales in US manufacturing 5.4 bln. $, of which 3.7 $ value of preliminary goods. From 1999 to 2011 the share of imported preliminary goods has risen from 14% to 23%. Hence as for US manufacturing there is no tendency that jobs come back. source
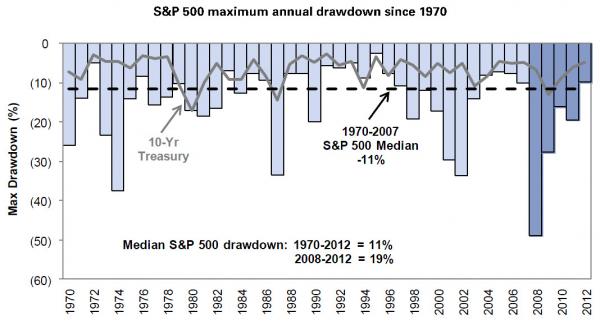
One indicator of fear are the drawdowns in equity prices often caused by premature rallying of equity markets after money injections by central banks.
A list of relevant graphs for long-term price earnings ratios and the rising company profits in the last years. - Click to enlarge
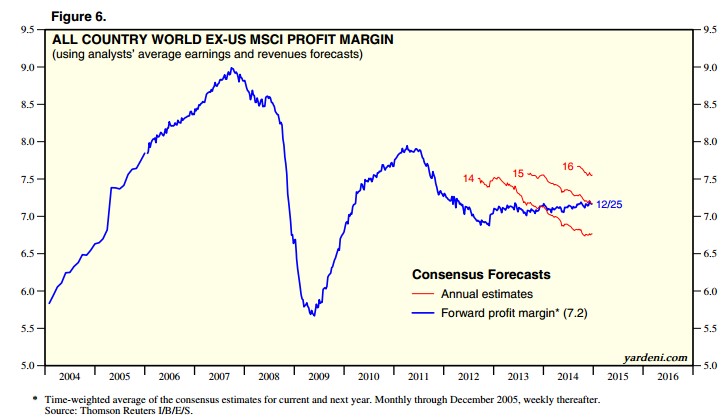
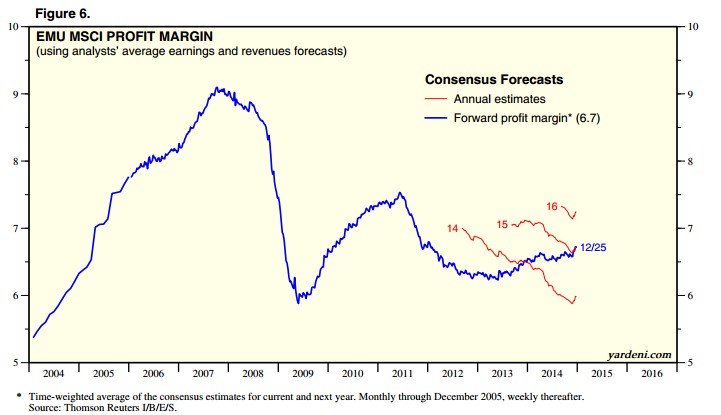
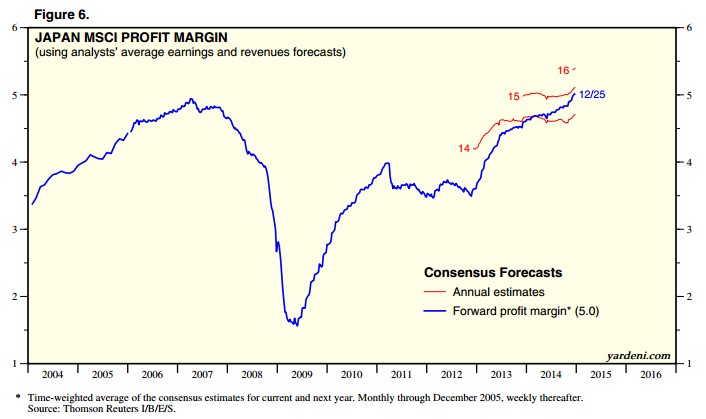
Falling Profits: Opposite movement in China and other emerging markets
In emerging markets, earnings by this measure peaked in 2011 – above their peak from before the crisis – but are now on a descending trend, down 16.5 per cent from their post-crisis peak. And earnings for the MSCI “EAFE” index – covering the developed markets outside North America – look terrible, down 46 per cent from their pre-crisis peak, and falling steadily. A decade ago, the corporate world was growing more homogeneous, and geographic differences between stock markets were diminishing. No more. source FT
Foreign demand weakened since 2007, but salaries and income go up.
The real value of the yuan moved upwards, the current account surplus got smaller.
Company profits weakened and Chinese stocks fell since 2007.
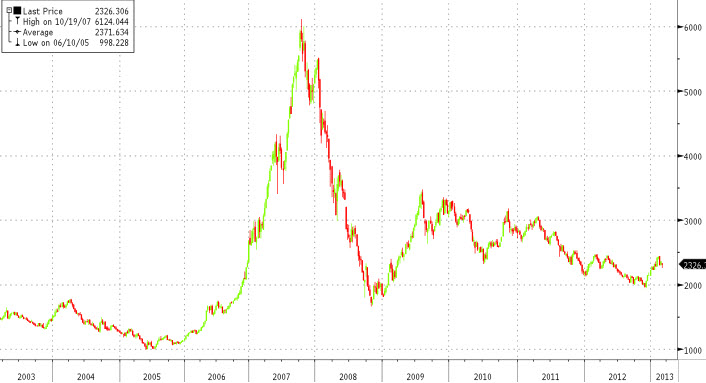
http://www.zerohedge.com/news/2013-03-05/chinas-wahaha-billionaire-says-capital-markets-sucks - Click to enlarge
See more for


