


George Dorgan
My articles My siteAbout meMy videosMy books
Follow on:LinkedINTwitterSeeking Alpha
CFA SocietyEconomicBlogs
Understanding FX History Based on BIS Banking Data
In several posts we explained that the long-term movement of the USD/JPY depends on the behaviour of large Japanese banks and investors. Ideas by some American hedge funds are able to cause short to mid-term movements.
In this post we look into FX history at 6 major points in time.
- 1989, when the Japanese boom was still ongoing.
- 1996, just before the Asia crisis.
- 2000, at the top of the dot com and United States boom.
- June 2007, at the height of the US subprime boom.
- June 2008, when the U.S. was already slowing but not the rest of the world.
- March 2009, in the deepest depression.
- December 2012.
We compare the FX rate with the net external position of commercial banks, delivered by the bank of international settlements (BIS).
1989: Japan is still net debtor
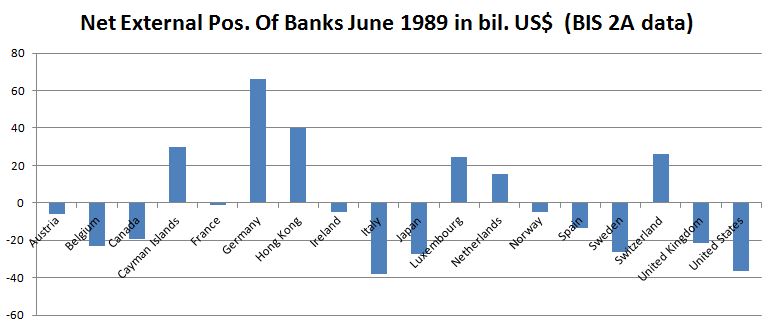
1989: Japan’s bank becomes net creditor
The period between 1989 and 1996, shows three important changes. Thanks to huge current account surpluses and low spending, Japan becomes a net creditor. Due to high German reunification costs, German banks lose their leading position to Japan, but the German current account remains positive. France sees current account surpluses and its able to improve its position. Flows to Asia reduce the creditor position of Hong Kong. The negative U.S. position increases, the dollar falls.
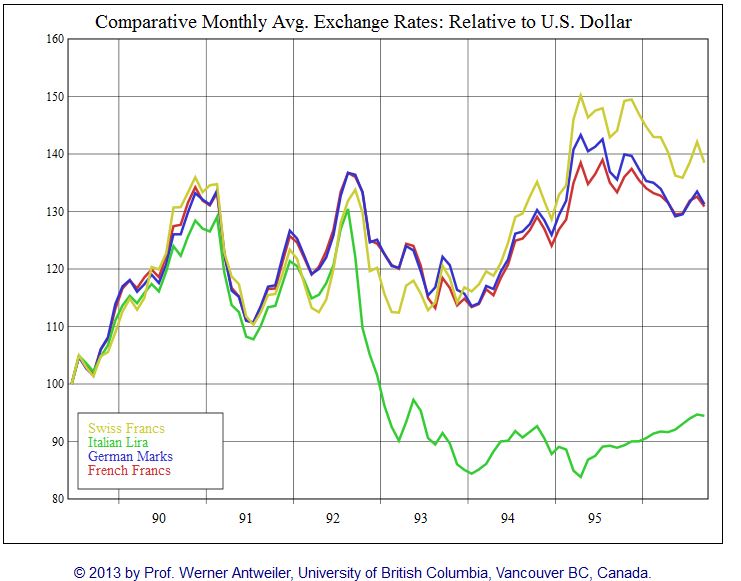
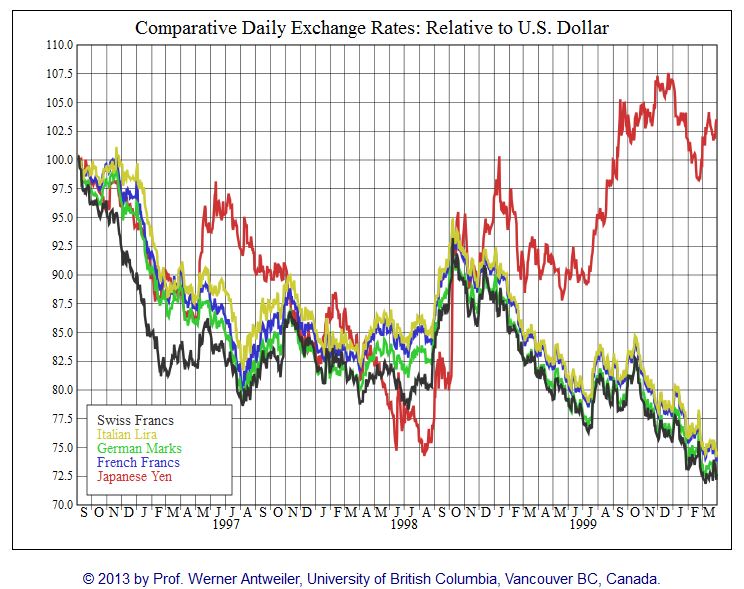
The consistent current account surpluses translated into a 35% increase for the yen, but in similar improvements for the German Mark, the French Franc and the Swiss Franc, while the Italian Lira remained weak.
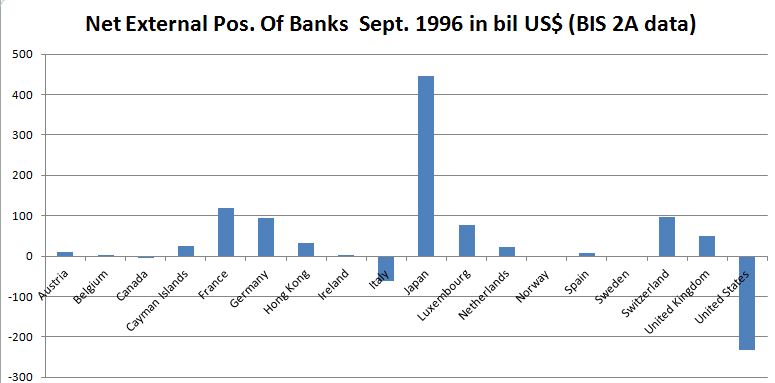
Period between 1996 and 2000: USD/JPY and USD/EUR carry trade
The period from 1996 to 2000 sees a boom phase in the US American economy. US banks manage to reduce the weak net external position, while the Japanese increase their net external position from 400 bln. to 700 bln. dollar, thanks to a yearly current account surplus of 100 bln. USD and more.
FX rates were driven by the negative German current account, visible in the weaker German net external position. The German and Japanese current accounts were completely opposite: Japan was continuously positive and the German one negative, due to the higher spending after the German reunification.
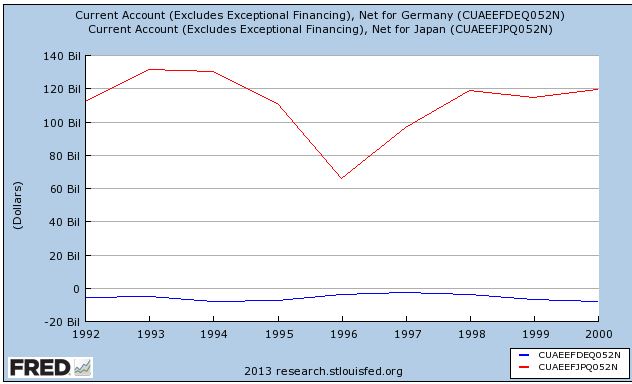
The appearance of the “PC revolution”, paved the way for the big carry trades between USD/JPY (until 1999) and later the USD/ EUR carry trade (until 2001), consequently all European currencies (DEM, ITL, FRF but also CHF) fell until the end of the year. From 1998 until 2000 traders were betting on a recovery of the Japanese economy (yen red line below), in vain.
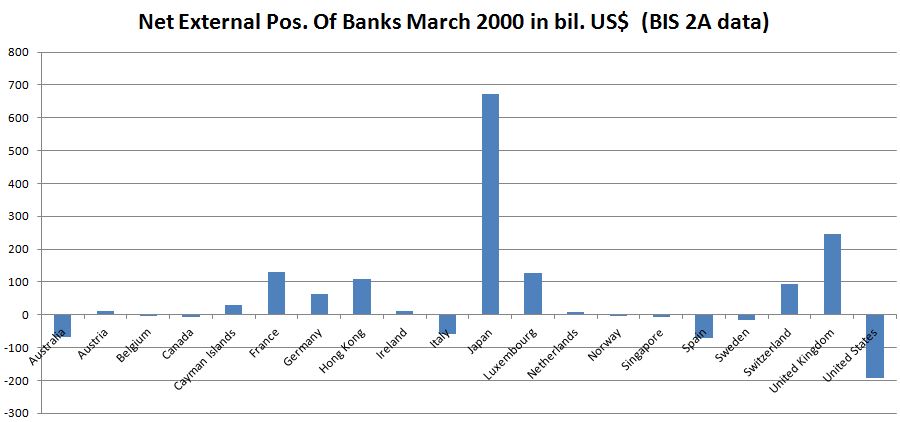
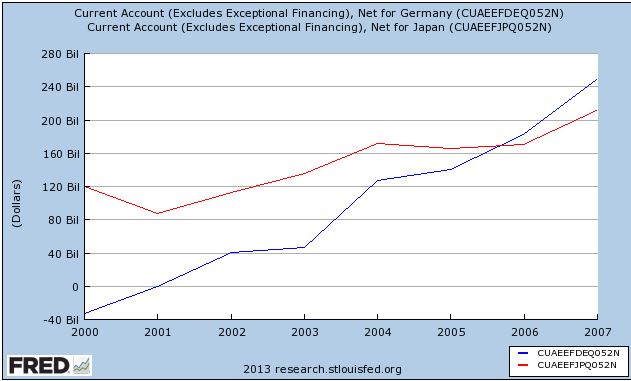
Period between 2000 and 2007: German, Swiss and Japanese Surpluses Finance Global Real Estate Bubble
The period between 2000 and 2007 saw huge Japanese and German current account surpluses.
Total German and Japanese Current Account Surpluses per year
Logically, the Germans and Japanese obtained far more advantageous external positions for their banks. The German position increased from 50 bln. to 1700 bln. US$ in seven years and the Japanese from 680 bln. to 1450 bln.
The US position fell from 200 bln. to 700 bln. US$ deficit. The UK position improved thanks to an improvement in the UK banking center.

It is important to note that nearly all countries (except Australia and the US) are in the positive area, while in 1989 there were far more countries in the red. The reason was the world-wide extension of credit to the private sector.
2007-2008: United States is first country to reduce debt
With the outbreak of the US sub prime crisis, American banks were the ones that paid down foreign debt first, while the French and British reduced their positive external balances. The US BIS 2A balance improved from minus 700 in 2007 to minus 510 bil US$. The French positive position reduced from 520 bln. to 30 bln. US$.
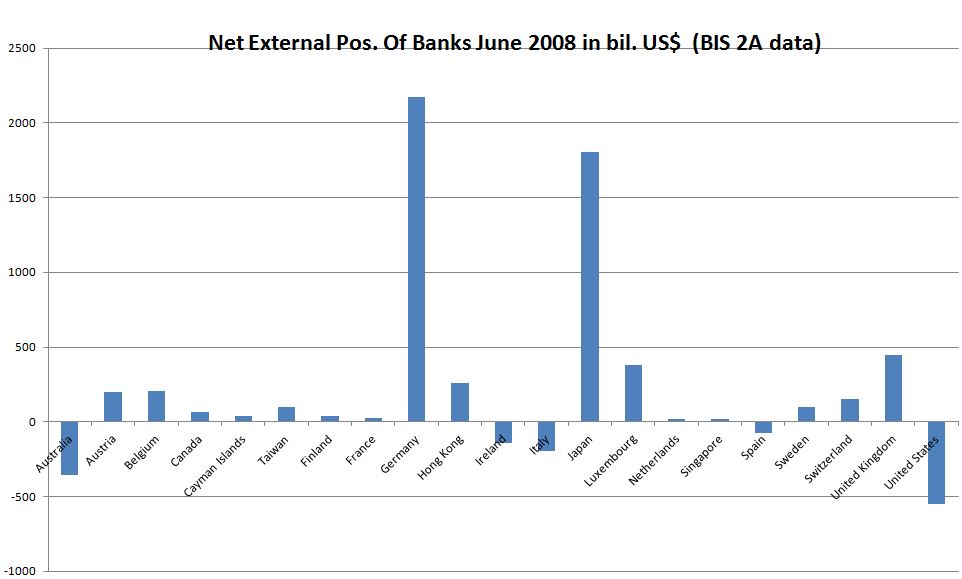
German banks, however, continued relentless lending and increased their external position from 1700 to 2200 bln. dollars. Irish and Spanish banks financed the continuing bubble via securization via German banks.
In the final year of the bubble, the European current account imbalances continued to aggravate.

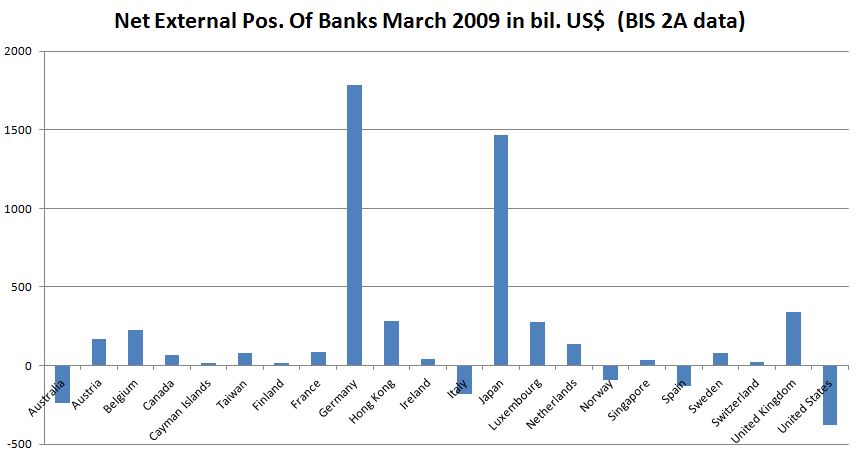
2008-2009: Reduction of debt: External positions of banks decrease
German commercial banks reduce their external position from 2200 bil. to 1700 bil. US$ in a couple of months, the Japanese from 1800 bil. to 1500 bil USD and the Swiss banks from 150 bil. to close to zero. A big part of these funds were absorbed by the Swiss National Bank at a EUR/CHF exchange of 1.50.
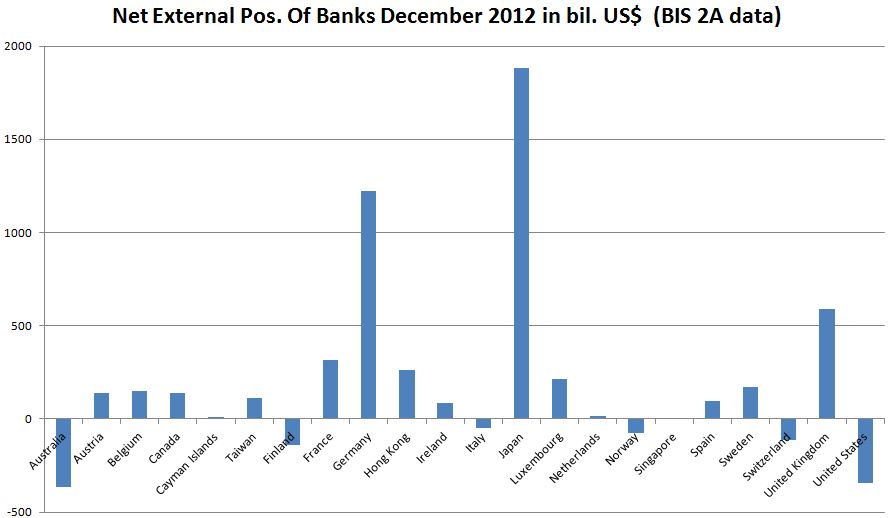
Until 2012 the inversion of this tendency intensified. Despite (somewhat lower) German current account surpluses, German banks reduced their foreign exposure further, to 1200 bil. USD$. Japanese banks, however, were not afraid and increased their net external position from 1500 bil. to 1850 bil. USD$. US banks continued to pay down foreign liabilities to 300 bil. US$.
As a new tendency, Finland, Australia and Switzerland increased their negative external position: the reasons were more loans for Australia and Finland, but foreign banks increased their Swiss assets, even if they were mostly cash accounts. This cash in Switzerland then went on the balance sheet of the SNB.
As we know, big parts of this private position were transferred to the Target2 balances in the public sector.
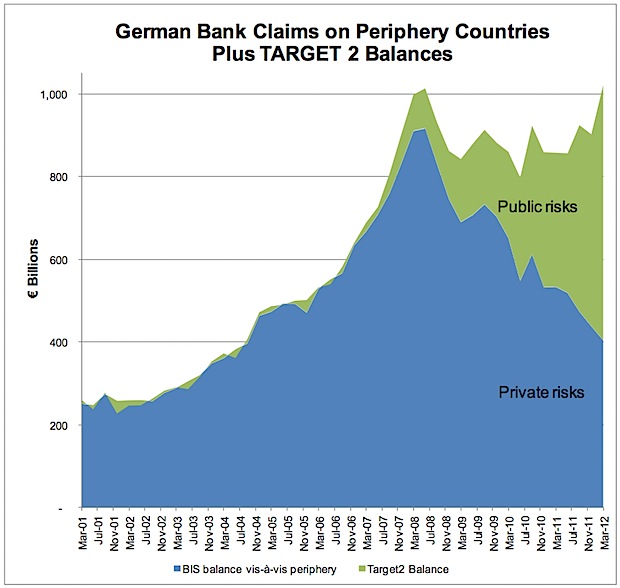
German Banks vs. Target2 Debt (source Thompson Reuters)


