


George Dorgan
My articles My siteAbout meMy videosMy books
Follow on:LinkedINTwitterSeeking Alpha
CFA SocietyEconomicBlogs
Credit or Joseph Cycles are boom and bust cycles, especially in real estate and other private investments, where credit either expands or contracts. They are often caused by rational expectations. These are important for the state of health of the banking system. Claudio Borio called them therefore “financial cycles”.
During a boom cycle, higher property values cause consumers to feel more wealthy and to spend more. Credit for home buyers and businesses is easily available.
Higher availability of credit leads to increasing local production, especially when the country is a relatively closed economy like the U.S. or Japan. In order to take profit on rising consumer spending, funds and investments are directed to this country (see the asset market model), so that stock prices rise. With time, unemployment goes down, wages rise and inflation shows up. Economic actors spend more than previously and often reduce their savings rate. Finally central banks are obliged to increase interest rates.
Since WWII, we have seen several big Joseph cycles that applied to the U.S. and therefore also on the global economy, while each country had its own specific credit cycle.
The historical example of Sweden shows that it possessed 7 years of increasing and 7 years of decreasing leverage between 1985 and 1999, a typical biblical Joseph cycle. A credit cycle can even take longer than the typical seven year legs of the Joseph cycle. Countries like the UK often live quicker cycles, while Switzerland exhibited a housing bust cycle that took 12 years: five years longer than the typical seven years. Real home prices in Germany, however, saw a 30 year long down-trend between 1980 and 2010.

Joseph/Credit cycle (source McKinsey)

One leading protagonist on these cycles is Claudio Borio of the Bank for international settlement (BIS).
He generalises the term and names it “financial cycle“, because it peaks in financial distress. It does not only apply to real estate, but to other cycles, e.g. the inflationary cycle in the 1970s and early 1980s.
The financial cycle is best thought of as the self-reinforcing interactions between perceptions of value and risk, attitudes towards risk, and financing constraints, which translate into booms followed by busts (Borio 2012a). These interactions can amplify economic fluctuations and possibly lead to serious financial distress and economic dislocations….
Since financial liberalisation, its typical length is of the order of 16 to 20 years; by contrast, as generally conceived in academic and policy work, business-cycle frequencies are up to eight years…
Third, peaks in the financial cycle tend to coincide with episodes of systemic financial distress…
Fourth, the financial-cycle regularities inform the construction of real-time leading indicators of banking crises that provide fairly reliable signals with quite a good lead – between two and four years, depending on the calibration1..
Finally, the financial cycle depends critically on policy regimes.
Financial liberalisation weakens financing constraints. Monetary-policy frameworks focused on short-term inflation control provide less resistance to the build-up of financial imbalances whenever inflation remains low and stable. And positive supply-side developments (eg. the globalisation of the real economy) fuel the financial boom while putting downward pressure on inflation. Not surprisingly, financial cycles have become twice as long since financial liberalisation in the early 1980s and have been especially virulent since the early 1990s (see below).
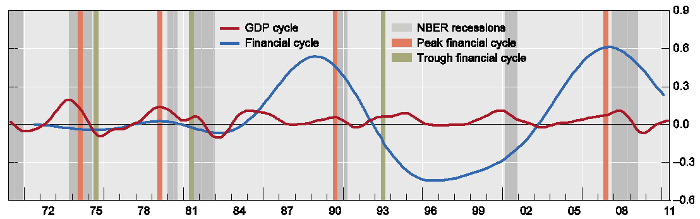
Notes: The orange and green bars indicate peaks and troughs of the financial cycle measured by the combined behaviour of the component series (credit, credit-to-GDP ratio and house prices) using the turning-point method. The blue line traces the financial cycle measured as the average of the medium-term cycle in the component series using frequency-based filters. The red line traces the GDP cycle identified by the traditional shorter-term frequency filter used to measure the business cycle.Source2
The following graph shows the positive part of the credit cycle, the boom leg:

![]()
And this diagram helps describe how the credit cycle unwinds, the bust leg:

<—Back to financial cycles overview
Further Reading:
Borio, C.: Bank of International Settlement: “The financial cycle and macroeconomics: what have we learnt?”, Working Paper 395, December 2012, Online Link
Claudio Borio on VoxEU :
- Low interest rates, secular stagnation, and debt, 25 June 2014, 9577 reads
- Measuring potential output: Eye on the financial cycle, 9 April 2013, 13915 reads
- Macroeconomics and the financial cycle: Hamlet without the Prince?, 2 February 2013, 23943 reads
- Did global imbalances cause the financial crisis?, 26 July 2011, 28695 reads
- Rethinking monetary policy – lessons from the crisis, 7 May 2010, 11116 reads
- We are all macroprudentialists now, 14 April 2009, 22249 reads
Claudio Borio on “The Economist”:
- Borio, C and M Drehmann (2009), “Assessing the risk of banking crises – revisited”, BIS Quarterly Review, March, pp 29–46. [↩]
- Drehmann, M, C Borio and K Tsatsaronis (2012), “Characterising the financial cycle: don’t lose sight of the medium term!”, BIS Working Papers, no 380, June. [↩]


