UPDATE Summer 2014: a new oil glut?
Global economic growth has slowed. With slowing demand in Russia, India and other Asian countries and continuing European austerity, Chinese and European industrial production is rising slowly or even falls. Moreover, high interest rates and tight Chinese monetary policy have weakened the Chinese housing market. Chinese oil demand is currently not increasing against last year. Still, in China private demand for car fuel is replacing more and more the use for industrial production and for construction. The question remains if crude oil use for industrial production and construction is far more important than private consumption in cars.
A new oil glut with oversupply from both OPEC arises. Brent oil has fallen to 88$, WTI is at 84$
According to Venezuela’s president Maduro “certain countries are overproducing to the tune of two million barrels” a day, without saying which ones.
Via Economic Times:
Global oil futures lost more than a dollar on Monday after Saudi Arabia and Kuwait signalled a willingness to bear with lower prices to defend market share, although better-than-expected trade data from China pared the losses.
The intention seems to be clear, OPEC ignores their own fiscal issues even if oil prices are weak. Instead they enhanced supply, the result:
- Shale oil producers are driven out of the market. WTI prices so low that US shale and Canadian sand oil producers are not profitable.
- Higher OPEC oil supply help to overcome fiscal issues.
Our analysis below focuses on the demand side for oil, it is clearly dependent on strong Chinese and global growth.
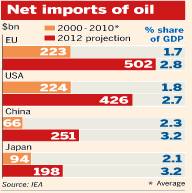
We maintain that the claims that the United States will be energy independent based on current estimates by the EIA on U.S. production are misleading. On the contrary, import costs for foreign oil will be the same in 2020 as today.
The expected “U.S. Energy Independence”
The IEA released a report announcing the U.S. would become “all but self‐sufficient” in terms of energy use by 2035 “thanks to rising production of oil, shale gas and bio energy, and improved fuel efficiency in transport.”
The IEA projects U.S. oil production will rise to 10 million barrels per day (bpd) by 2015 and 11.1 million bpd in 2020 before slipping to 9.2 million bpd by 2035, according to Reuters
…. The only explanation, he said, is that Canada fills the void — but that’s not clear from the current presentation, he said…..
1) Of that 10 million bpd number, about 2 million is liquids. Meaning, there could be roughly 8 million bpd of crude oil available for refineries; while some liquids will make its ways into refinery complexes, they are predominantly feed stocks into other industries and show up as part of the total petroleum mix of the U.S.
2) U.S. refineries currently demand about 15 mmbpd of crude oil. Assume that remains flat. (http://www.eia.gov/dnav/pet/pet_pnp_wiup_dcu_nus_w.htm)
.
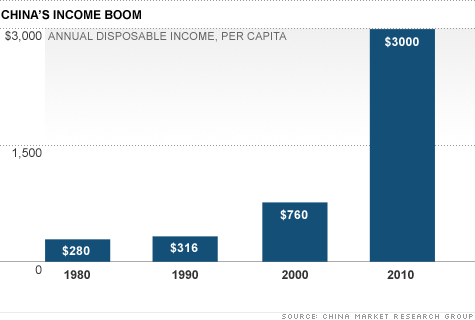
The Chinese income growth
The lower-class in China and other emerging markets do not have the means to spend enough yet. A large part of the 3000 US$ average Chinese salary goes into strongly rising rents and food, with 20% becoming savings. A real middle-class with spending power does not exist yet, but will emerge in the next ten years.
Boston Consulting Group speaks of another 160 million people in China, people who possibly do not possess a car today. But will earn at least 20’000 US$ by 2020 and buy one. This will give oil prices another boost upwards. On the other side, the already falling Chinese current account surplus is poised to become a deficit due the rising costs of oil
Comparing “U.S. Energy Independence” with Chinese income growth and oil prices
The following table compares the growth of Chinese income data with the EIA data. Additionally we added some rather modest growth rate estimates for Chinese income between 2012 and 2035 and modest increases of the oil and gas price – at least when compared to the development between 2000 and 2010.

U.S. Energy independence vs. Chinese income (sources: CNN and BCG versus EIA and historic production and consumption)
The table clearly shows that any improvement in U.S. oil production are cancelled out by the rise of the oil price. The daily costs for importing foreign oil to the United States will be the same in 2020 as in 2012. By 2035 the costs for importing oil to the U.S. will nearly double.
| Period | billion barrels imported | Money Sent Overseas in bln. $ | Costs per barrel (incl. transport) | avg. WTI Price | avg. Brent Price |
|---|---|---|---|---|---|
| April 2014 | 0.284 | 30.6 | 102 | 108 | |
| June 2013 | 0.296 | 30.5 | 103.04 | 95.61 | 103.19 |
| December 2012 | 0.318 | 34.8 | 109.49 | 88.25 | 109.2 |
| Whole 2012 | 3.9 | 434 | 111.28 | 94.15 | 111.68 |
See more for


