


George Dorgan
My articles My siteAbout meMy videosMy books
Follow on:LinkedINTwitterSeeking Alpha
CFA SocietyEconomicBlogs
| Both Chinese PMI and the producer price index (PPI) are in deflation since 2012. This opens a lot of questions about the sustainability of Chinese economic growth, but also about the certain economic theories that consider deflation as a precursor of depression, as it did in the early 1930s. |
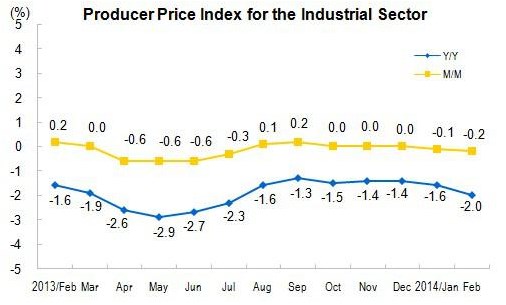 Producer Price Index 2014 (source China Statistics) |
| China’s speed of economic growth simply slows, recently to 7%, according to China statistics “China’s Economy Showed Moderate but Steady Growth“. |
 For the second year producer prices remain in deflation |
Our Questions
|
 Prices since 2012 in contraction area |
| 3. How – according to Keynesians – is deflation in factory output prices consistent with real GDP growth of 7% or more?
4. Can lower commodity prices, better technology and fierce internal competition really move Chinese industrial producer output prices into deflation when salaries are still rising quite strongly? 5. If Chinese factory prices are falling by 2% per year and U.S. factory prices are increasing by 1% (consider additionally the slightly stronger Yuan), how is it possible that U.S. manufacturing has improved since last year? Is there no price competition? Are products different? 6. Or is it just the typical home-bias in demand fulfillment, namely that higher local U.S. demand is translated in higher local industrial production? Or was the fact that in 2013, mostly the upped 10% profited from the upturn in the U.S. economy, and these people are not very price-sensitive? |
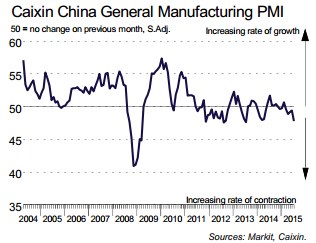 The PMI remains at 50 or lower but no depression in sight |
Markit’s answerWe are happy to have obtained some answers from Markit, that together with HSBC provided the purchasing manager index until 2014. |
 |
Question 1:
A PMI value of 50.0 signals no change from the previous month, while a reading below the 50.0 no-change mark signals a contraction in a strict sense, but we’ve found in many cases that this doesn’t generally hold when comparing with official data.
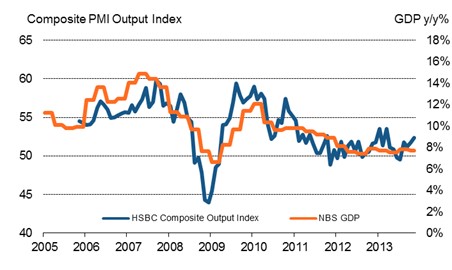
Generally speaking, our China Composite PMI (which covers both manufacturing and service sectors) holds well with official GDP, shown below.
When comparing the Output PMI with GDP a PMI index reading of 50.0 would indicate that the economy is growing (in China’s case) at a similar pace to that recorded in the previous month. If the Output PMI averaged 50.0 over a quarter, it would signal that GDP growth was relatively unchanged from the previous quarter. Meanwhile, a sub-50.0 PMI reading , as signalled in our recent Flash release, seems to be indicative of a slowdown in the level of growth. This is particularly noticeable in China, which has seen relatively moderate growth in recent years compared with its breakneck speeds of expansion seen throughout much of the 1990s and 2000s. I think some research performed on the ISM PMI data suggested that around a mark in the low 40s is where output actually begins to fall on the official data.
So, while a below-50.0 index reading may not directly translate into a reduction of output in the case of official manufacturing data, for example, it could be signalling a weaker pace of Industrial Production (it is also worth noting Industrial Production covers not only the manufacturing sector, but additional sectors such as mining, quarrying and utilities. However, the NBS do not fully disclose their methodology).
For input and output prices, PMI readings can be interpreted in the same way- with readings of 50.0 suggesting that prices are unchanged from the previous month, while a reading below 50.0 may signal slowing inflationary pressures or indeed deflation (depending on the context of the data).
Finally, it’s worth bearing in mind that official and PMI data essentially measuring changes in the economy in slightly different ways.
High (or low) PMI readings essentially capture (in a weighted) manner movements in (e.g.) output in a broad based manner – we are asking companies to signal whether output is up or down, not by how much, so readings vastly different from 50.0 essentially represent many companies reporting that output is higher over the month (or lower if we are well below 50.0).
Official data is of course about measuring quantitative changes. With this in mind, it’s not immediately clear why the 50.0 mark should necessarily reconcile with say stagnation on the official data if one was to think about the distribution of how those who see output rise compared to those who report a decline (e.g. 25% of companies could report an average 10% rise in the level of output, 50% no change, 25% on average a 2% fall – on a PMI this could be seen as 50.0 no change, but in official data, we would actually be reporting growth given the average growth rate compared to the average rate of contraction).
Markit Economics
Question 3: Do your price level of an index value 40 implies y/y deflation? or just less inflationary pressure?
How can 7.5% real GDP growth be consistent with falling prices?
It’s important to distinguish between annual growth rates and quarterly (or monthly) growth. i.e. the official measure of IP showed a 0.1% fall in the three months to Dec after a 0.9% rise in Q3. A 50 index reading means no change on the prior month not on the prior year.
Sub-50 price indices therefore mean (on a non-seasonally adjusted) basis that more panellists have reported price falls than those who have signalled a rise on the prior month, though the annual rate of change may still remain positive.
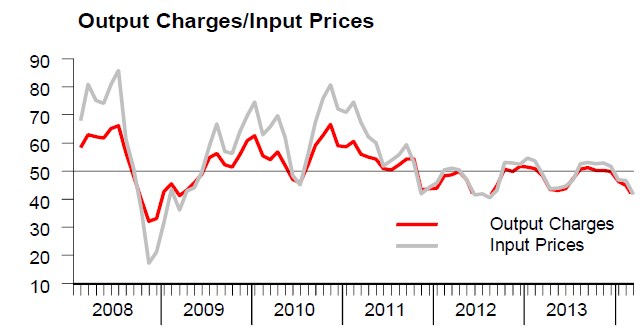
As the graphs above demonstrate, the relationship between the HSBC/Markit Input Prices Index has a strong relationship with both official Producer Prices & Consumer Prices Indices regarding the path of inflationary/deflationary pressures. Again, it is worth noting that this is comparing a diffusion index to annual percent changes.
Index readings of around 40.0 have also been consistent with slower inflationary pressures in the economy as measured by CPI, rather than deflation, with deflation only recorded ar
Markit Economics


