


George Dorgan
My articles My siteAbout meMy videosMy books
Follow on:LinkedINTwitterSeeking Alpha
CFA SocietyEconomicBlogs
Update December 2013:
Goldman Sachs: Cut your Emerging Markets exposure by a third!
Goldman Sachs Asset Management via Business Insider
“I have chosen to focus on the world,” said Jim O’Neill in his final note as an economist for Goldmans Sachs.
O’Neill, who is famous for coining the acronym BRICs, discusses how the BRICs and other growth markets will continue to be an increasingly important driver of global growth.
“If China grows by 7.5% in this decade, and if the developed world returns close to trend, then the world will grow by around 4%,” he said.
And in this environment, O’Neill argues that the stock market is a great place to be invested.
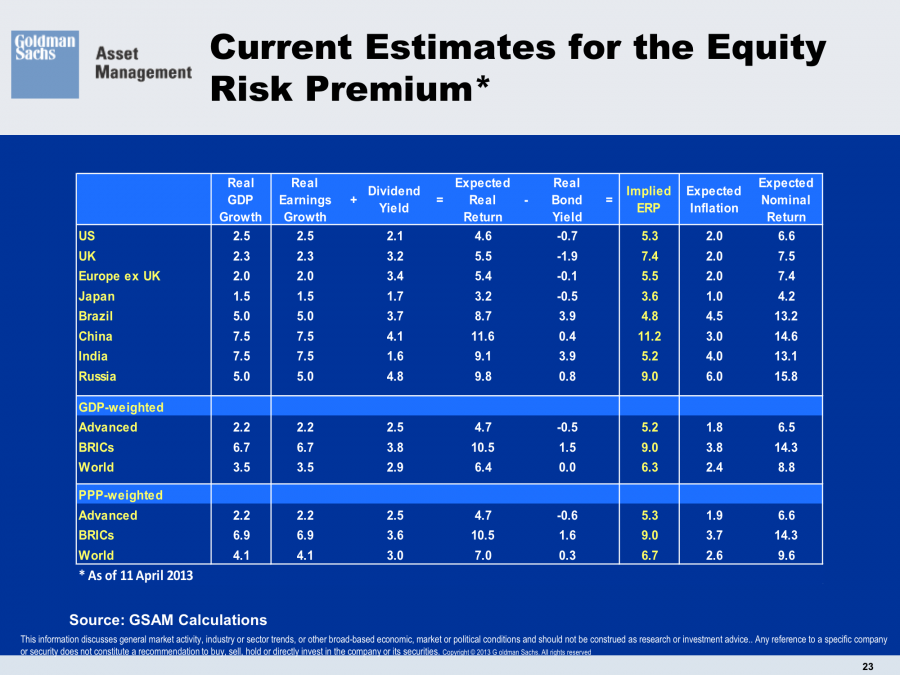
“Current ERP (equity risk premium) levels continue to indicate that equity markets are still quite attractive in many parts of the world,” he said.
O’Neill provides forecasts for all of the major economies in both the developed and developing worlds.
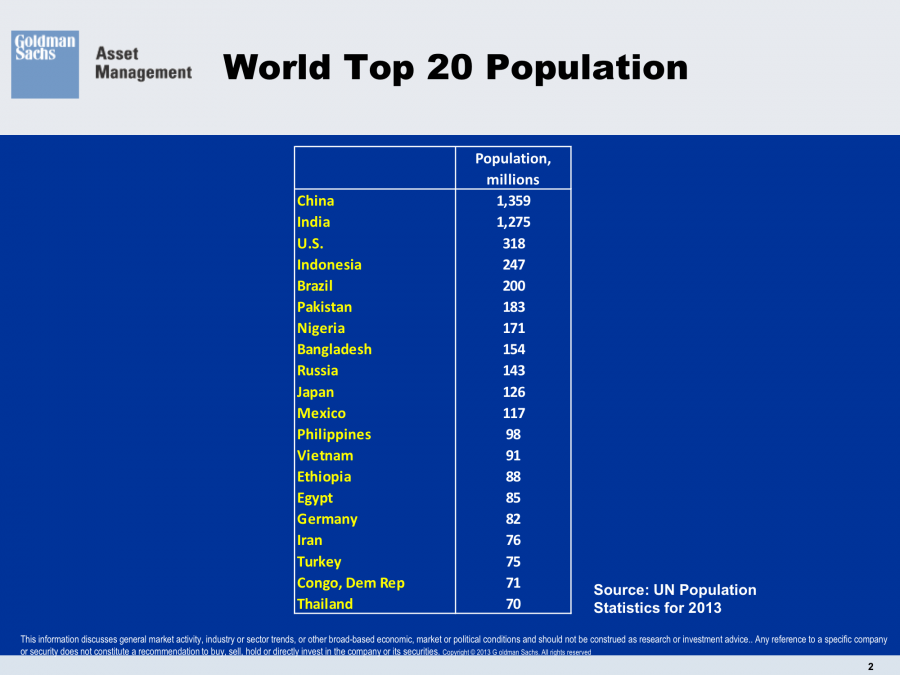
World Top 20 Population - Click to enlarge
Goldman Sachs Asset Management
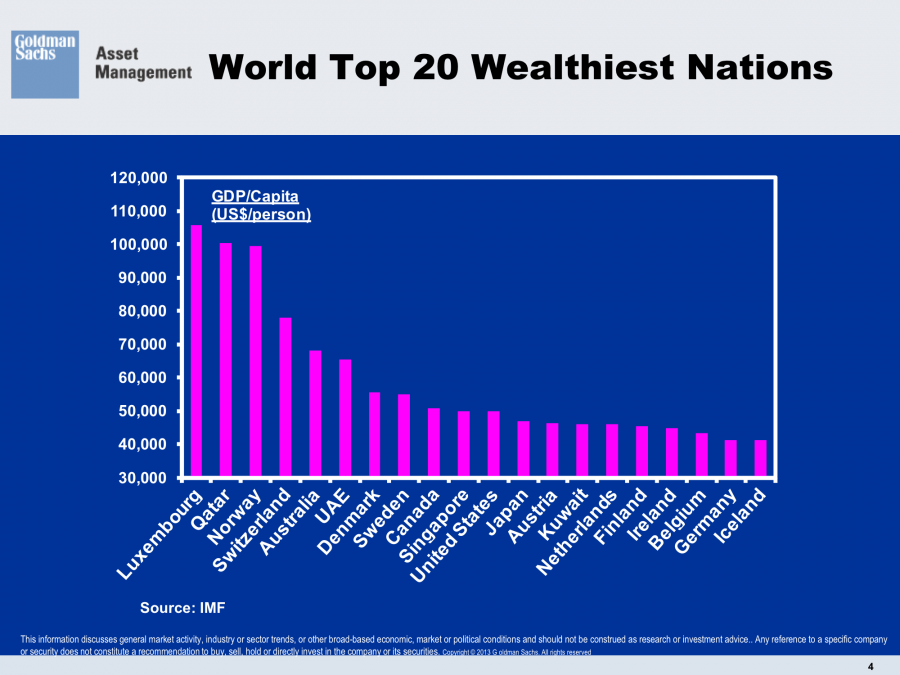
World Top 20 Wealthiest Nations - Click to enlarge
Goldman Sachs Asset Management
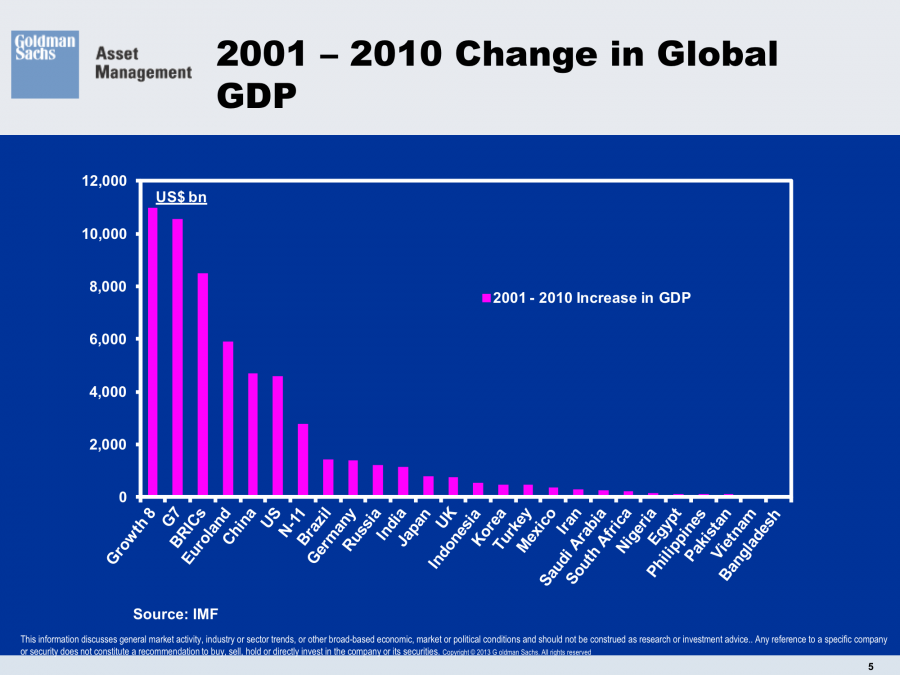
2001-2010 Change Global GDP - Click to enlarge
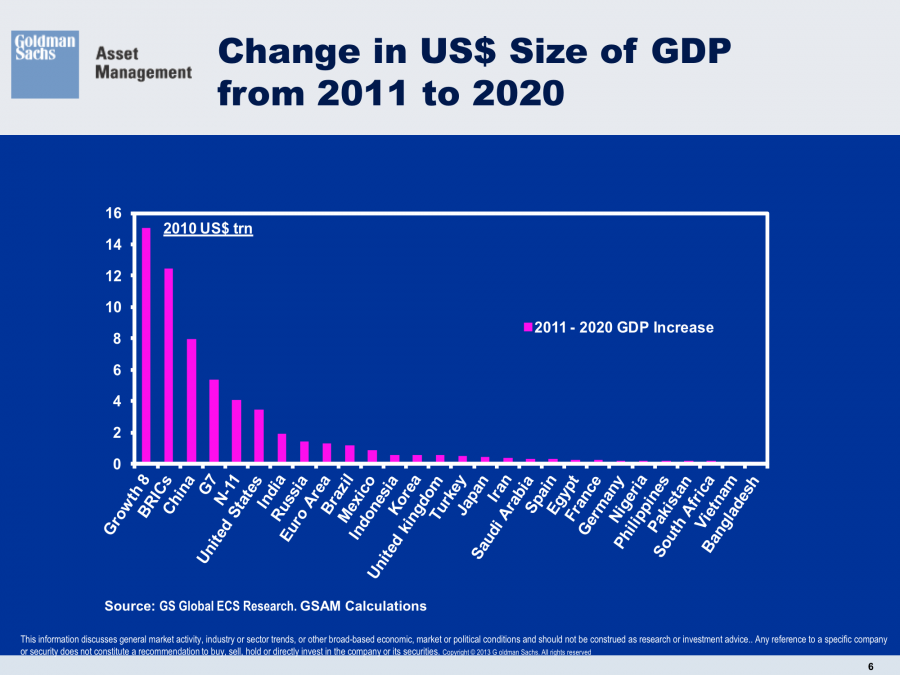
Goldman Sachs Asset Management:
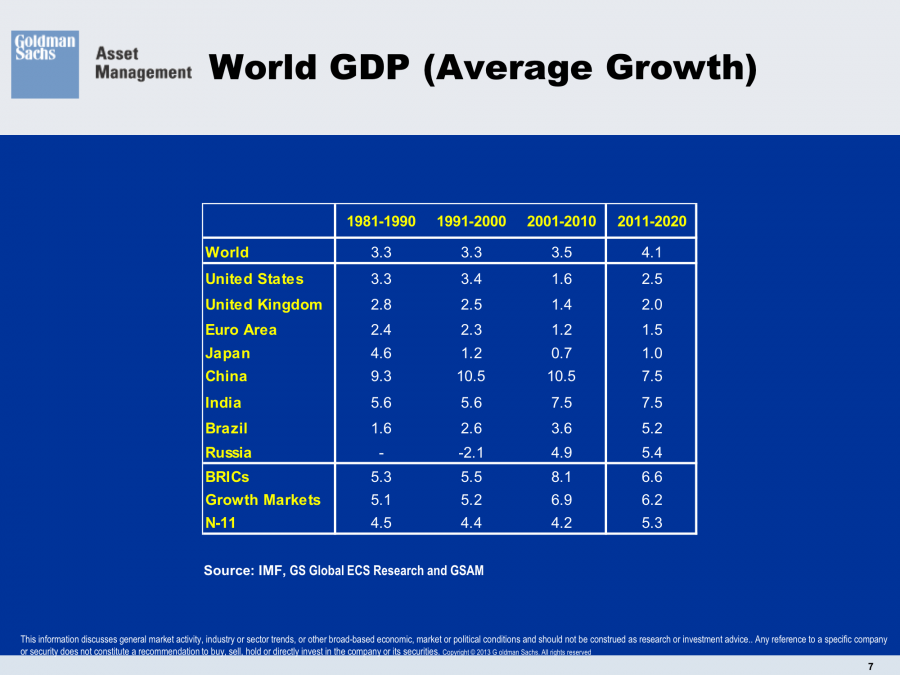
1981 to 2020 World GDP Growth - Click to enlarge
Comment George Dorgan:
“Growth markets” are slowing:
- Higher wages made the BRICS less competitive.
- Lower demand for BRICS exports due to the austerity policy caused by the euro crisis since Summer 2011.
- The nearly 40% depreciation the Japanese yen against the yuan, has weakened Chinese exports. The recovery thanks to weaker Brent oil and other commodity prices should be quite quick.
As opposed to the other four, we believe in China, that continues to be competitive, because it does not allow for quick wage increases. The following picture explains how China replaces the effect of higher wages with more capital and better technology.
Technology in Output per Worker - Click to enlarge
Russia, South Africa and partially Brazil have the Dutch disease, they are dependent on high commodity prices. Russia, India, Brazil and South Africa have a wage inflation issue. Outsourcing to India in the IT area might become less and less profitable. By 2020 we do not see any big wage advantages for the BRICS any more. Just China should still be strong. We see more chances for newly emerging markets, i.e. in Africa.
Current account surpluses are moving from Asia to Europe, especially Germany, Sweden, Norway, Finland and Switzerland, the ones that often provide the technology for the Chinese expansion.
India, Indonesia or Brazil already have current account surpluses, things will be more difficult in the upcoming decade, especially when consumption in Europe or the US is restricted.“Russia struggles with high inflation and low GDP growth. 1.7% in 2013 vs. 2.1% in 2012″
“At the headline level, Brazil’s economy has undergone what Nomura economist Tony Volpon calls a “sudden stop”, from 7.5 per cent in 2010, to 2.7 per cent in 2011 and now less than 1 per cent in 2012″. source“As per IMF’s projections, India‘s real economic growth was 11.2 per cent in 2010, 7.7 per cent in 2011 and 4 per cent in the last calender. Indications for FY 2012/2013 are 4.5%.”South Africa (that completed the BRIC states to “BRICS”): “The poll taken during the course of last week saw the median for economic growth unchanged from last month at 2,6% for this year, 3,3% next year and 3,6% in 2015. The most pessimistic view is 2,3% for this year. We believe that there are downside risks to our growth forecast and upside risks to the current account deficit if there is significant strike activity, particularly in the mining sector,” said Peter Worthington, economist at Absa Capital. (A) challenge for fiscal policymakers is the endless waves of disruptive strike action, and the impact this has on GDP growth,” said Colen Garrow, economist at Meganomics. ” source

Goldman Sachs Asset Management

Goldman Sachs Asset Management

Goldman Sachs Asset Management
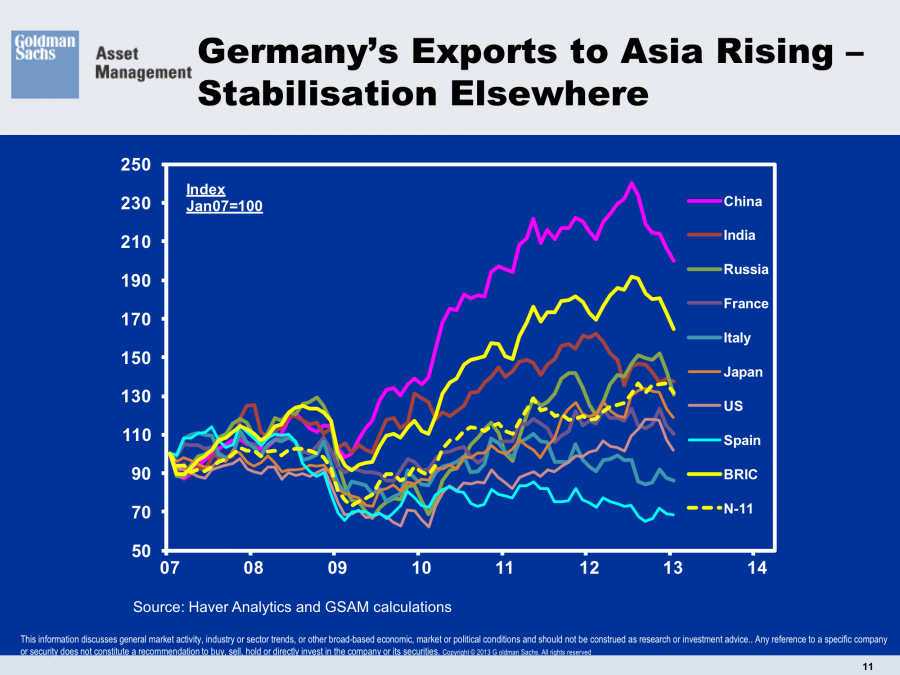
Shift in German Exports Trading Partners - Click to enlarge
Goldman Sachs Asset Management
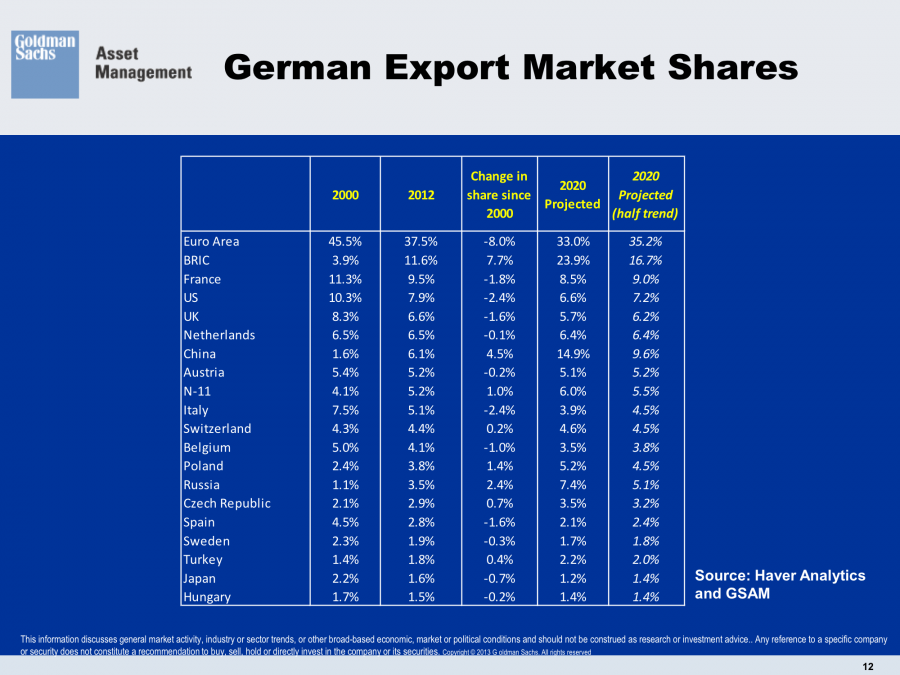
German Export Share 2000 to 2020 - Click to enlarge
Goldman Sachs Asset Management

Goldman Sachs Asset Management
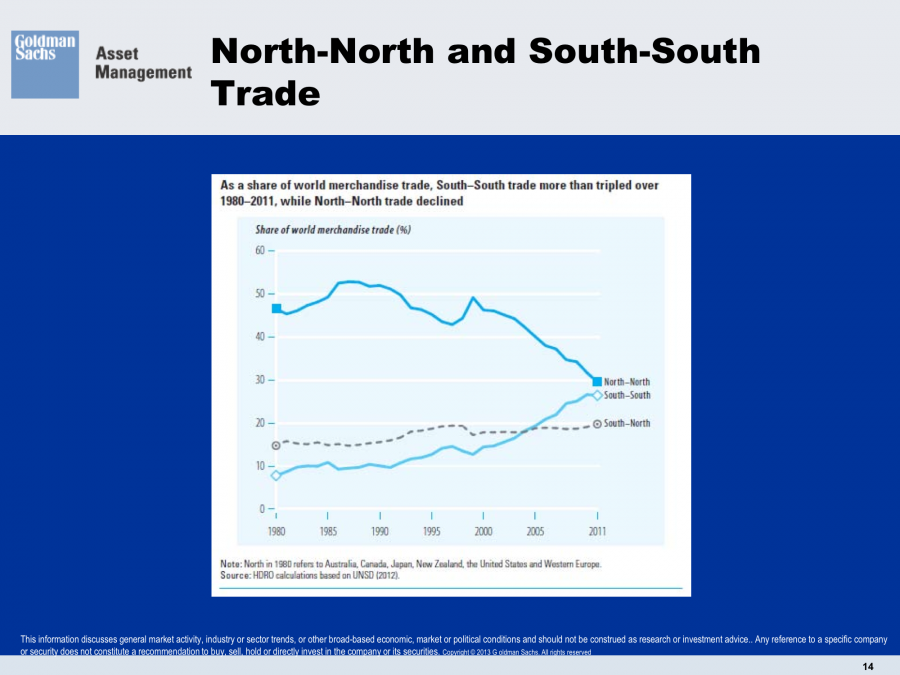
North North Trade South South Trade - Click to enlarge
Goldman Sachs Asset Management
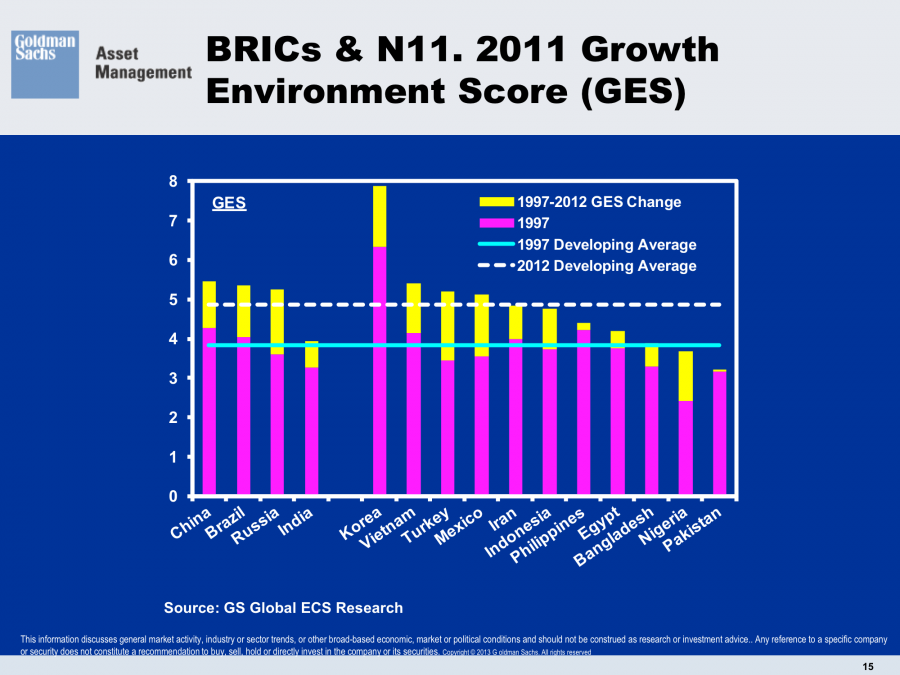
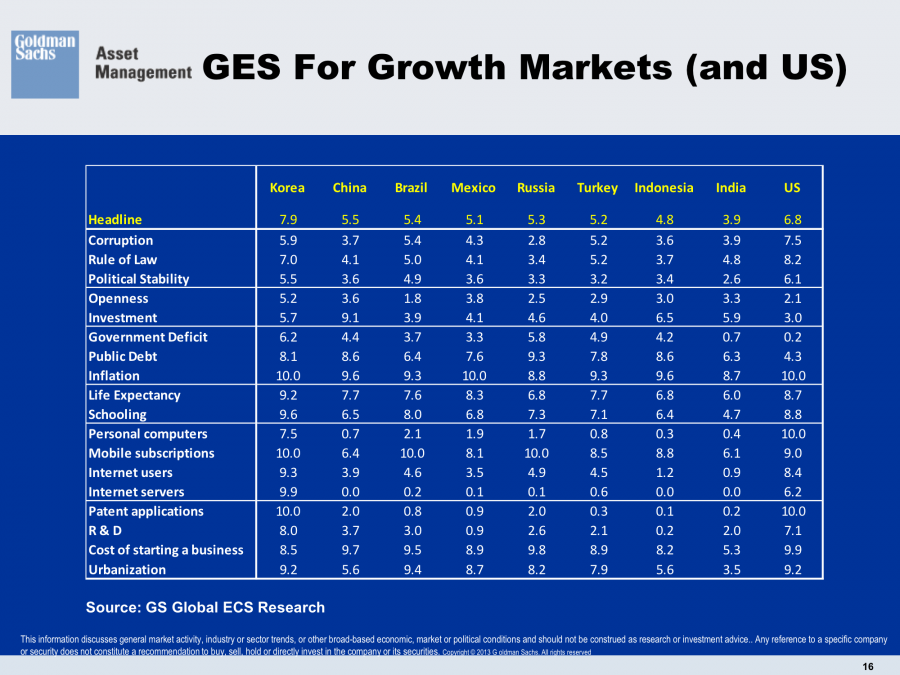
Growth Environment Score 18 Variables Goldman Sachs - Click to enlarge
Goldman Sachs Asset Management
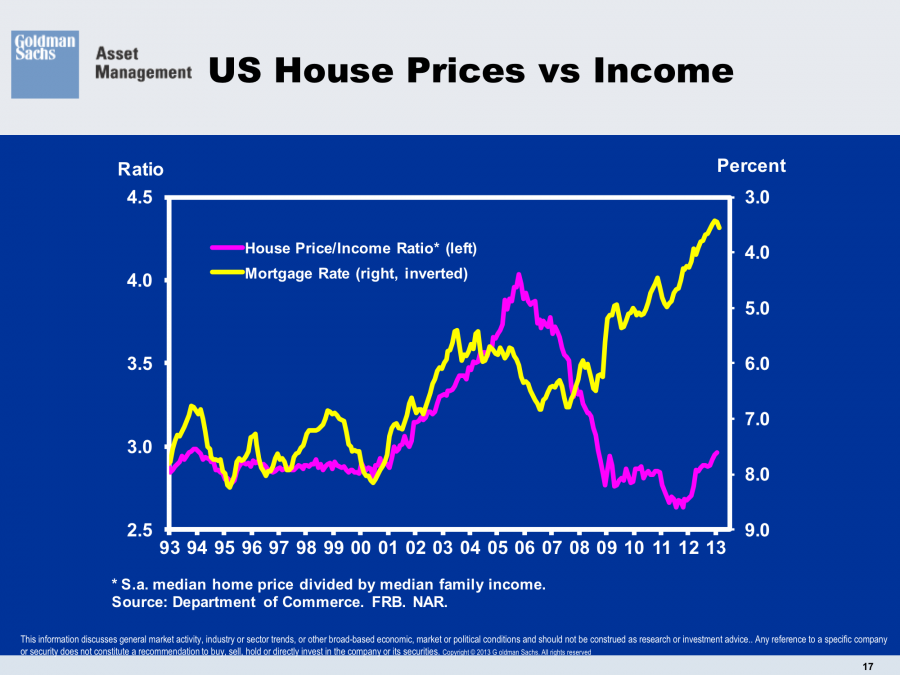
US House Prices vs Income

US Balance of Payments vs Current Account Deficit to GDP
Goldman Sachs Asset Management
Goldman Sachs Asset Management

Goldman Sachs Asset Management
 Goldman Sachs Asset Management
Goldman Sachs Asset Management


